the Creative Commons Attribution 4.0 License.
the Creative Commons Attribution 4.0 License.
 | 06 Sep 2018
An 800-year high-resolution black carbon ice core record from Lomonosovfonna, Svalbard
Dimitri Osmont
Isabel A. Wendl
Loïc Schmidely
Michael Sigl
Carmen P. Vega
Elisabeth Isaksson
Margit Schwikowski
Produced by the incomplete combustion of fossil fuel and biomass, black carbon (BC) contributes to Arctic warming by reducing snow albedo and thus triggering a snow-albedo feedback leading to increased snowmelt. Therefore, it is of high importance to assess past BC emissions to better understand and constrain their role. However, only a few long-term BC records are available from the Arctic, mainly originating from Greenland ice cores. Here, we present the first long-term and high-resolution refractory black carbon (rBC) record from Svalbard, derived from the analysis of two ice cores drilled at the Lomonosovfonna ice field in 2009 (LF-09) and 2011 (LF-11) and covering 800 years of atmospheric emissions. Our results show that rBC concentrations strongly increased from 1860 on due to anthropogenic emissions and reached two maxima, at the end of the 19th century and in the middle of the 20th century. No increase in rBC concentrations during the last decades was observed, which is corroborated by atmospheric measurements elsewhere in the Arctic but contradicts a previous study from another ice core from Svalbard. While melting may affect BC concentrations during periods of high temperatures, rBC concentrations remain well preserved prior to the 20th century due to lower temperatures inducing little melt. Therefore, the preindustrial rBC record (before 1800), along with ammonium (NH, formate (HCOO−) and specific organic markers (vanillic acid, VA, and p-hydroxybenzoic acid, p-HBA), was used as a proxy for biomass burning. Despite numerous single events, no long-term trend was observed over the time period 1222–1800 for rBC and NH. In contrast, formate, VA, and p-HBA experience multi-decadal peaks reflecting periods of enhanced biomass burning. Most of the background variations and single peak events are corroborated by other ice core records from Greenland and Siberia. We suggest that the paleofire record from the LF ice core primarily reflects biomass burning episodes from northern Eurasia, induced by decadal-scale climatic variations.


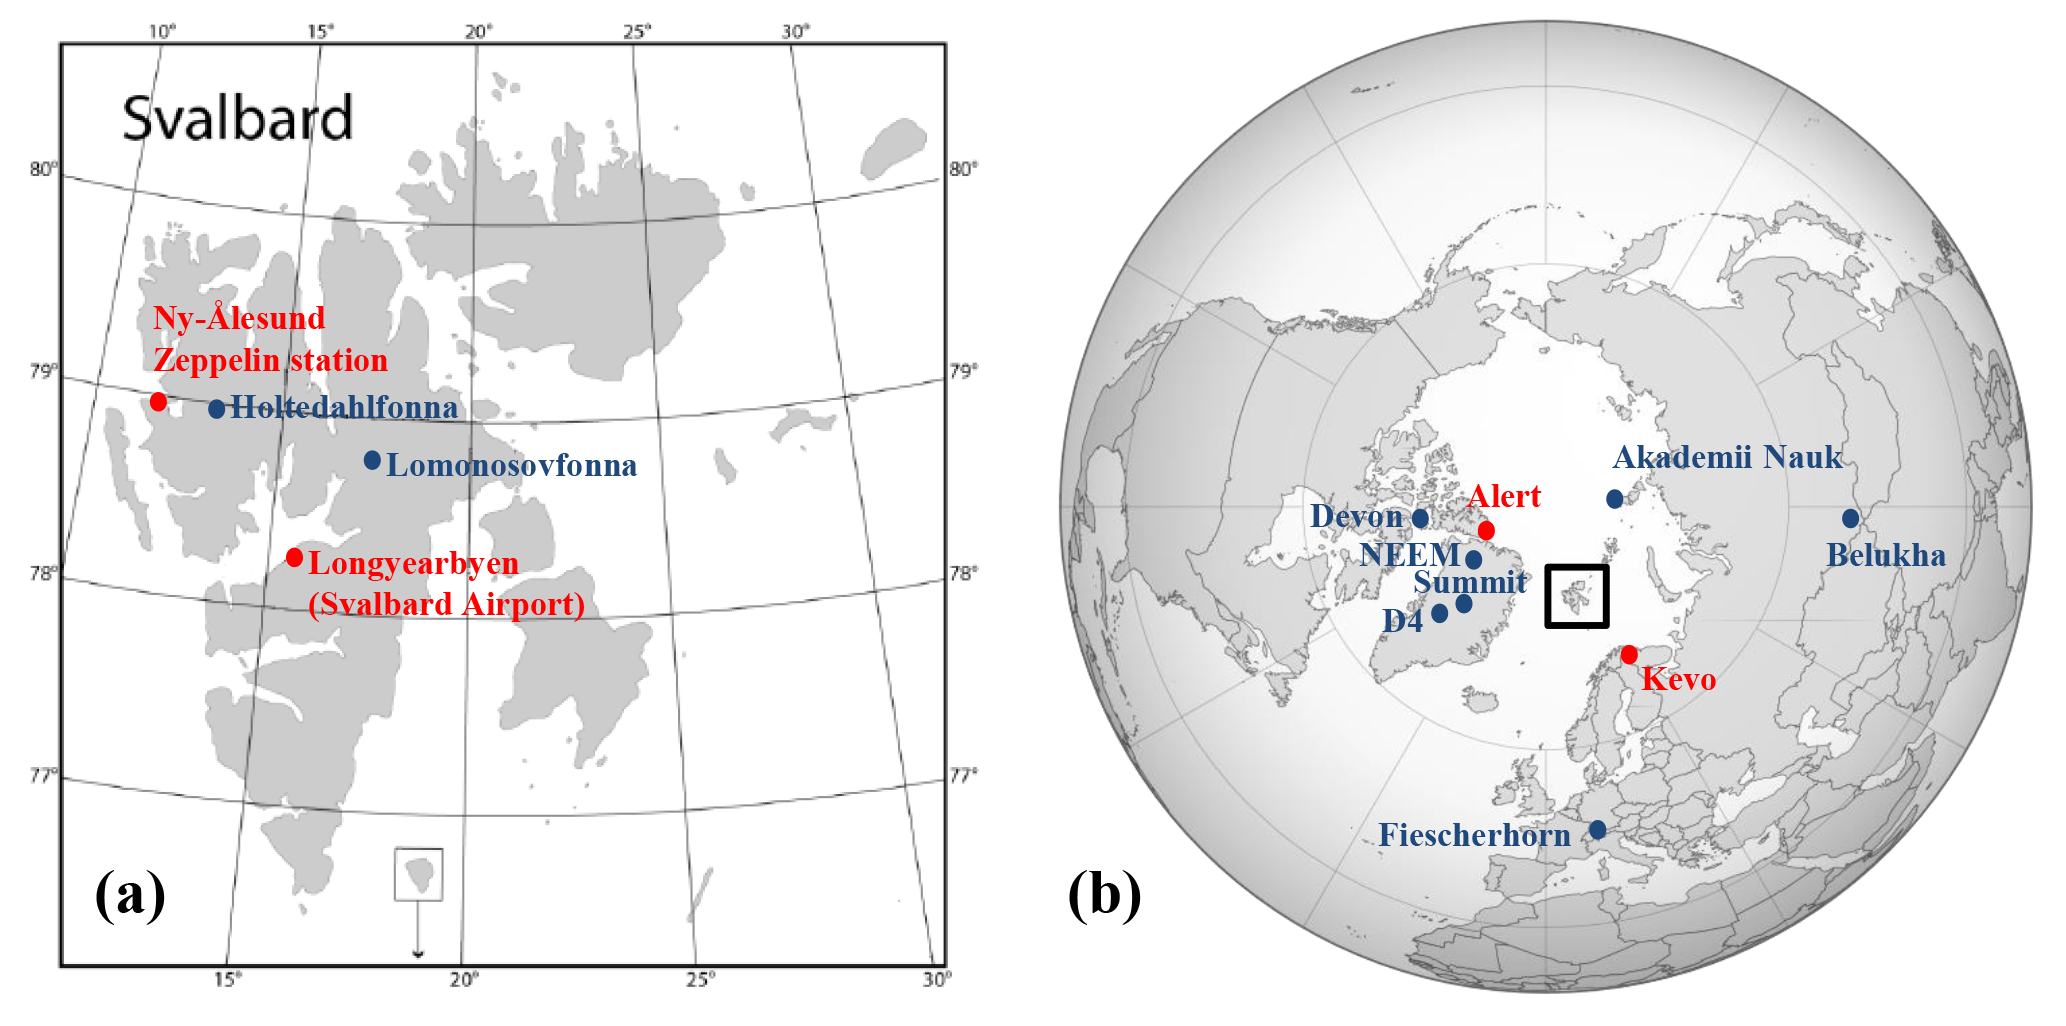
Figure 1(a) Map of Svalbard with the location of the sites of interest (adapted from Wendl et al., 2015). (b) Map with the other sites of interest mentioned in this study. Ice core sites are in blue and atmospheric measurement stations in red.
In the last decades, the Arctic region has experienced the strongest surface air temperature increases globally, referred to as the Arctic amplification (Serreze and Barry, 2011), leading to a range of severe consequences for glaciers, sea ice, wildlife, and local human societies and partially explained by strong snow and sea ice feedbacks implying surface albedo changes. Black carbon (BC) is one of the substances involved in this process. BC consists of aggregates of carbonaceous spherules produced in the form of aerosols by the incomplete combustion of fossil fuel and biomass. BC does not refer to a single well-defined compound because carbonaceous aerosols are emitted in the form of a continuum of compounds with different physical and chemical properties (Goldberg, 1985), leading to a complex terminology depending on the method used for its quantification. Here we follow the recommendations given by Petzold et al. (2013) and will use the term rBC (refractory black carbon) when referring to our measurements carried out with the laser-induced incandescence method. BC possesses some unique properties: it is highly refractory, strongly absorbs visible light and has a very low chemical reactivity (AMAP, 2011a; Bond et al., 2013). Its strong absorptive ability impacts the Earth radiative budget and contributes to global warming via three main effects: a direct radiative forcing by sunlight absorption in the atmosphere, a modification of cloud properties whose mechanisms remain poorly understood, and a snow and ice forcing when BC is deposited on those surfaces, thus lowering their albedo and triggering melting (Bond et al., 2013; Hansen and Nazarenko, 2004). This latter effect is of great importance in the Arctic because most of the surface is permanently covered with snow and ice and BC concentrations in snow normally peak in spring, due to the Arctic haze phenomenon (Quinn et al., 2007; Shaw, 1995), when daylight hours increase considerably and mean surface air temperatures rise (Flanner et al., 2007). BC could be the second largest contributor to global warming after carbon dioxide (Ramanathan and Carmichael, 2008). However, given its short atmospheric lifetime from days to weeks, BC impacts can be considerably lowered when mitigation strategies are implemented (Bond et al., 2013).
Current global BC emissions are dominated by anthropogenic sources including industry, energy production, diesel engines and residential biofuel uses. While Western countries were responsible for most of the BC emissions until the mid-20th century, emerging economies in Asia are currently the major contributors (Bond et al., 2007, 2013). Conversely, before the beginning of the Industrial Revolution, biomass burning sources were largely predominant (Bond et al., 2013), encompassing wildfires and wood burning for heating, cooking and agricultural purposes. These general trends have been confirmed by recent ice core records from Greenland (Keegan et al., 2014; McConnell et al., 2007; Sigl et al., 2013), the Himalayas (Jenkins et al., 2016; Kaspari et al., 2011), the Caucasus (Lim et al., 2017) and the Alps (Jenk et al., 2006). However, detailed source attribution remains difficult because every record is the synthesis of a wide range of BC emission sources, transport, deposition and post-deposition processes. Therefore, more ice core records are needed to achieve a finer spatial and temporal representativeness of BC in the Arctic, which can be used to better constrain climate–aerosol model simulations (Bauer et al., 2013; Lee et al., 2013).
Table 1rBC or EC concentrations (italic) from different ice core and snow studies in the Arctic and in Europe.
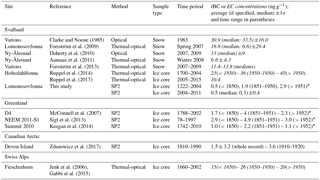
* Calculated from annual averages.
The Svalbard archipelago, located 700 km north of mainland Norway, is of great interest within the Arctic because it is subject to air masses originating from different sources compared to Greenland (Fig. 1). While it is commonly assumed that North America is the dominant source region of air masses reaching Greenland (Fuhrer et al., 1996; Legrand et al., 2016; Shindell et al., 2008), an attribution supported by ammonium (Fischer et al., 2015) and BC records (McConnell et al., 2007) from Greenland ice cores, atmospheric and ice core data from Svalbard rather reflect emissions from Eurasia (Eleftheriadis et al., 2009; Goto-Azuma and Koerner, 2001; Tunved et al., 2013). Hirdman et al. (2010a) showed that northern Eurasia is the dominating source of the BC detected at Zeppelin station in Ny-Ålesund (Fig. 1a) over the entire year, with an influence from Siberian boreal forest fires in summer. Therefore BC data from Svalbard are useful to better disentangle the sources of Arctic BC. Several snow studies have already been conducted in Svalbard in order to assess the BC impact on surface albedo (Clarke and Noone, 1985; Doherty et al., 2010; Forsström et al., 2009, 2013) and the contribution from local BC sources such as coal mining (Aamaas et al., 2011) (Table 1). Atmospheric BC concentrations at Zeppelin station show a decreasing trend in the most recent years (Eleftheriadis et al., 2009; Hirdman et al., 2010b), confirmed elsewhere in the Arctic (Dutkiewicz et al., 2014; Gong et al., 2010; Sharma et al., 2004). However, only one long-term ice core record, drilled at Holtedahlfonna (HDF) (Fig. 1a), is available from Svalbard, based on the analysis of elemental carbon (EC), a proxy for BC obtained by thermal-optical measurements (Ruppel et al., 2014). Like the Greenland BC records, the record from HDF shows anthropogenic BC emissions starting in the second half of the 19th century and peaking around 1910. A recent and unexpected EC increase is also visible from 1970 onwards, contradicting atmospheric data and remaining partially unexplained (Ruppel et al., 2014). Several hypotheses have been discussed, such as increased flaring emissions from Siberia (Stohl et al., 2013) or changes in BC scavenging efficiencies due to higher temperatures. However, in a more recent study on a shallow firn core from the same ice field, no comparable recent increase could be detected (Ruppel et al., 2017).
Like other low elevation sites in the Arctic, Svalbard glaciers experience recurrent summer melting, which can alter the ice core records due to water percolation through the snowpack, leading to relocation of chemical compounds or even runoff in the warmest years. Pohjola et al. (2002) and Vega et al. (2016) concluded that most of the atmospheric signal was preserved at an annual, or in the worst cases, at a biannual resolution in the Lomonosovfonna 1997 (LF-97) and 2009 (LF-09) ice cores. Moore et al. (2005) also confirmed that chemical stratigraphy remained preserved despite high melt ratios. More recently, the impact of melting on the HDF ice core was assumed to be low compared to the EC deposition signal (Ruppel et al., 2014, 2017). Similar findings were postulated for the Lomonosovfonna 2009 (LF-09) ice core in which melting impact was negligible on ionic species at a decadal resolution (Wendl et al., 2015). However, it can become an issue when dealing with high-resolution records: Kekonen et al. (2005) found percolation lengths of up to 8 years for the warmest periods and half of the variance of the chemical dataset at those sites can be explained by post-depositional effects (Beaudon et al., 2013).
Other covarying proxies can also be used to help disentangle the BC origin. Non-sea-salt sulfate () and nitrate () are well-known tracers of anthropogenic pollution reaching Svalbard during the 20th century. These ions originate from increased SO2 and NOx emissions from Eurasia (Goto-Azuma and Koerner, 2001; Matoba et al., 2002; Wendl et al., 2015). Nitrate stable isotopes (δ15N-) measured in Svalbard ice cores have been used to apportion NOx sources associated with forest fires and anthropogenic activity (Vega et al., 2015a). Ammonium () has been widely used in polar ice cores to reconstruct past biomass burning activity (Fischer et al., 2015; Legrand et al., 2016). Formate (HCOO−) is another appropriate proxy, despite post-depositional effects (Legrand et al., 2016). Specific organic tracers of biomass burning such as vanillic acid (VA), levoglucosan, or p-hydroxybenzoic acid (p-HBA) have also been recently introduced (Grieman et al., 2015, 2017, 2018; Kawamura et al., 2012; Kehrwald et al., 2012; McConnell et al., 2007; Zennaro et al., 2014). In Arctic ice cores, while VA is rather associated with conifer and deciduous boreal tree burning, p-HBA is thought to be predominantly emitted by tundra grass and peat burning (Grieman et al., 2018). However, little is known about their potential degradation in the atmosphere and their sensitivity to post-depositional processes, and their stability in the atmosphere has been recently questioned (Hennigan et al., 2010; Hoffmann et al., 2010).
Here we present the first long-term and high-resolution rBC record from Svalbard, obtained by single-particle soot photometer (SP2) analysis of two ice cores drilled on the Lomonosovfonna ice field in 2009 (LF-09) and 2011 (LF-11), further referred to as LF when both records are combined. After focusing on the anthropogenic imprint and its source attribution since the mid-19th century, we will discuss the impact of snowmelt on the record during the 20th century and finally we will reconstruct paleofire trends by using the preindustrial rBC record along with other biomass burning proxies.
2.1 Drilling site and ice core characteristics
Lomonosovfonna is one of the highest ice fields in Svalbard (Fig. 1), reaching 1250 m a.s.l. in its accumulation area (Isaksson et al., 2001). For this reason, it is less affected by summer melting and meltwater percolation than other low-elevation glacier sites in Svalbard (Gordiyenko et al., 1981; Pohjola et al., 2002), making it suitable for ice core studies. Therefore this site has already been regularly studied in the past. Two deep ice cores were retrieved in 1976 and 1982 by pioneering Soviet expeditions, mainly for stratigraphic purposes (Gordiyenko et al., 1981; Zagorodnov et al., 1984). The first extensive study that retrieved both physical and chemical records from the ice was conducted on a deep ice core drilled in 1997 by an international team (Isaksson et al., 2001).
In March 2009, using the Fast Electromechanical Lightweight Ice Coring System (FELICS) (Ginot et al., 2002), a Norwegian–Swedish–Swiss team drilled a 149.5 m long ice core on Lomonosovfonna at 1202 m a.s.l. (78∘49′24.4 N, 17∘25′59.2 E), 4.6 km south of the 1997 drilling site, which could not be accessed due to the opening of a large crevasse. Bedrock at about 200 m of depth was not reached during the drilling. Further details about the drilling and the meteorological setting can be found in Wendl et al. (2015). This ice core was then shipped frozen to the Paul Scherrer Institute (PSI) in Switzerland. In addition to the LF-09 ice core, a 7.6 m shallow firn core was retrieved in April 2011 ∼110 m to the north and ∼20 m to the west of the LF-09 site by a team from the Uppsala University and processed at the Norwegian Polar Institute (NPI) in Tromsø (Vega et al., 2015b).
2.2 Sampling, chemical analyses and dating
The LF-09 ice core was processed in a −20 ∘C cold room at PSI following well-established procedures (Eichler et al., 2000). In total, 3997 samples were cut at 3–4 cm resolution, which corresponds to about monthly resolution at the top of the core to annual resolution at the bottom. The dating was performed using a multi-parameter approach including annual layer counting of the δ18O and Na+ signals back to 1750, 210Pb decay, a two-parameter fit, and absolute reference horizons such as volcanic eruptions (sulfate peaks) and the well-documented 1963 tritium peak (Wendl et al., 2015). The LF-09 ice core thus spans the time period from 1222 to 2009, with an average accumulation rate of 0.58±0.13 m yr−1 of water equivalent (w.e.). The dating uncertainty was assessed to be ±1 year in the vicinity of the reference horizons and ±3 years in between up to 68 m w.e. of depth, ±3 years in both cases between 68 and 80 m w.e., and ±10 years below 80 m w.e. (Wendl et al., 2015). Wendl et al. (2015) also determined the annual melt percent by calculating the relative thickness of the melt features (i.e., ice lenses) for each year. For rBC analysis, two parallel samples from the inner part of the core were combined in a 50 mL polypropylene vial. When the two samples were too long to fit in a single vial, the cutting resolution was increased, overall resulting in 4046 samples. As the first 110 samples had been melted and refrozen prior to analysis, leading to potential rBC losses (Wendl et al., 2014), they were not considered in this study. Thus, the 2005–2009 time period is not covered by the LF-09 rBC record. In addition, VA and p-HBA were analyzed in the whole LF-09 ice core by Grieman et al. (2018).
The LF-11 ice core was cut at 4 cm resolution following clean protocols, resulting in a total of 155 samples (Vega et al., 2015b). The dating was performed by counting δ18O annual cycles using the winter minimum as a reference and by matching prominent ion peaks with those from the LF-09 ice core (Vega et al., 2015b, 2016). The LF-11 core thus spans the time period from 2004 to 2011, with an average accumulation rate of 0.49 m w.e. yr−1.
2.3 rBC analysis
The entire LF-09 core and the LF-11 core were analyzed for rBC at PSI in several campaigns between 2012 and 2016 and in April–May 2016, respectively, following the procedure established by Wendl et al. (2014) for liquid samples and further evaluated by Lim et al. (2014). Discrete rBC samples were melted at room temperature, sonicated in a ultrasonic bath for 25 min, and immediately analyzed using a SP2 (Droplet Measurement Technologies, USA) (Schwarz et al., 2006; Stephens et al., 2003) coupled with a jet nebulizer (APEX-Q, Elemental Scientific Inc., USA). External calibrations from 0.1 to 50 ng g−1 (R2>0.999) were usually performed twice a week by preparing eight fresh dilutions from a rBC standard (Aquadag®, Acheson Industries Inc., USA) (Gysel et al., 2011; Wendl et al., 2014). Before and after every day of measurements, the APEX-Q and the upstream capillaries were rinsed for 10 min with a solution of 3 % nitric acid prepared with ultrapure water (Sartorius, ≥18.2 MΩ cm, with a 0.2 µm filter). The liquid flow rate of the APEX-Q was monitored several times per day to avoid changes in the nebulizing efficiency, which can impact the rBC detection. When the flow rate was not steady (i.e., presented fluctuations larger than ±10 %), the measurements were stopped. The instrumental blank was checked between every sample by rinsing the setup with ultrapure water until the rBC signal returned to the baseline value of 0–1 particle cm−3. The limit of detection (LOD) was estimated by measuring ultrapure water blanks 10 times and by calculating their average plus 3 times their standard deviation, leading to a value of 0.051 ng g−1 of rBC. The procedure blank was controlled by analyzing frozen ultrapure water treated in the same way as ice core samples. Its value was always below the LOD (typically 0.01 ng g−1 of rBC), which confirms the adequate cleanliness level of the analytical procedure. In addition, six series of 20 replicate samples were cut from parallel ice core sticks and were analyzed (Fig. 2a), showing a high level of reproducibility between original and replicate samples (r=0.73, p<0.001, n=120, and averaged relative error for the 120 samples: 23 %).
Only the first 900 LF-09 samples were manually analyzed. Then a CETAC ASX-520 autosampler (CETAC Technologies, USA) was implemented in order to speed up the measurements and improve their reproducibility. Total rBC particle counting was kept to 10 000 as recommended (Schwarz et al., 2012), the limiting condition being a measuring time between 1 and 30 min. The autosampler probe was rinsed with ultrapure water for 45 s between each sample and the waiting time in each vial before data acquisition was set to 1 min 45 s, which turned out to be sufficient for the background signal to become stable. However, some difficulties arose from the fact that rBC concentrations tend to decrease with time due to particles sticking to the walls and agglomerating beyond the SP2 detection range, which implies that rBC samples have to be measured as fast as possible after sonication (Lim et al., 2014; Wendl et al., 2014). We therefore studied the rBC degradation with time by using 24 ice core samples from Lomonosovfonna and the Swiss Alps (Colle Gnifetti and Fiescherhorn ice cores). Each sample was measured between 5 and 14 times (depending on the concentration) over 24 h. They all showed a similar decreasing trend, largely independent of the ice core site, the rBC or dust concentrations. On average, the relative apparent rBC loss was 41±9 % after 24 h, and 10±6 % after 6 h, which was thus defined as the maximum waiting time considered as acceptable. To take this decrease into account, a linear regression was performed and a systematic correction as a function of time was implemented as follows:
where [rBC]corrected is the original rBC concentration at the initial time (t0), i.e., the end of the sonication (ng g−1), [rBC]measured is the rBC concentration measured by the SP2 (ng g−1), and t is the time in hours (h) elapsed since the end of the sonication.
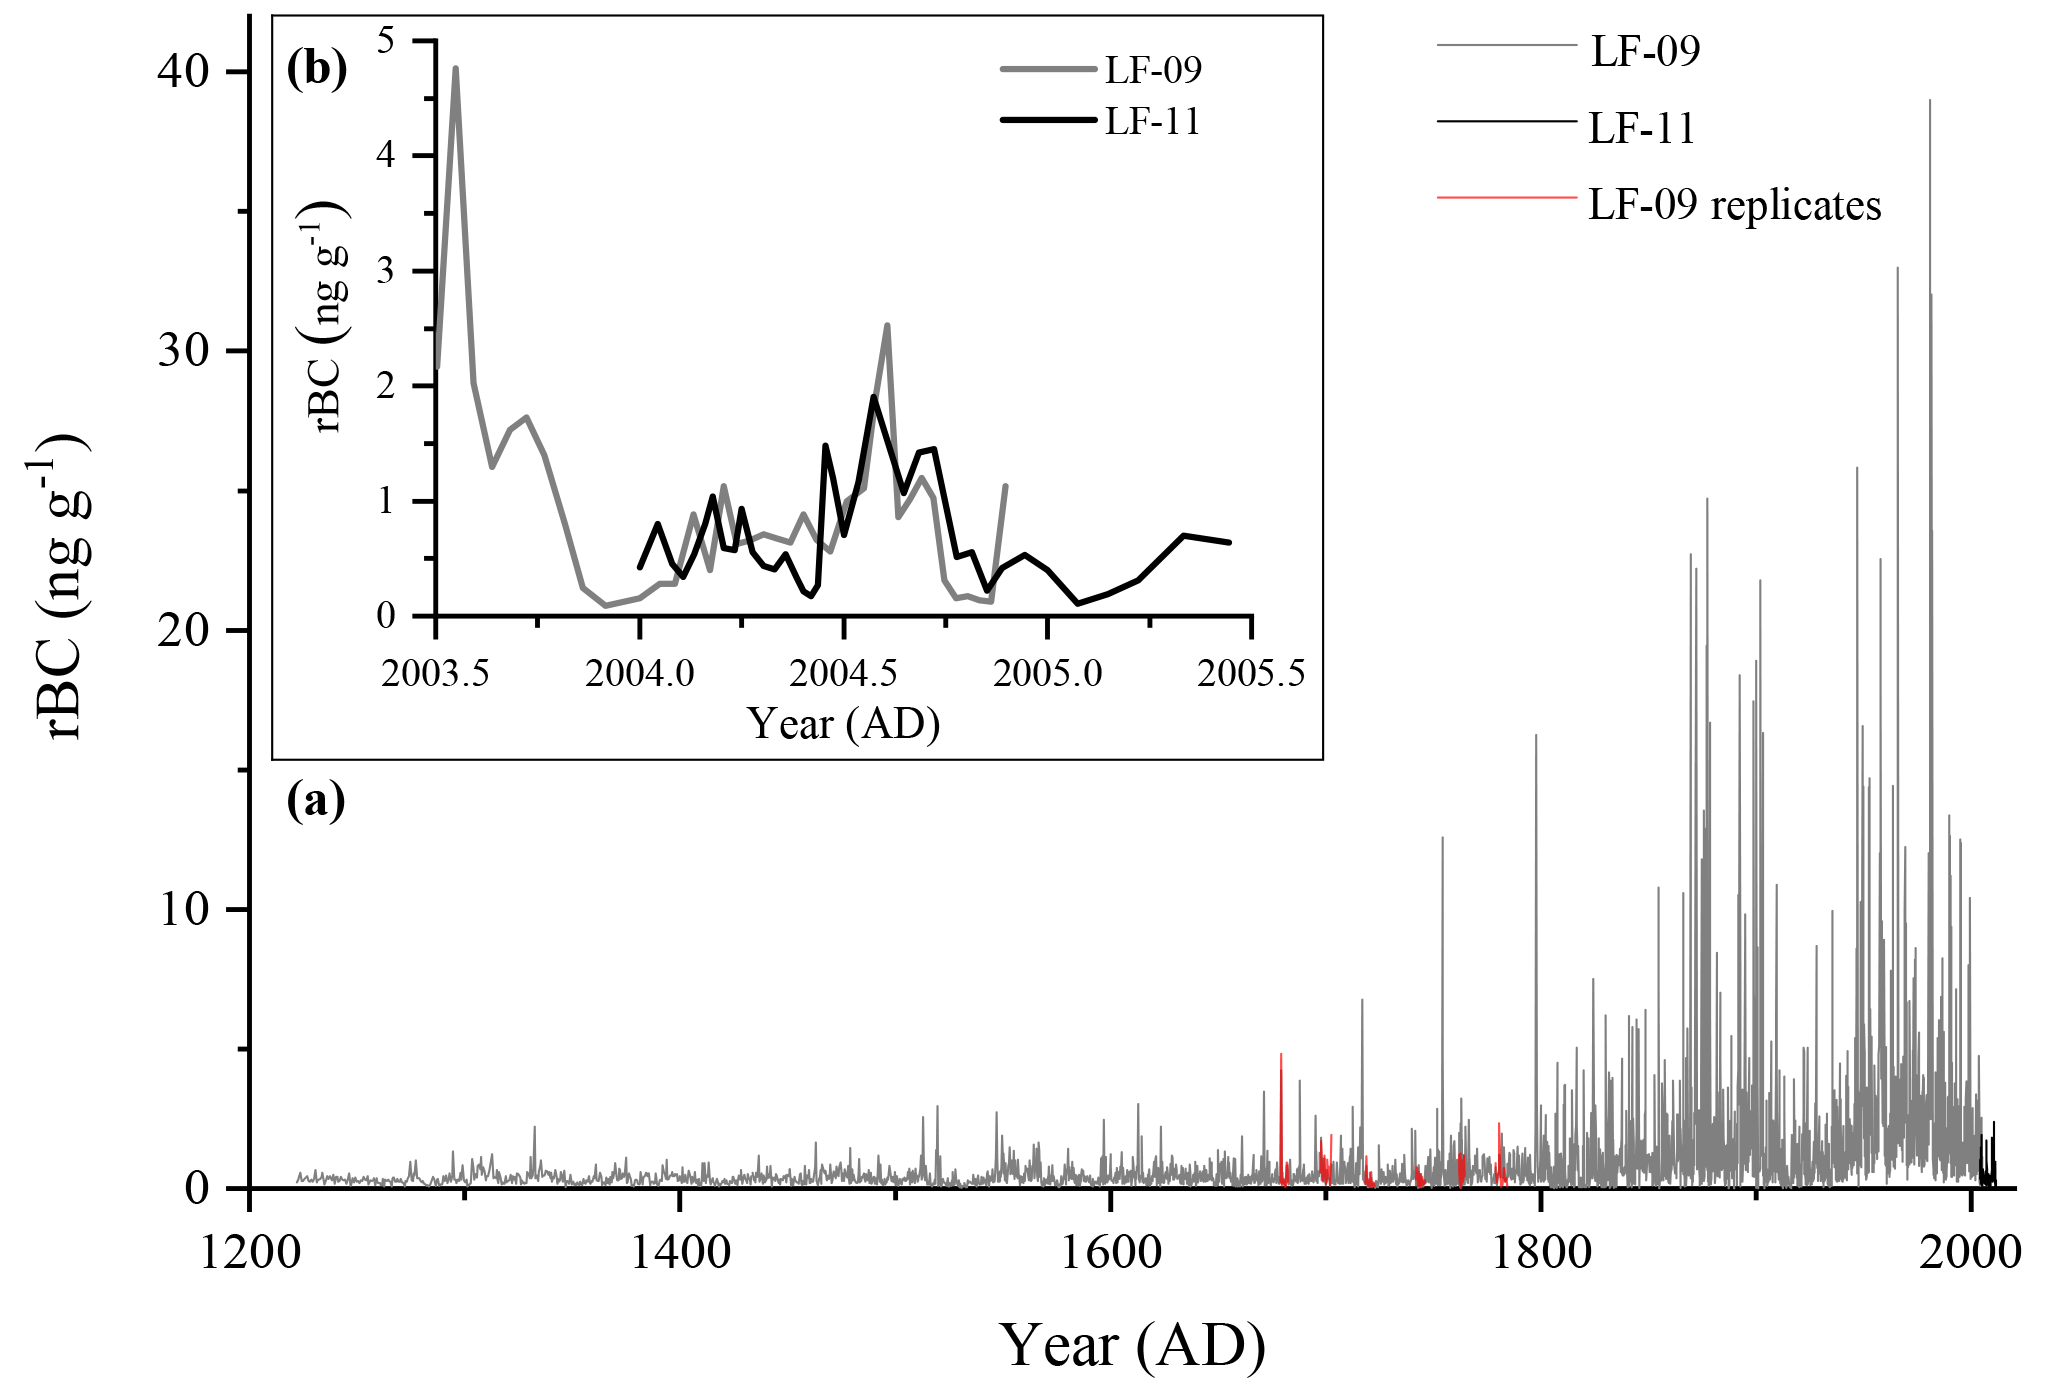
Figure 2rBC raw data from the LF-09 and LF-11 cores, (a) combined for the entire records, spanning 1222–2011 and including the replicate measurements and (b) showing the overlap between the two ice cores for the year 2004.
2.4 BC emission inventories
Historical BC emission inventories reconstructing past emissions and atmospheric loading are used to compare the LF rBC record with estimated trends in anthropogenic BC produced by fossil fuel and biomass combustion in order to carry out source apportionment. Here, we use the BC emission inventory from Bond et al. (2007) available at 5-year resolution, between 1850 and 2000, for countries or areas identified as potential BC source regions: Canada, the USA, OECD Europe, eastern Europe, and the former USSR. This inventory includes emissions from fossil fuel and biofuel combustion, but does not include open burning such as wildfires, which contribute to a substantial part of the Arctic BC burden in summer (Stohl, 2006).
2.5 Paleofire detection
Our approach to detect years with increased forest fire activity in the LF-09 ice core follows the methodology proposed by Fischer et al. (2015), which basically uses an outlier detection approach. From the annual averages, 31-year moving medians were created. For each year, the residues between the median and average were calculated. Median absolute deviations were obtained by averaging the residues over the whole LF-09 time period for specific fire proxies (VA, p-HBA) or proxies showing little anthropogenic influence (formate), and between 1222 and 1800 for proxies influenced by anthropogenic emissions (rBC, ammonium). Then a fire threshold was defined as the median plus 3 times the median absolute deviation, in such a way that this threshold takes background variations into account, which is of prime importance in the case of nonspecific proxies having other sources than biomass burning, such as biogenic emissions in the case of formate (Legrand and De Angelis, 1996) and ammonium (Eichler et al., 2009; Fischer et al., 2015; Kellerhals et al., 2010). Every annual average above this threshold can thus be considered a year with significant biomass burning emissions, and finally the centennial frequency of such episodes was obtained. As peaks can be smeared out over several years because of layer thinning with depth and post-depositional processes, a correction for neighboring outliers was implemented: a proxy signal exceeding the detection threshold over several consecutive years was considered to be a single episode and counted only once. As VA and p-HBA were available at lower resolution than the other species (Grieman et al., 2018), annual resolution was sometimes not achieved in the deepest part of the ice core and therefore missing year values were obtained by linear interpolation between the adjacent years.
3.1 High-resolution rBC record
Here we present the long-term and high-resolution rBC record from Svalbard derived from the combination of the LF-09 and LF-11 ice cores spanning the time periods 1222–2004 and 2004–2011, respectively (Fig. 2a). In the LF-09 ice core, rBC concentrations are generally low with a range between the LOD (i.e., 0.051 ng g−1) up to 39.0 ng g−1 in 1980, an average of 1.2 ± 2.3 ng g−1 (uncertainties are given as ±1σ unless otherwise stated) and a median of 0.6 ng g−1. Nominal sub-annual resolution was achieved for the entire time period, with a monthly resolution back to about 1930. Such a high resolution enables us to disentangle seasonal variations in the rBC ice core signal. Ice core rBC concentrations in Greenland (McConnell et al., 2007) as well as atmospheric BC concentrations at the Zeppelin station (Eleftheriadis et al., 2009) show a clear seasonal cycle with higher BC values in winter–early spring due to the Arctic haze phenomenon (Shaw et al., 1995). However, despite a fine resolution and contrary to other parameters such as δ18O or Na+ concentration, a clear seasonality of rBC in the LF-09 core, i.e., with winter maxima (Arctic haze) and some summer peaks (biomass burning) (Hirdman et al., 2010a; Stohl, 2006) was not observed on a regular basis, probably due to summer snowmelt affecting the rBC signal (see Sect. 3.3).
The rBC concentrations in the LF-11 ice core are comparable to preindustrial values (before 1800) measured in the LF-09 ice core, with an average of 0.5±0.4 ng g−1, a median of 0.3 ng g−1, and a range from LOD to 2.4 ng g−1. This does not seem to be related to spatial variability as the two records show similar rBC concentrations in the overlapping year 2004 (Fig. 2b) but is related to an overall decreasing trend in BC emissions in the source regions. An analogous clear drop was also observed in the HDF EC concentrations (Ruppel et al., 2017) in a recent shallow core spanning 2005–2015 (Table 1) compared to the original HDF ice core covering 1700–2004 (Ruppel et al., 2014). The very low rBC concentrations in the LF-11 core compared to the EC concentrations around local sources of contamination in Svalbard such as settlements and mining activities with values higher than 1000 ng g−1 for some samples (Aamaas et al., 2011) underlines that rBC contribution from local anthropogenic sources to the LF drill site appears to be minimal, at least for the most recent years.
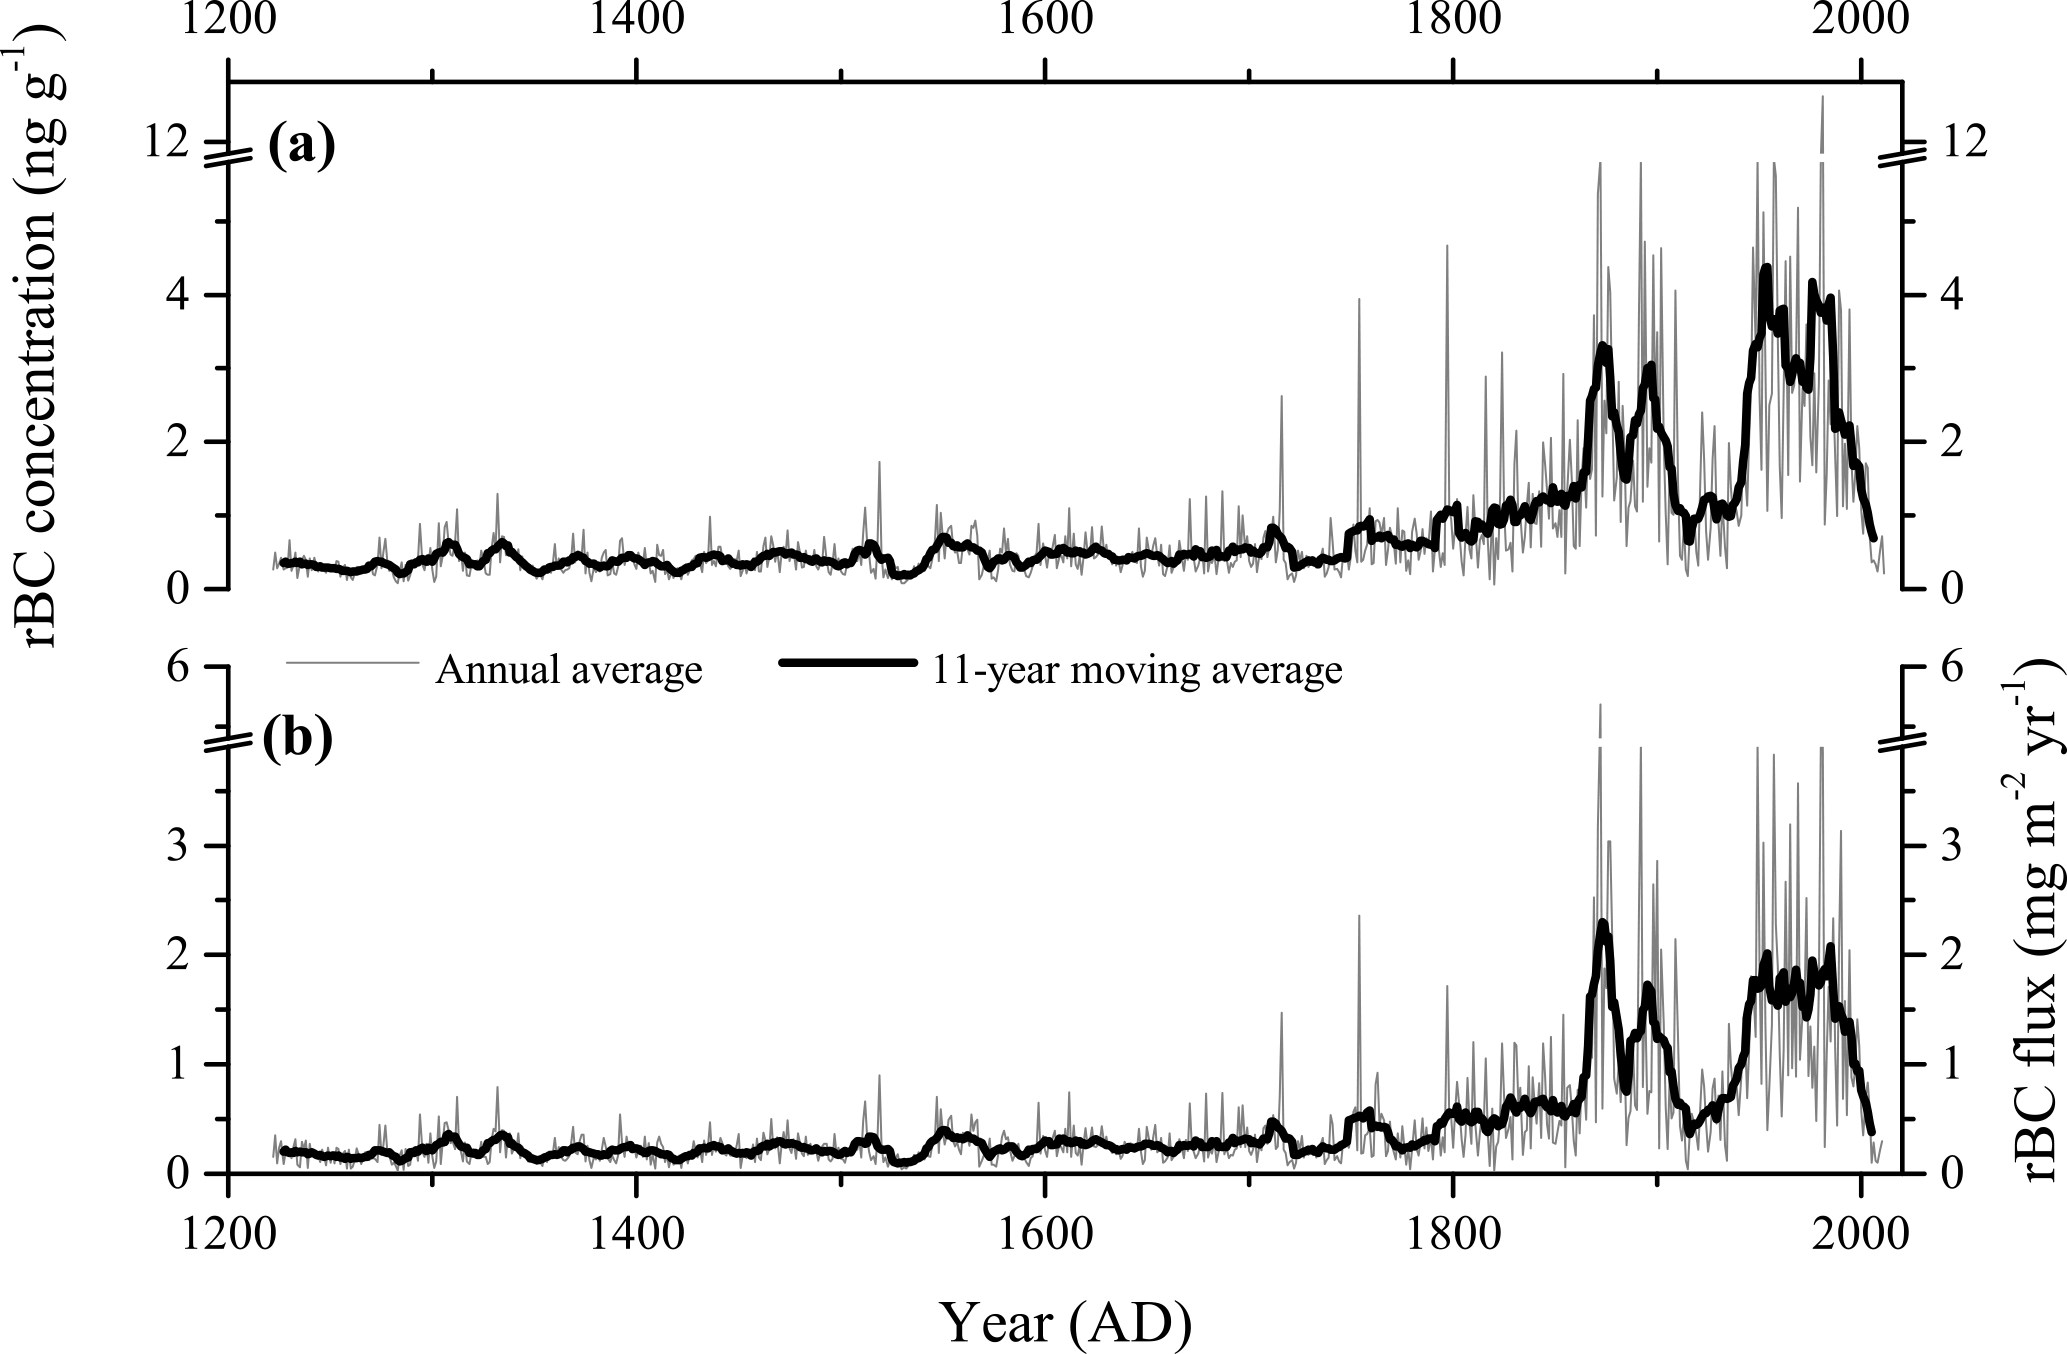
Figure 3The rBC long-term trends from the combined LF-09 and LF-11 cores, expressed as (a) rBC concentrations and (b) rBC fluxes.
LF rBC concentrations are very similar to those observed in Greenland and Canadian Arctic ice cores obtained by SP2 analyses (Keegan et al., 2014; McConnell et al., 2007; Sigl et al., 2013; Zdanowicz et al., 2017) (Table 1). However, EC concentrations in Svalbard snow (Aamaas et al., 2011; Doherty et al., 2010; Forsström et al., 2009, 2013) as well as in the HDF and Fiescherhorn ice cores (Jenk et al., 2006; Ruppel et al., 2014, 2017) are 1 order of magnitude higher than rBC concentrations in the topmost part of the LF core. This can be mainly explained by the different analytical methods employed, which do not measure the same fraction of the carbonaceous compounds, as discussed by Ruppel et al. (2014). Whereas the SP2 does not detect rBC particles larger than 500 nm, the optical and thermal-optical methods include a filtration step in which the smallest fraction of EC particles is generally lost. Lim et al. (2014) reported significant variations in the EC ∕ rBC ratios in snow and ice, ranging from 0.5 to 3.4 according to the sample origin. Furthermore, in the aforementioned studies, most of the EC snow samples from Svalbard were collected in winter–spring, when EC concentrations in fresh snow are higher due to the Arctic haze and have not yet experienced summer melting of the snowpack, contrary to the LF ice core samples.
3.2 Anthropogenic rBC signal in the Lomonosovfonna ice cores
3.2.1 rBC long-term trends
In Fig. 3a rBC annual averages and 11-year moving averages are presented to document long-term trends in the LF ice core record. The most striking feature is the increase in rBC concentrations and variability from 1800 on that we attribute to rising anthropogenic BC emissions. Before 1800, annual rBC concentrations were low, with an average of 0.4±0.3 ng g−1 for the time period 1222–1799. Only small decadal variations without a significant long-term trend were observed. We therefore consider the time period before 1800 to be representative of preindustrial atmospheric conditions. A few years displayed rBC peaks (see Sect. 3.4) probably originating from atmospheric deposition from biomass burning plumes reaching the Arctic, as McConnell et al. (2007) and Zennaro et al. (2014) described for Greenland, but annual rBC values did not exceed 4.7 ng g−1 (maximum in 1797). A clear minimum occurred between 1520 and 1540 with annual values lower than 0.2 ng g−1. The time period 1800–1859 showed a steady slow increase in the 11-year moving average, at an average rate of 0.009 ng g−1 yr−1, and a larger variability with an average of 1.0±0.7 ng g−1. From 1860 on rBC concentrations and variability dramatically increased, reaching two maxima around 1870 and 1895, before concentrations started declining. rBC averages were 2.3±1.7 ng g−1 for the period 1860–1909, which represents about a 6-fold increase compared to the pre-1800 concentrations. This period was then followed by low concentrations and reduced variability between 1910 and 1939, with an average of 1.0±0.3 ng g−1. Another strong increase occurred after 1940 and the highest long-term rBC concentrations of the record were reached in the 1950s and 1960s (average for the time period 1940–1969: 3.2±2.4 ng g−1). Concentrations started to decline in the 1970s. This downward trend was briefly interrupted by high concentrations registered for the years 1980–1981 and then resumed until the present time (average for the time period 1970–2010: 2.3±2.3 ng g−1).
To account for potential biases due to changes in accumulation rates, annual rBC fluxes were calculated by multiplying annual rBC concentrations by annual snow accumulation (Fig. 3b). Trends in the rBC flux and concentration records are almost the same (except that the highest fluxes were recorded in the 1870s), implying that accumulation has low variability and little impact on rBC long-term trends. Consequently, fluxes will not be considered in the remaining part of the study.

Figure 4(a) rBC, (b) nitrate, (c) non-sea-salt sulfate, and (d) ammonium records from 1800 on. The rBC record is combined for LF-09 and LF-11 spanning 1800–2010 while the other records only show LF-09 data spanning 1800–2009 (Wendl et al., 2015). Thin lines represent annual averages. Bold lines are 11-year moving averages and are associated with Pearson correlation coefficients (r values) between the respective ion records and the rBC record.
We attribute an anthropogenic origin to the higher rBC concentrations after 1860, supported by a significant correlation (at the 0.05 confidence level) between rBC and other proxies for anthropogenic emissions in the LF-09 core, namely (Fig. 4b), non-sea-salt (Fig. 4c), and, to a lesser extent, (Fig. 4d). Wendl et al. (2015) argued that the trends in and concentrations in the LF-09 core with a broad maximum between 1940 and 1980, followed by a significant decrease, indicate a strong anthropogenic influence during the 20th century related to NOx and NH3 emissions from sources located in Eurasia. Moreover, an increase in concentrations, already starting at the end of the 19th century and caused by anthropogenic fossil fuel emissions, was observed in all the ice cores recently drilled in Svalbard (Beaudon et al., 2013; Goto-Azuma and Koerner, 2001; Kekonen et al., 2005). Here we use non-sea-salt to remove the substantial contribution of sea salt (about 40 % in the LF-09 ice core) to the total sulfate budget. This is performed using the following equation (Wendl, 2014):
As seen in Fig. 4, the broad peak between 1940 and 1980, the decline in concentrations after 1980, and the low concentrations observed in the 1920s and 1930s are present for all the species. The double peak at the end of the 19th century is also visible, mainly for non-sea-salt , but to a much smaller extent compared to the high rBC concentrations at that time. We argue that this difference can be partially explained by invoking melting as those compounds exhibit different sensitivities to snowmelt and water percolation (see Sect. 3.3), and being the most mobile ions, whereas remains unaffected (Pohjola et al., 2002).
3.2.2 Source apportionment of the anthropogenic rBC
In order to interpret the anthropogenic rBC trend in the LF ice core and assess the source regions of anthropogenic rBC, we compare the LF record to other ice core rBC records and emission inventories. All rBC ice core records from Greenland show a similar broad concentration maximum (Fig. 5b to 5d) with values strongly increasing after 1880, peaking around 1910, followed by a clear decline close to preindustrial levels reached after the 1950s (Keegan et al., 2014; McConnell et al., 2007; Sigl et al., 2013). These records are widely interpreted as proxies for North American BC emissions and they closely follow the main trends in emission inventories for this region (Fig. 5g; Bond et al., 2007). Atmospheric back-trajectory studies corroborated that North America is the dominant source of BC deposited in Greenland (Shindell et al., 2008). For Svalbard, the rBC record is notably different with two maxima and contrasting timing. The rBC concentrations sharply increased already from 1860 onwards and peak values were also reached earlier, whereas they were low during times (1920–1940) when rBC concentrations in Greenland were strongly enhanced. The most striking difference is the second maximum observed after 1940 in the LF core, which does not appear in any ice core from Greenland. We argue that this discrepancy is in part related to different source areas of air masses reaching Svalbard and Greenland. Air mass back-trajectory analysis obtained with the Lagrangian HYSPLIT model showed that Siberia followed by northern Europe were the dominant source regions for the LF site, while North America was only occasionally the origin of air masses reaching the site (Grieman et al., 2018). Contributions from Siberia were higher in spring and fall, whereas European sources dominated in summer. Contrary to the HDF EC record (Fig. 5e; Ruppel et al., 2014), we do not observe any recent increase in rBC, which would support their hypotheses of increased BC scavenging efficiency due to higher air temperatures or stronger flaring emissions from Russia. On the contrary, rBC concentrations in the LF record started declining in the 1970s and further decreased from the end of the 1980s until rBC levels were comparable to preindustrial values. Compared to the highest 1950–1970 rBC concentration average of 3.3 ng g−1, the average decline over the time period 1970–2010 is 0.05 ng g−1 yr−1 (obtained by linear regression of the rBC annual averages from 1970 to 2010 without considering the exceptionally high values in 1980 and 1981), corresponding to a decrease of 1.5 % yr−1. This is in agreement with the decreasing trend in atmospheric rBC burden observed everywhere in the Arctic over the last decades. Eleftheriadis et al. (2009) noted a BC decrease of 9.5 ng m−3 per decade at Zeppelin station, while Sharma et al. (2004) observed a 55 % BC decrease in Alert (Fig. 1b) between 1989 and 2002, mainly attributed to a dramatic drop in BC emissions after the USSR dissolved. A longer BC time series from Kevo, Finland, confirmed this declining rate, with a decrease of 1.8 % yr−1 for the period 1970–2010 (Dutkiewicz et al., 2014), similar to our results. The authors mostly attributed this decrease to emission reductions and noted a poor correlation between BC concentrations and emissions inventories. Despite their common Svalbard origin, similarities between the HDF and LF records are not obvious. The LF and HDF records are less dissimilar than the LF and Greenland records as they do not show a uniform decline since the 1910s maximum but a second increase from the 1930s to 1960s in HDF and 1940s to 1970s in LF. The differences between both records might arise from the different analytical methods employed to quantify BC and from local differences in transport, deposition, and melting effects. Beaudon et al. (2013) showed that the HDF ice core was more affected by melting, with outstanding melting features after 1970, than the LF ice core during the 20th century. In addition, the LF site is more frequently located above the thermal inversion layer in winter, in contrast to the HDF site, thus being more exposed to long-range pollution from the free troposphere (Beaudon et al., 2013).
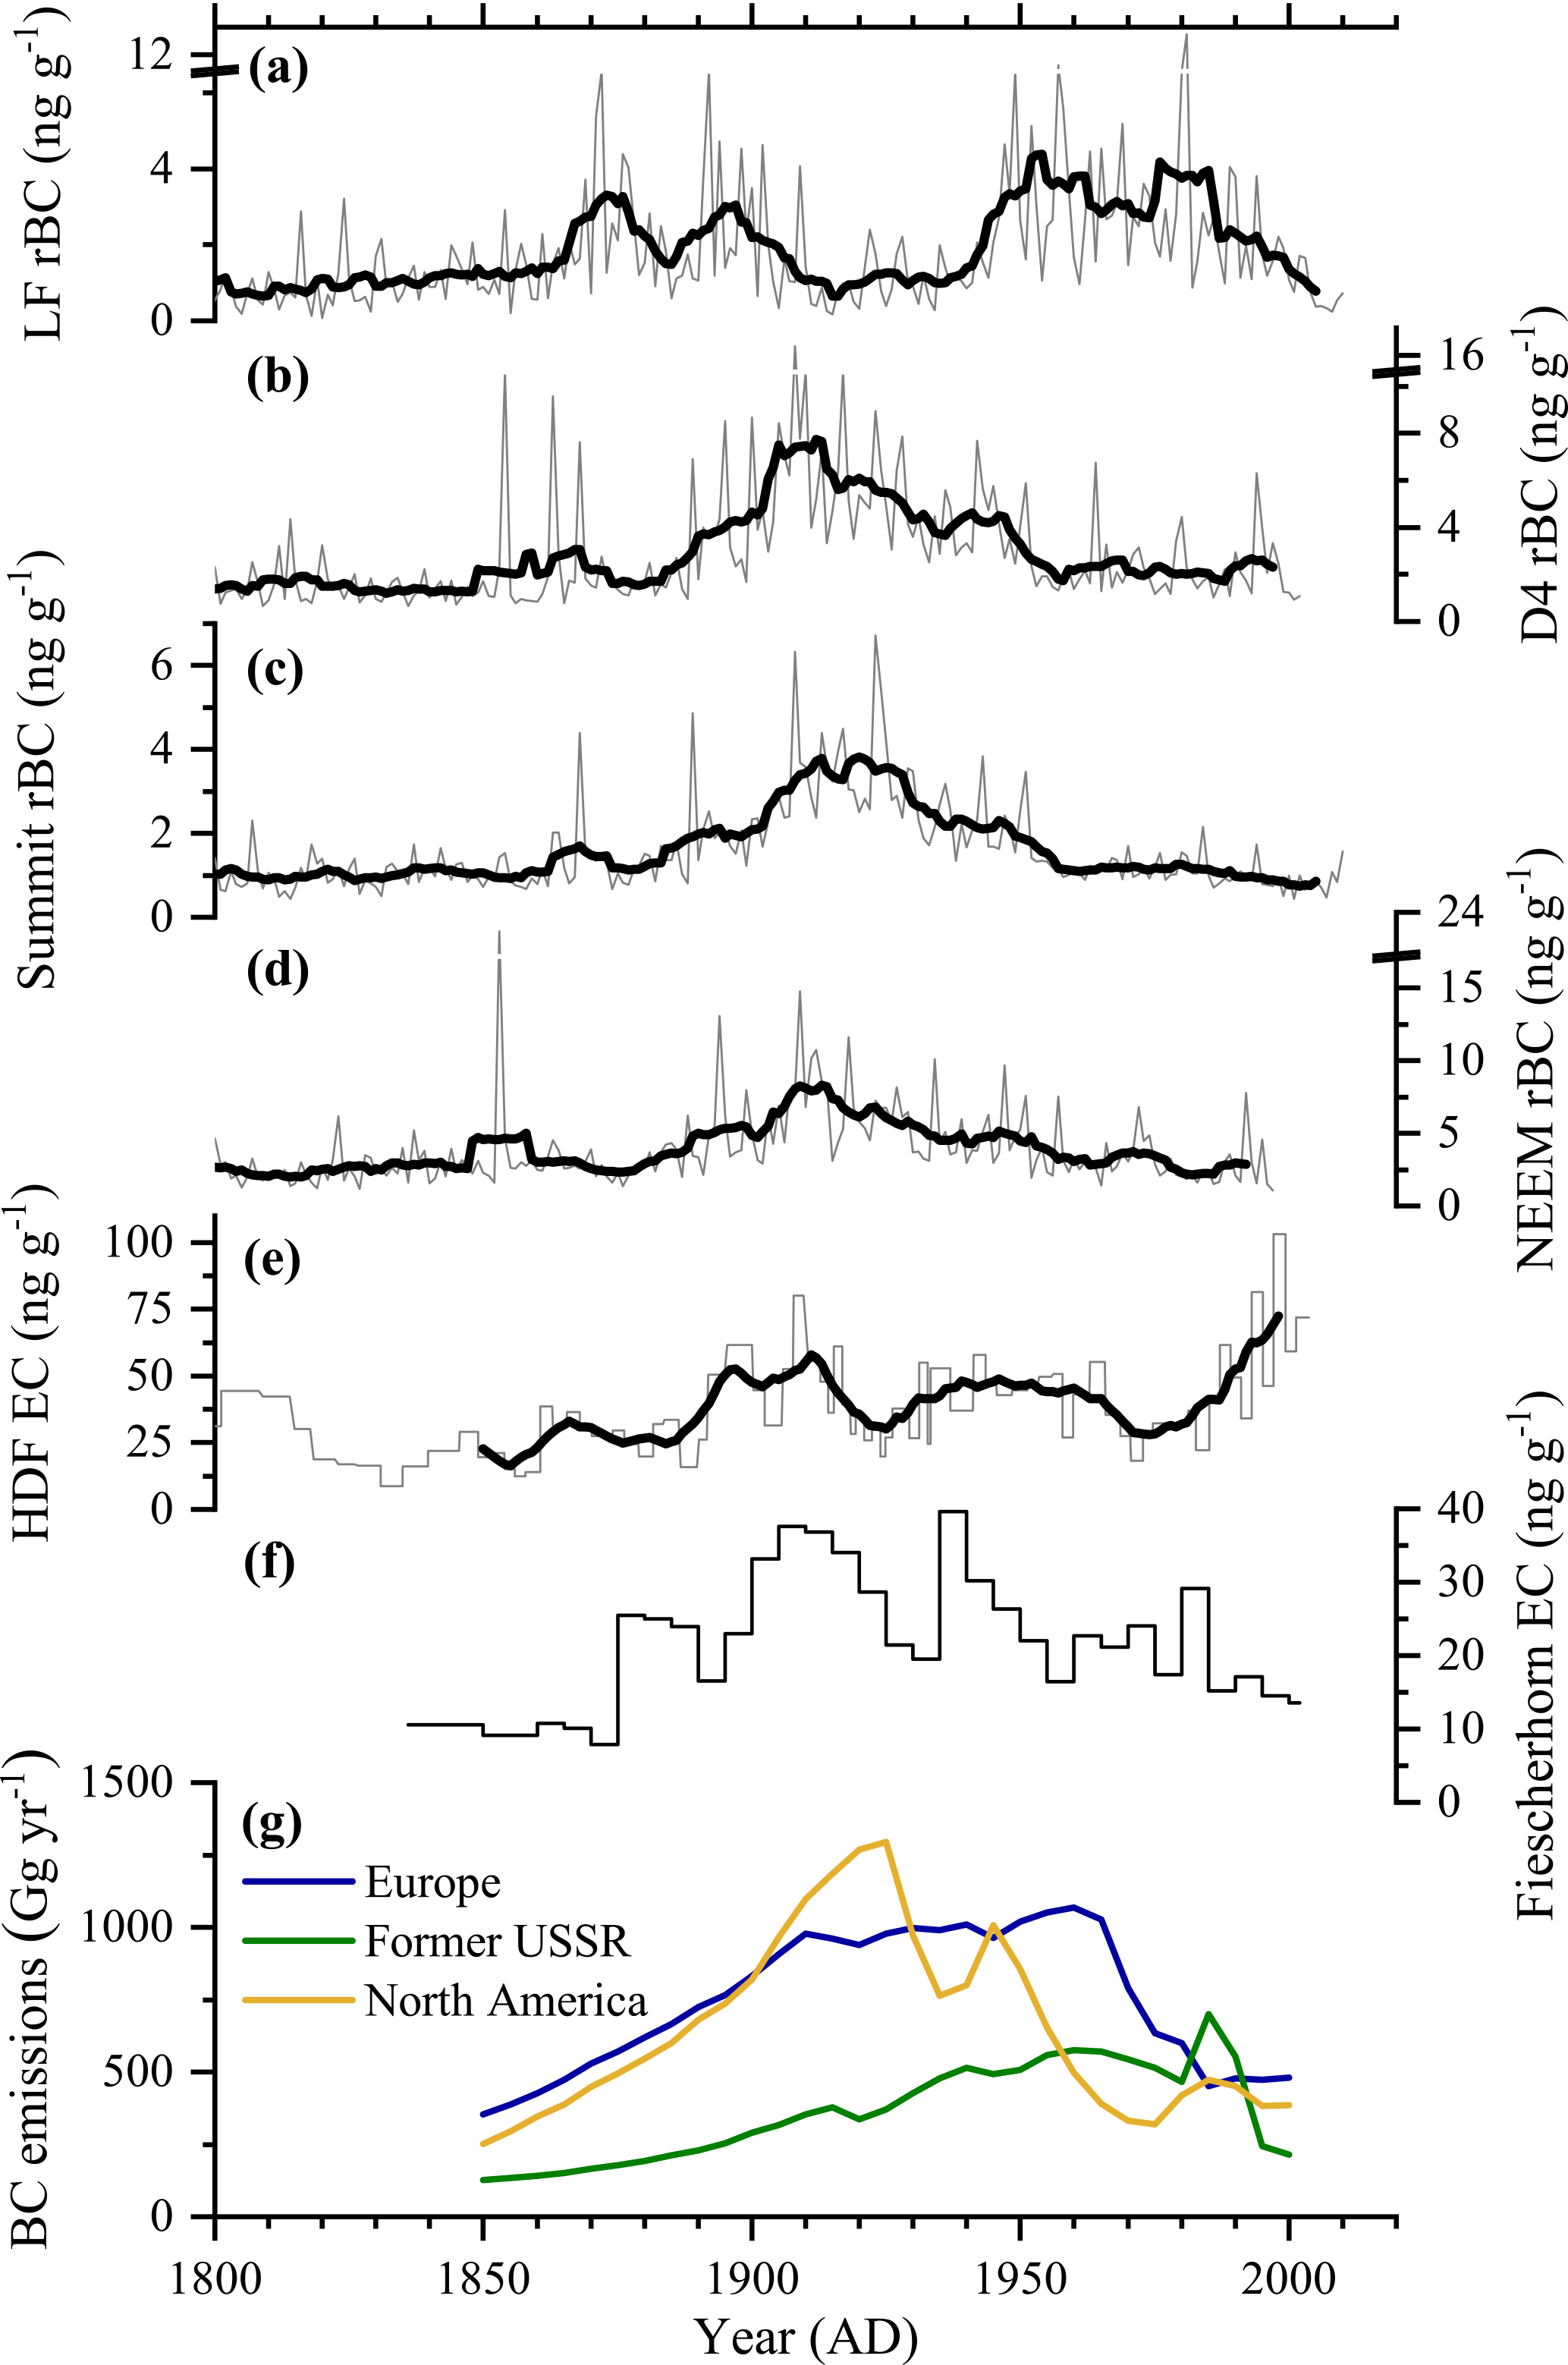
Figure 5Comparison of (a) Lomonosovfonna rBC concentrations to other ice core records from 1800 on, namely rBC from (b) D4, Greenland (McConnell et al., 2007), (c) Summit 2010, Greenland (Keegan et al., 2014), and (d) NEEM 2011-S1 (Sigl et al., 2013), Greenland; (e) EC from Holtedahlfonna, Svalbard (Ruppel et al., 2014), and (f) Fiescherhorn, Swiss Alps (Gabbi et al., 2015; Jenk et al., 2006); and (g) BC emission inventories (5-year averages) for Europe, North America, and the former USSR (Bond et al., 2007). Europe represents the sum of OECD Europe and eastern Europe and North America the sum of Canada and the USA. Thin lines represent annual averages except for Holtedahlfonna (raw data) and Fiescherhorn (5-year averages) due to lower resolution. Bold lines are 11-year moving averages (in the case of Holtedahlfonna, they are calculated from a 2-year resolution approximately). Note the different y axis scales.
We therefore postulate that a clear anthropogenic signal is present in the LF record from 1860 on (Fig. 5a) due to the start of the Industrial Revolution in Europe. This period of extensive coal burning would be responsible for the double peak observed at the end of the 19th century in the rBC record. The second peak period starting around 1940 would reflect the Eurasian economic growth after World War II and the extensive use of coal and oil for industry, transport, and energy production. The decline starting in the 1970s is consistent with emission inventories showing decreasing BC emissions for Europe due to the implementation of cleaner technologies and stricter environmental policies, and, from the 1990s on, for the former Soviet Union due to the collapse of the USSR and the subsequent economic crisis. However, some features of the LF rBC record remain unexpected. First, the sharp increase around 1860 is surprising since a smoother trend is observed at other Arctic sites (e.g., Greenland, HDF) in emission inventories and also in other anthropogenic proxies such as sulfate and nitrate from Arctic ice cores. The increase in rBC also occurs slightly earlier than in Greenland ice cores (1880s, Fig. 5b to d; Keegan et al., 2014; McConnell et al., 2007; Sigl et al., 2013) and an ice core from the Swiss Alps (1870s, Fig. 5f; Jenk et al., 2006). This earlier increase in rBC concentrations observed in the LF record supports our hypothesis that European BC emissions, probably from the early industrialized British Empire, might have dominated the LF-09 rBC record at that time. Indeed, the Industrial Revolution began in the second half of the 18th century in England (Deane, 1965) and spread to western Europe by 1850 (Spielvogel, 2010). In the LF core, the first increase in rBC background concentrations appeared around 1800. In the HDF ice core, stronger acidity from 1850 on was attributed to the Industrial Revolution (Beaudon et al., 2013). Local sources of contamination from coal mining in Svalbard can be excluded because the first industrial mines did not open until around 1900 (Catford, 2002; Hisdal, 1998). Second, our record displays two local minima around 1885 and between 1910 and 1940, which cannot be explained only by lower emissions as reflected by emission inventories (Bond et al., 2007). The economic crisis in the 1920s and 1930s might have contributed to these lower values, as also seen in the Fiescherhorn ice core, but it is unlikely to cause such a long and clear drop in rBC concentrations, as it started earlier and showed low rBC values similar to early 19th century levels. In addition, to our knowledge, no anthropogenic cause can explain the 1885 concentration drop. Interestingly, lower values are also found in the HDF EC record in the 1880s and 1920s, but the minima are less noticeable (Ruppel et al., 2014). As discussed in the next section, we suggest that post-depositional effects induced by summer melting are mostly responsible for these features.
3.3 Influence of snow melting during the 20th century
Up to now, it remains unclear what happens to BC when melting occurs at the surface of the snowpack. BC can be enriched at the surface due to its low solubility in water or it can be eluted with the meltwater and percolate downward through the snowpack. When the water refreezes further down, forming an ice lens, BC is trapped. If melting is considerable, runoff can occur, leading to a net loss of BC. Doherty and al. (2013) showed that BC particles tend to be retained at the snow surface when melting occurs and that only 10–30 % of the BC is eluted with meltwater through the snowpack. However, Xu et al. (2012) observed that BC concentrations were higher not only at the surface but also in firn, at the bottom part of the snowpack, due to BC percolation and enrichment on top of superimposed ice, hindering further penetration of meltwater, while the intermediate snowpack zone was depleted in BC. Moreover, fresh snow displayed higher BC concentrations compared to snow experiencing summer melting. If BC concentrations are high, percolation can even be the dominant process (Conway et al., 1996).
In Fig. 6 a qualitative assessment of the melting impact on the LF-09 record is made. Quantitative values cannot be obtained, especially as runoff might have occurred. In addition to the annual melt percent (Fig. 6b) calculated by Wendl et al. (2015), we use the melt index (Fig. 6c) defined as by Iizuka et al. (2002) to quantify the impact of summer melting in Svalbard as sodium and magnesium have different washout efficiencies (Beaudon et al., 2013; Grinsted et al., 2006), a higher value being indicative of a stronger melting. The highest values for both the annual melt percent and melt index are found in the 20th century, in agreement with temperature reconstructions from the Arctic (McKay et al., 2014) and the water stable isotope records from both LF-09 (Wendl, 2014) and LF-97 cores (Divine et al., 2011) showing a slight downward trend until the second half of the 19th century followed by an abrupt rise in the 20th century. Prior to 1850, colder temperatures, a lower melt index (average 1222–1850: 0.64) and melt percent (average 1222–1850: 28 %), and simultaneous peak occurrence for species with different sensitivity to elution (e.g., and rBC) all suggest a reduced impact of melting and a better preservation of the original concentration.
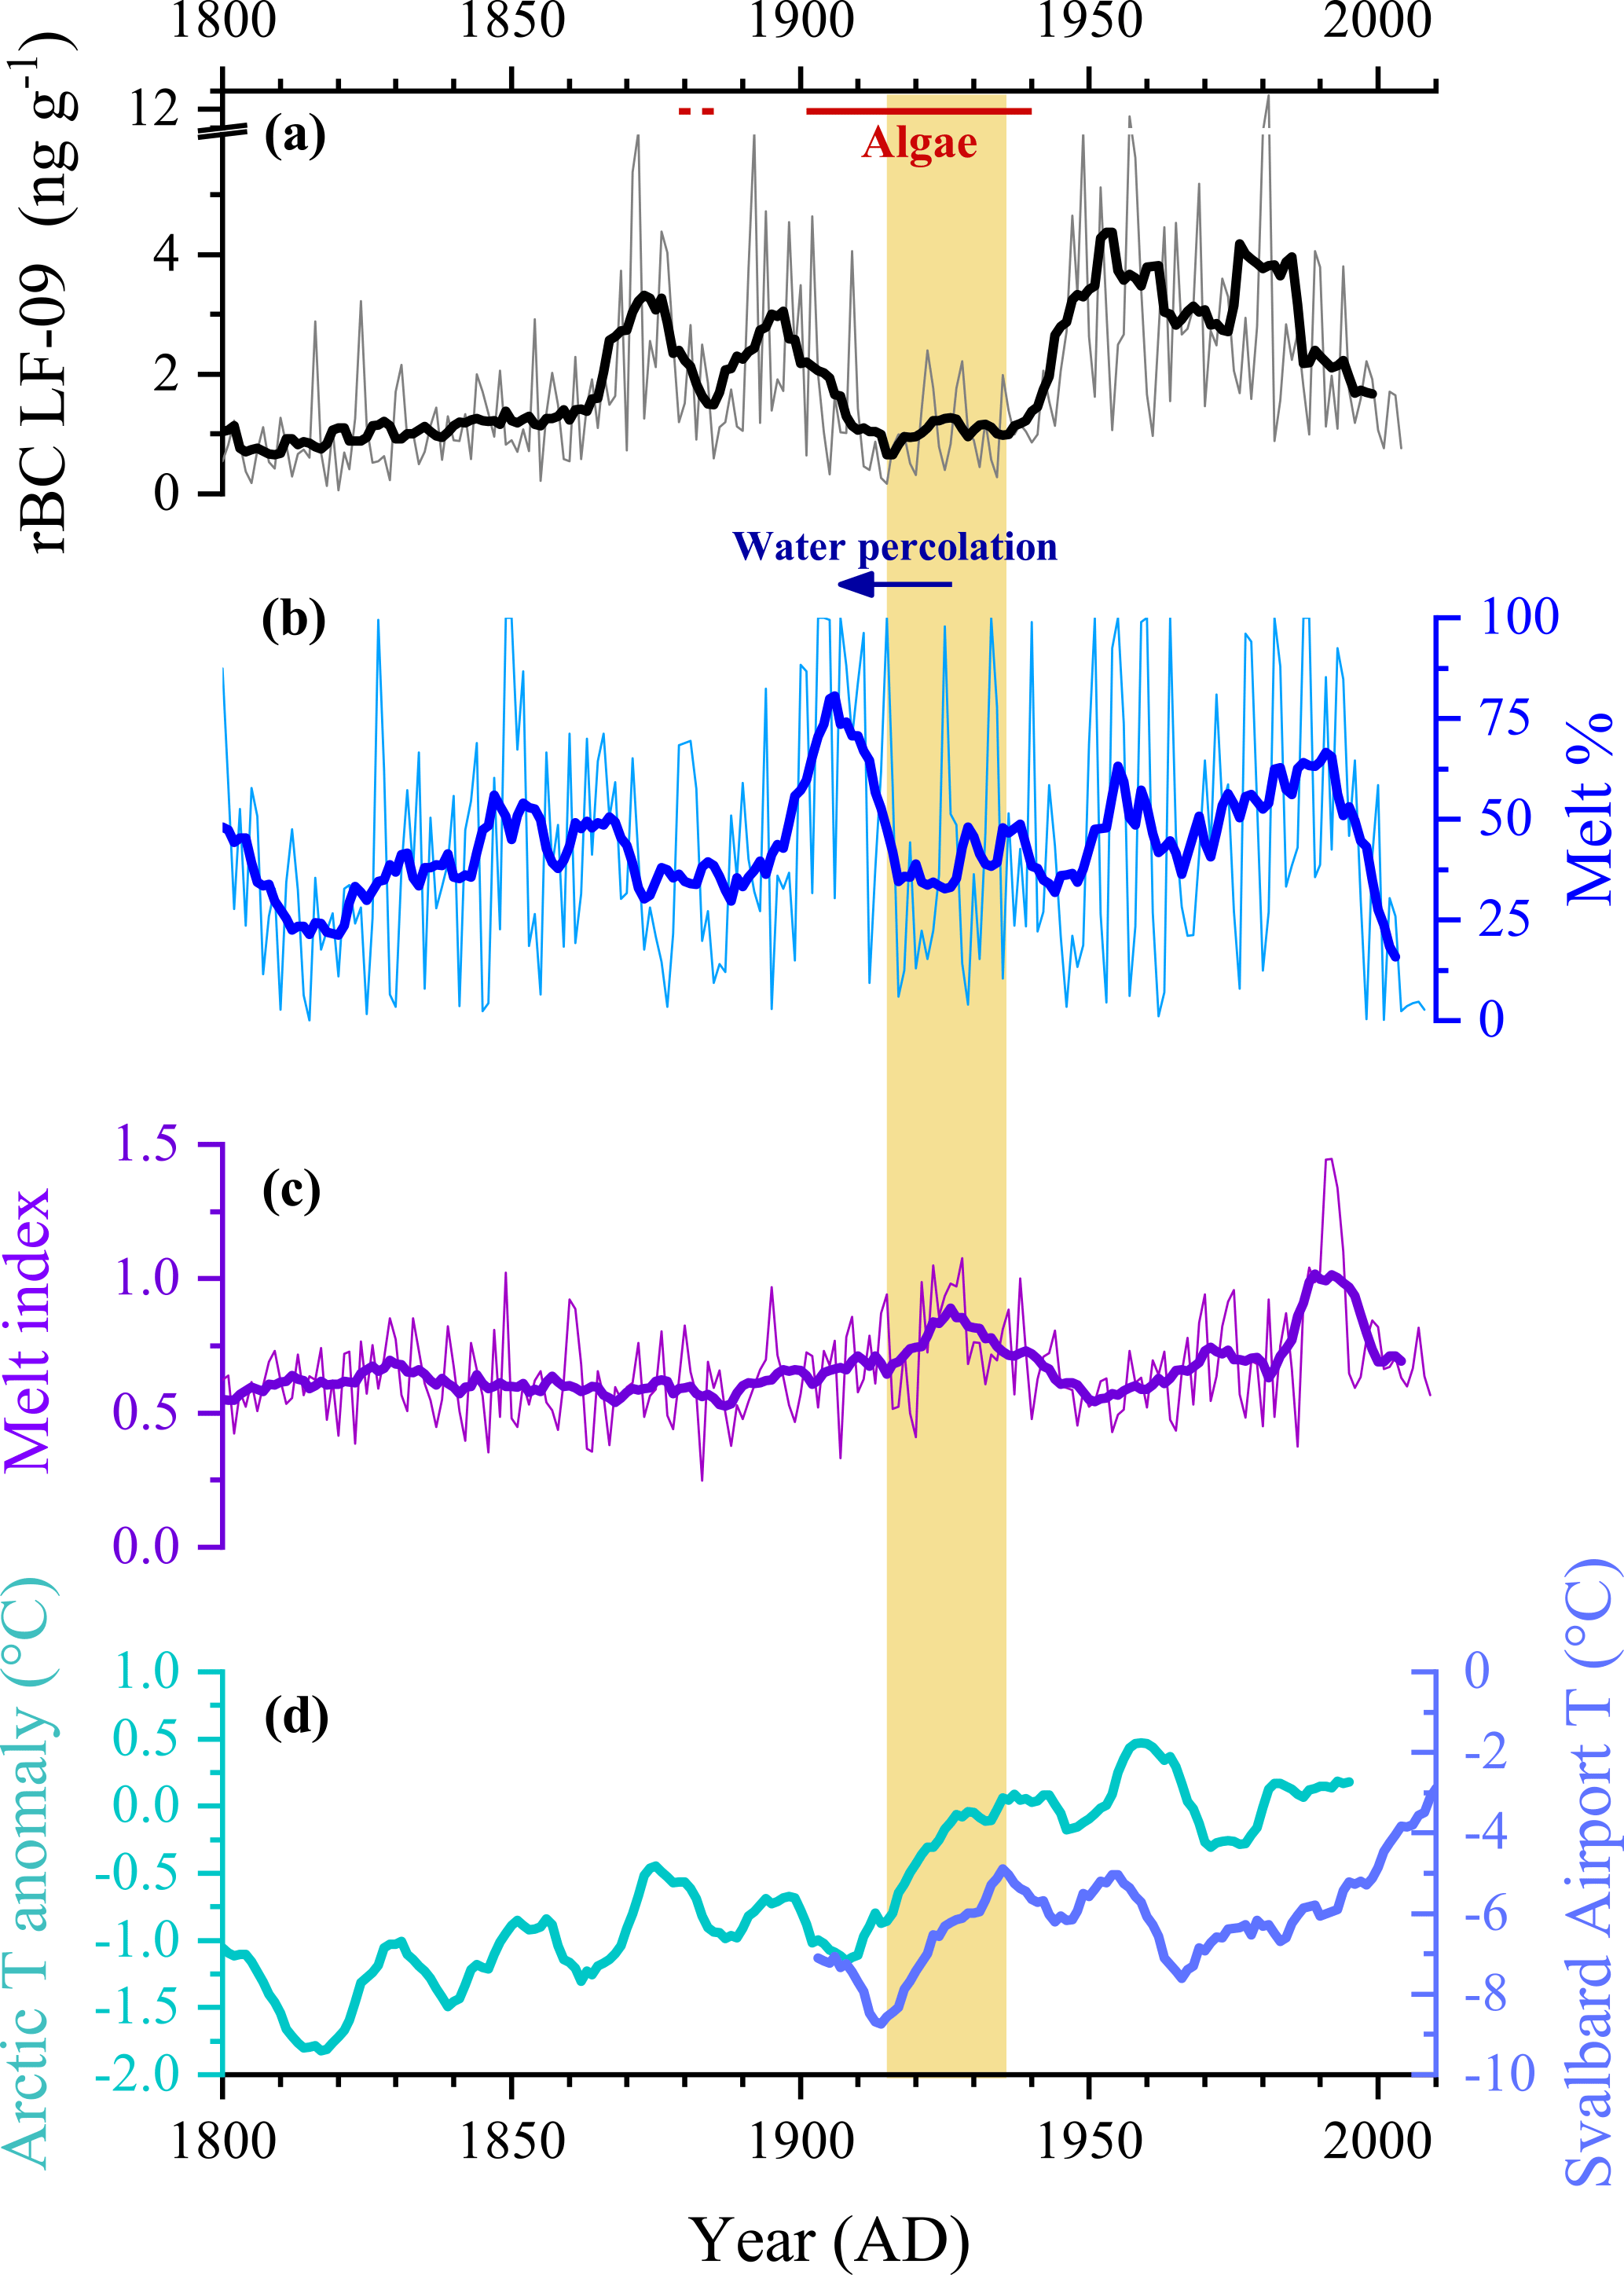
Figure 6Influence of melting on the LF-09 rBC record since 1800. Comparison of (a) LF-09 rBC concentrations with (b) LF-09 melt percent (Wendl et al., 2015), (c) LF-09 melt index calculated as , (d) temperature anomalies from the whole Arctic (McKay et al., 2014), and the temperature record from Svalbard Airport, Longyearbyen (Nordli et al., 2014). Thin lines are annual averages and bold lines 11-year moving averages. The yellow bar represents the time period of the early 20th century Arctic warming responsible for enhanced melting in the LF-09 ice core. Time periods with algae, either in the LF-97 (Hicks and Isaksson, 2006) or LF-09 records, are represented by a red line.
The melt index shows two periods of enhanced melting in the LF-09 ice core, from the 1910s to 1930s and in the 1980s–1990s. The first one is associated with the well-known early 20th century pan-Arctic warming (Bengtsson et al., 2004), also clearly visible in the temperature series from Svalbard Airport in Longyearbyen (Fig. 6d, Nordli et al., 2014), while the second one is explained by the current global warming trend (AMAP, 2011b; IPCC, 2013). The existence of local algae in the LF-97 core only between 1900 and 1940 (Hicks and Isaksson, 2006) underlines the fact that wet surface snow was present at that time at the drill site, another clear indication of summer melting. In contrast, the annual melt percent displays the highest values around 1905 and some local maxima around 1955 and in the 1980s. Our hypothesis is that the strong 1920s melting peak was responsible for extensive water percolation through the snowpack, leading to the formation of ice lenses and producing the melt percent peak around 1905. This would correspond to a percolation length of over 15 years, which strongly exceeds the up to 8 years postulated by Kekonen et al. (2005). A nonnegligible fraction of the rBC particles might have been eluted with the meltwater. Another substantial fraction might have been lost by runoff, which could explain the rBC minima from the 1910s to 1930s. Regarding the melt index peak in the 1980s and 1990s, as no clear increase can be seen in the annual melt percent record in the previous years, percolation must have been overwhelmed by surface runoff responsible for rBC losses. The dramatic decline of the melt percent since the 1990s also confirms the dominant contribution from runoff over percolation due to increasingly warm temperatures. Kekonen et al. (2005) also noted ion losses due to runoff since the 1990s in the LF-97 ice core. Nevertheless, we suggest that the decreasing trend in rBC since the 1970s is not only an artefact due to melting issues but is primarily driven by reductions in source emissions as confirmed by atmospheric measurements throughout the Arctic.
The case of the 1885 rBC minimum is more puzzling as there is no evidence of strong melting either in the melt index or in the annual melt percent record, which could indicate that losses happened only by runoff. Melting occurrence is supported by red layers typical of algae growing only in the presence of liquid water in LF-09 ice core sections around 1879–1881 and 1883–1885. Interestingly, Keegan et al. (2014) described a widespread melting event in Greenland associated with a prominent ice layer corresponding to the year 1889, which would lie within our dating uncertainties.
Furthermore, we cannot fully exclude that the apparent loss of rBC due to melting is an artefact of the SP2 analytical method. Losses of rBC from samples which were melted and refrozen in laboratory tests can reach 45±11 % (Lim et al., 2014) or even up to 60 % for a single thaw–freeze–thaw cycle prior to analyses (Wendl et al., 2014). One possible explanation is the agglomeration of rBC particles to larger sizes during the refreezing process, beyond the SP2 detection range (Wendl et al., 2014). It is unclear if such processes similarly occur during melting and refreezing of a snowpack, which would make the use of SP2-based methods less suited for ice cores experiencing strong summer melting.
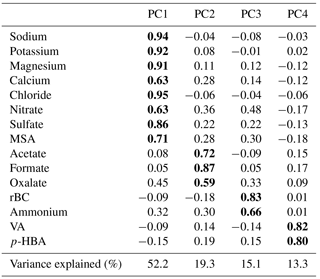
Table 2Results of the principal component analysis (PCA) for the LF-09 preindustrial record (1222–1859) after VARIMAX rotation. Data are log-transformed annual averages. Values above 0.5 are in bold. MSA: methanesulfonate ().
3.4 Paleofire reconstruction
Even if the impact of summer melting and anthropogenic emissions hampered the use of rBC as a biomass burning proxy since the beginning of the Industrial Revolution, it is still possible to reconstruct past biomass burning trends in the preindustrial times (before 1800). This part of the record has a limited melting effect due to low air temperatures and presumably no anthropogenic input. In this period every rBC peak is assumed to correspond to a biomass burning episode whose emissions were transported to and deposited at the drilling site. Natural rBC emissions (wildfires) may also have contributed to the rBC record since the beginning of the Industrial Revolution but their signature is largely masked by the anthropogenic signal. For instance, the highest rBC concentrations of the record in 1980 and 1981 could be linked with strong biomass burning seasons in Canada (4.8 and 6.1 Mha, respectively; Stocks et al., 2003) potentially related to the ammonium spikes noted in Greenland ice cores (Legrand et al., 2016). The clear rBC peak visible in the LF record in summer 1994 could reflect the high fire activity in Canada for the year 1994, when 6.1 Mha burned (Stocks et al., 2003). Dibb et al. (1996) documented the advection of a biomass burning plume from the Hudson Bay lowlands, Canada, to Greenland on 5 August 1994, suggested to be responsible for an increase in , K+, and light carboxylic acid concentrations in the snowpack. Although northern Eurasia is assumed to be the main source of rBC in the LF record, those events reveal that advection of forest fire plumes from North America could possibly reach Svalbard under favorable conditions.
To identify common variability among the chemical species in the LF ice core and isolate biomass burning proxies, we performed a principal component analysis (PCA) (Table 2). We used normalized annual averages and restricted our analysis to the preindustrial period (1222–1859) as many compounds (e.g., sulfate, rBC, ammonium, and nitrate) are influenced by anthropogenic activities. Four principal components (PCs) were retrieved. PC1 has high loadings of sodium, magnesium, potassium, calcium, nitrate, sulfate, chloride, and methanesulfonate, representing 52 % of the total variance and can be explained by mineral dust and marine sources (Wendl et al., 2015). PC2 isolates light carboxylic acids (formate, acetate, and oxalate), accounting for 19 % of the total variance. These compounds are well-known proxies for biomass burning in Greenland ice cores, especially formate (Legrand and De Angelis, 1996; Legrand et al., 2016). PC3 contains high loadings of rBC and ammonium, contributing to 15 % of the total variance and forming another group of biomass burning proxies. It is interesting to note that the preindustrial LF rBC record shows the highest correlation coefficient with ammonium independent of the resolution (significant at the 0.01 level). Most of the rBC peaks correspond to ammonium peaks (see below), reflecting a similar sensitivity to biomass burning emissions, transport, and deposition. We therefore suggest that ammonium is not only a proxy for Eurasian biogenic emissions as stated by Wendl et al. (2015) but also reflects a contribution from biomass burning, with biogenic emissions driving background variations while sharp peak events are associated with forest fires. Lastly, PC4 shows high loadings of specific organic markers of biomass burning (VA and p-HBA) and explains around 13 % of the total variance. The fact that biomass burning proxies are split into three different groups highlights their different behaviors towards the processes driving biomass burning emissions, transport, and deposition to and conservation within the snowpack, thus advocating for a multi-proxy reconstruction. These discrepancies can arise from the nature of the fire event (flaming or smoldering), the kind of vegetation burnt (grass, conifers, deciduous trees), or the sensitivity towards water percolation induced by summer melting. For instance, BC is preferentially emitted by flaming fires whereas smoldering fires are dominant in boreal regions (Legrand et al., 2016). VA is mainly produced by incomplete combustion of conifers while p-HBA is dominant for grass burning (Simoneit, 2002). Contrary to the other proxies used in this study, secondary production of formate from formaldehyde and numerous volatile organic compounds including alkenes is possible when the fire plume ages (see Fig. 1 in the review from Legrand et al., 2016). Formate, like other light carboxylic acids, can also undergo post-depositional effects such as revolatilization and diffusion in the snowpack (De Angelis and Legrand, 1995). Ammonium is almost not affected by summer melting and remains well preserved in the snowpack (Pohjola et al., 2002) while VA and p-HBA have been shown to be fully eluted by meltwater in an ice core from the Swiss Alps (Müller-Tautges et al., 2016).
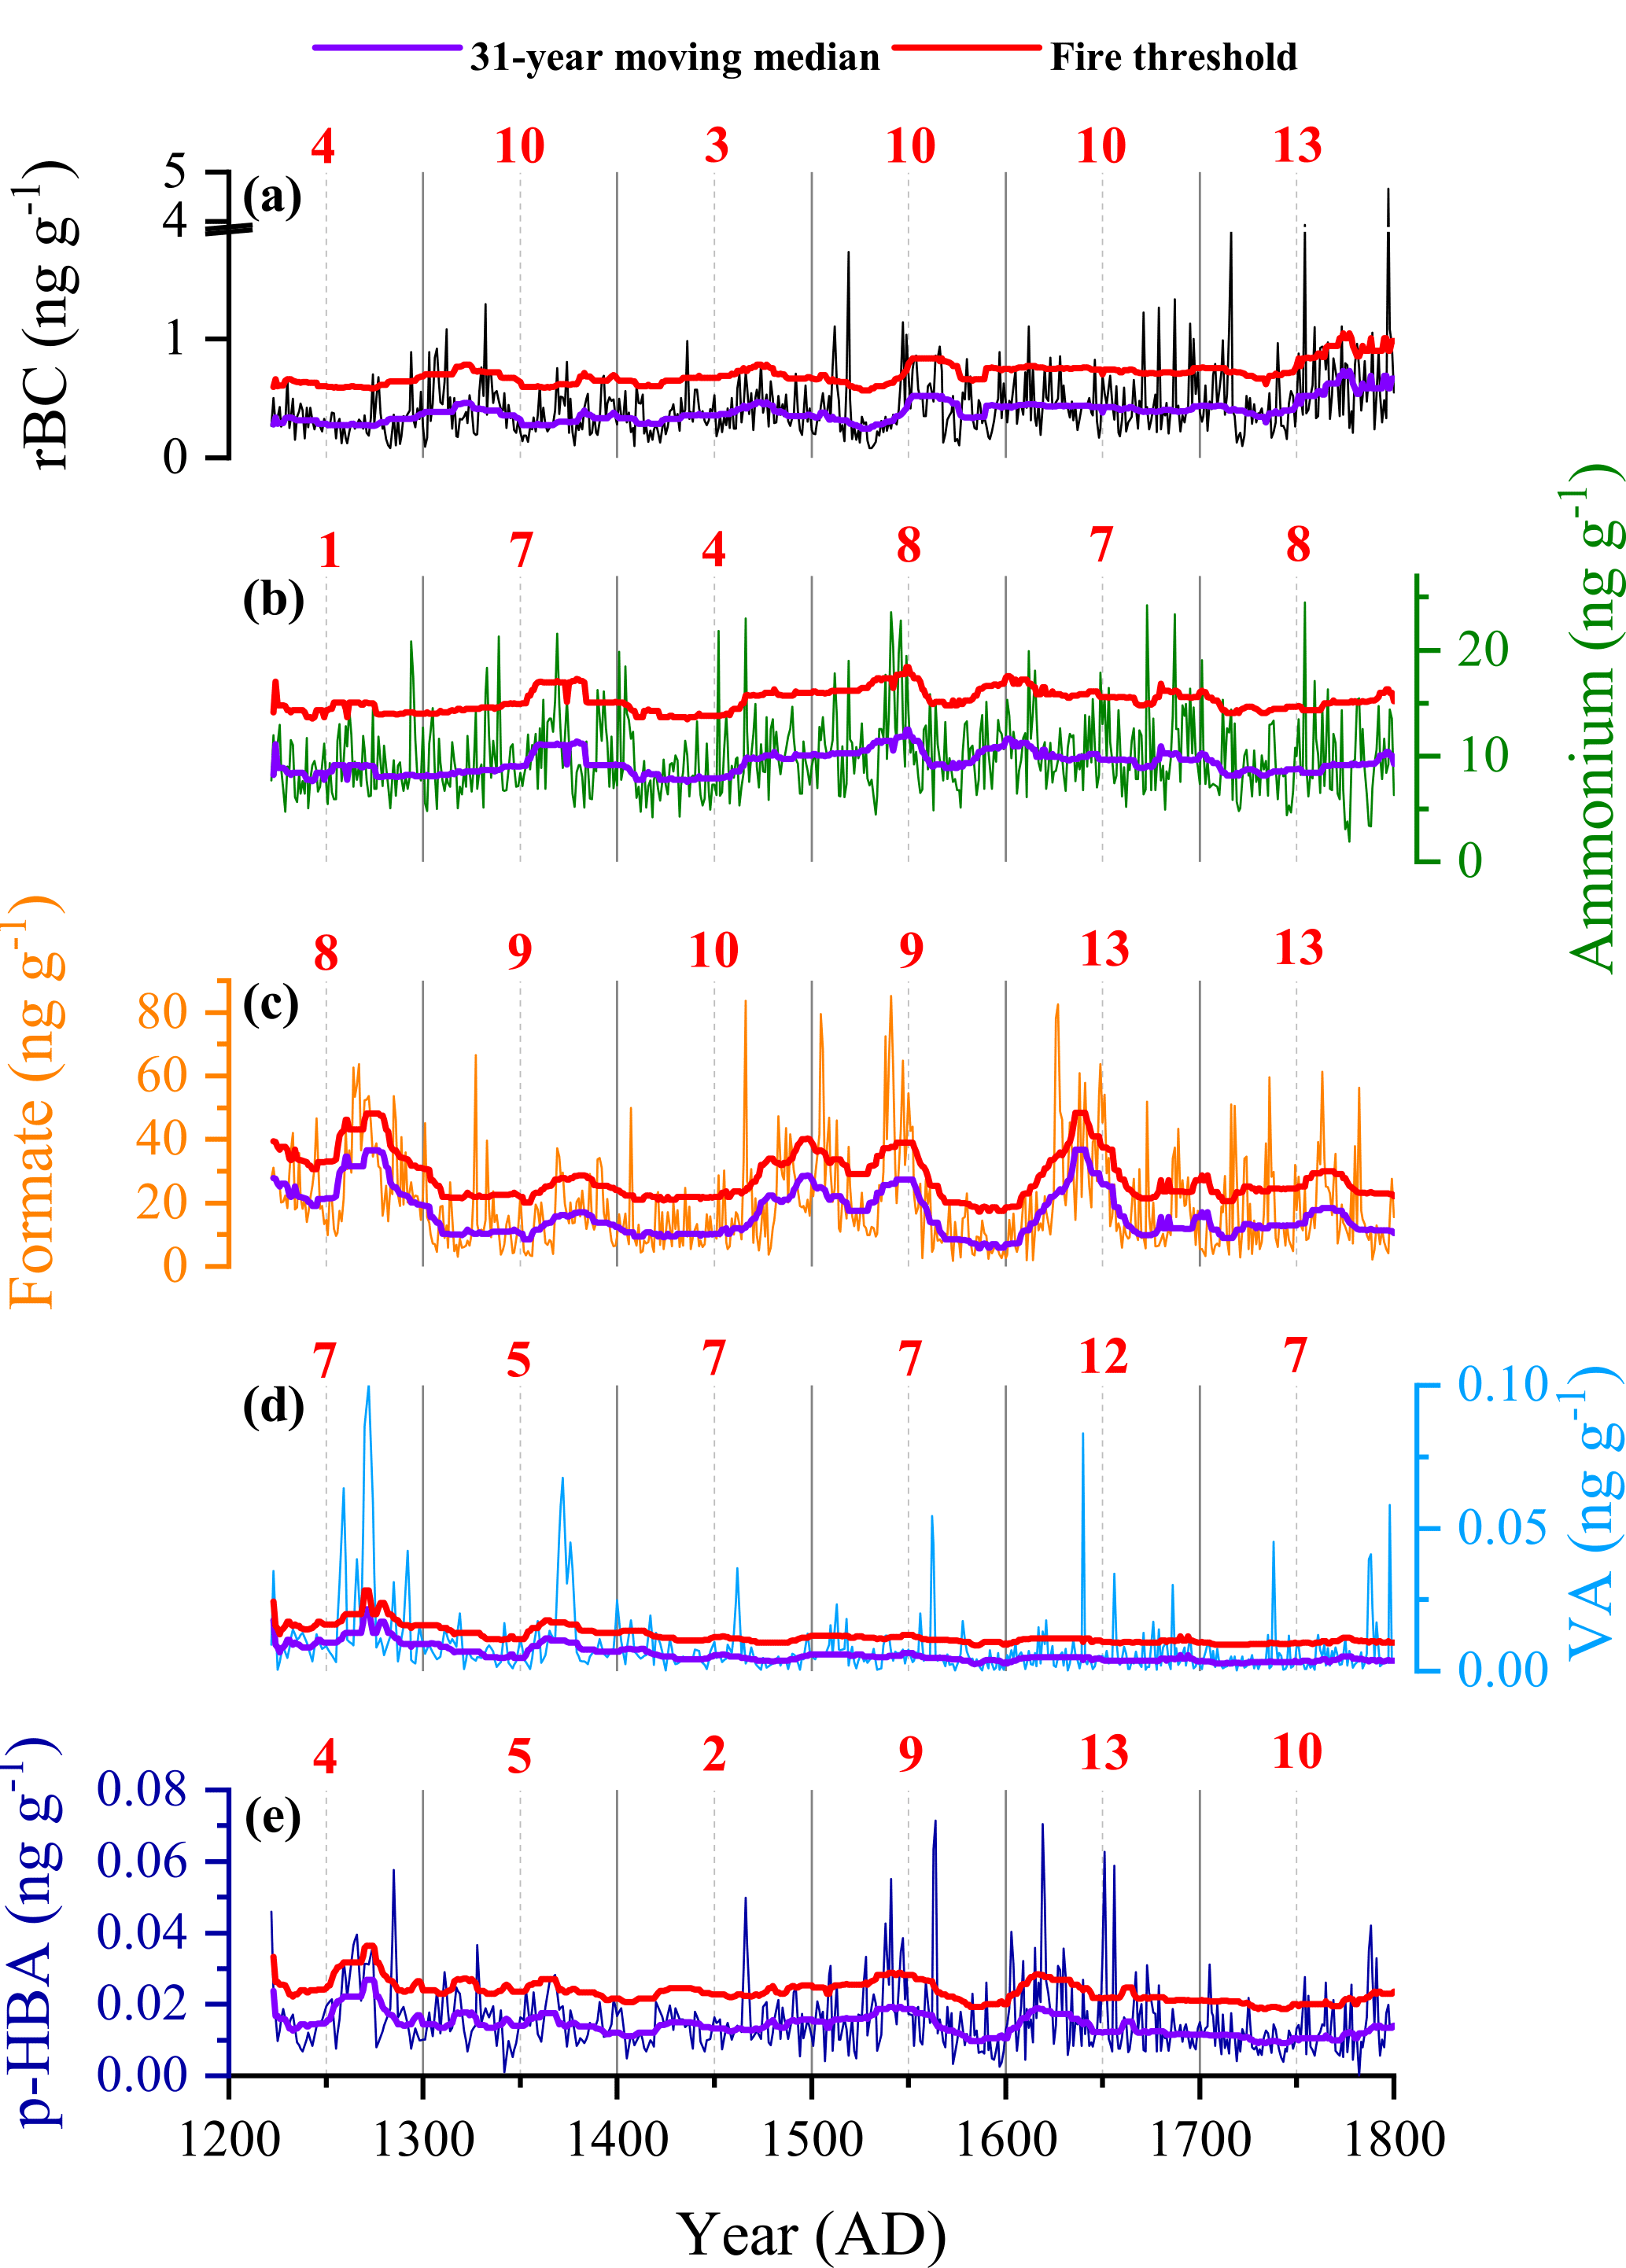
Figure 7Paleofire trends in the LF-09 ice core using (a) rBC, (b) ammonium, (c) formate, (d) vanillic acid (VA), and (e) p-hydroxybenzoic acid (p-HBA) along with 31-year moving medians and the associated fire threshold. Thin lines are annual averages. Red numbers above the respective plots represent the number of years above the fire threshold per century, corrected for neighboring outliers. Ammonium and formate data are from Wendl et al. (2015) while VA and p-HBA data are from Grieman et al. (2018).
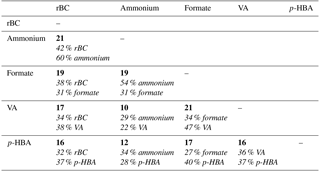
Table 3Number of peaks matching within ±1 year among the different fire proxies (in bold) for the time period 1222–1800. Italic numbers below give the percentage of matching peaks in relation to the total number of peaks for each proxy.
These discrepancies are also reflected in the diverging long-term trends. rBC (Fig. 7a) and ammonium (Fig. 7b) display a relatively flat background over the preindustrial time period, meaning that they do not indicate any significant change in biogenic emissions and biomass burning. Only slight increases in background concentrations are visible around 1370 and 1545 for ammonium and around 1290–1340, 1470, 1545–1565, and after 1750 (possibly already influenced by anthropogenic emissions) for rBC. Conversely, formate, VA, and p-HBA (Fig. 7c to e) show more pronounced long-term variations. Elevated VA concentrations before 1400 (especially around 1250–1280 and 1360–1390) and three multi-decadal peaks in p-HBA around 1250–1280, 1520–1570, and 1610–1640 were attributed by Grieman et al. (2018) to North Atlantic Oscillation (NAO) changes, a positive mode implying a decrease in precipitation over Europe and central Asia believed responsible for enhanced biomass burning. The LF formate record displays the closest similarities with the p-HBA record. Three multi-decadal periods of elevated concentrations are also visible around 1260–1280, 1480–1560, and 1620–1650, superimposed on a general decreasing trend in background concentrations throughout the Little Ice Age, as observed for the VA and p-HBA (Grieman et al., 2018), coinciding with a decrease in temperature deduced from the LF δ18O record until 1880 (Divine et al., 2011). The timing of elevated background concentrations is in agreement with other ice-core-based studies of biomass burning from Siberia (Eichler et al., 2011; Grieman et al., 2017), thus supporting the attribution of northern Eurasia as a major source region for the LF site. Eichler et al. (2011) found prominent peaks in nitrate, potassium, and charcoal in the Belukha ice core, Siberian Altai, between 1600 and 1680 induced by the strongest regional forest fire episodes of the last 750 years following extremely dry conditions in central Asia around 1540–1600 responsible for dry dead wood accumulation. In the Akademii Nauk ice core, Siberian Arctic, Grieman et al. (2017) reported higher concentrations of VA and p-HBA for the time periods 1460–1660 and 1460–1540, respectively. Conversely, paleofire trends from the LF core notably differ from Greenland paleofire reconstructions that record low fire activity between 1600 and 1800 (Legrand et al., 2016).
The frequency counting of forest fire episodes enables to focus on episodic biomass burning plumes reaching Svalbard and can provide complementary information in addition to long-term variations. For rBC and ammonium, the centennial frequency of biomass burning episodes did not show a systematic trend throughout the Little Ice Age but showed fewer biomass burning episodes in the 13th and 15th centuries and more in the 18th century, despite colder temperatures, though for the latter a contribution of early anthropogenic emissions cannot be fully excluded. The VA, p-HBA, and formate records provide complementary information as increases in the frequency are concomitant with increases in background concentrations, meaning that fire episodes are not just stochastic events but are associated with longer-term regional climate variations. This is the case in the 17th century for all of the three species and also in the 13th century for VA. Table 3 shows the number of peaks matching (within ±1 year due to the different sampling) among the different proxies, associated with the percentage it represents in relation to the total number of peaks for each proxy. The best agreement is obtained between rBC and ammonium, with 21 peaks matching, which corresponds to 60 % (42 %) of the total number of ammonium (rBC) peaks. However, substantial dating uncertainties (Wendl et al., 2015) have to be considered in the bottom part of the LF-09 ice core, preventing us from assigning a specific biomass burning episode to every single peak.
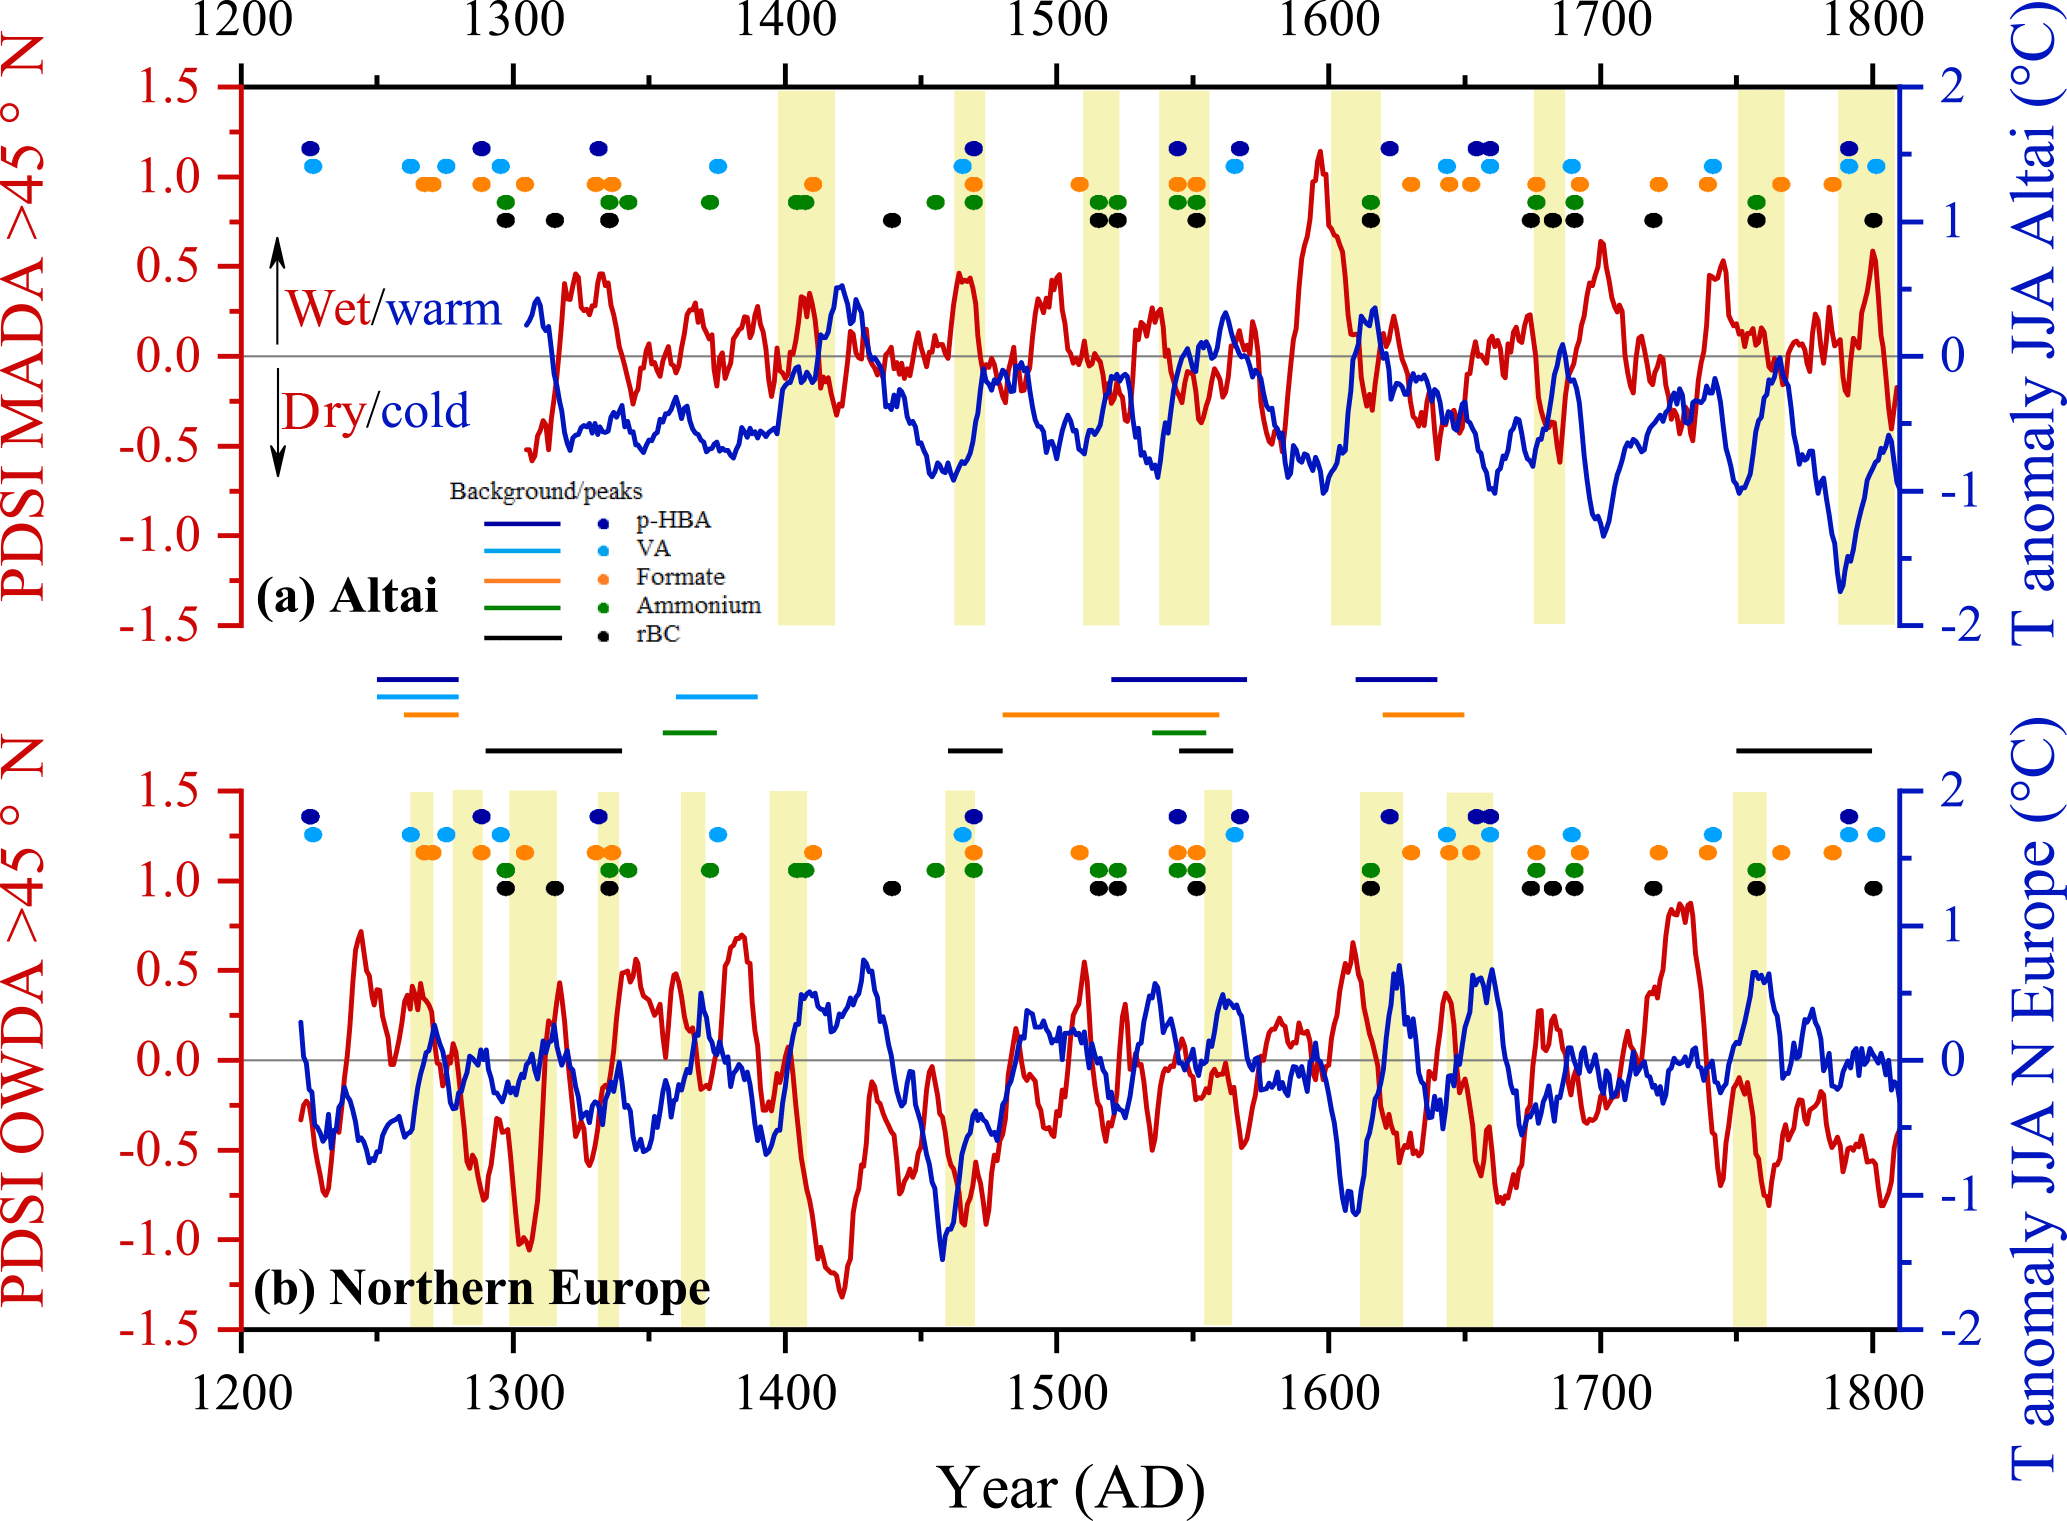
Figure 8Summer temperature (JJA) anomalies and drought (PDSI: Palmer drought severity index) reconstructions along with periods of enhanced biomass burning (colored lines between the two panels) and fire peaks (colored dots) in the LF ice core, (a) for the Altai region: temperature record from Büntgen et al. (2016) and drought record from the Monsoon Asia Drought Atlas (MADA, selected area: 45–57.5∘ N and 60–135∘ E, Cook et al., 2010) and (b) for Northern Europe: temperature record from Esper et al. (2014) and drought record from the Old World Drought Atlas (OWDA, selected area: 45–71∘ N and 12∘ W–45∘ E, Cook et al., 2015). Yellow bars represent periods of increasing JJA temperatures associated with biomass burning peaks.
Interestingly, severe droughts were reported over central Europe in 1540 (Wetter et al., 2014) and over northern central Europe between 1437 and 1473 (Cook et al., 2015). The case of the 1797 peak in the rBC and VA records is also remarkable as outstanding values in various biomass burning proxies were detected in several ice cores from Greenland during the last decade of the 18th century. In the NEEM ice core, rBC and levoglucosan were greatly enhanced between 1787 and 1791 (Sigl et al., 2013; Zennaro et al., 2014), while a very strong peak was visible in 1794 in the D4 ice core (McConnell et al., 2007) and in 1799 in the Summit 2010 ice core (Keegan et al., 2014). Ammonium records from the ice cores mentioned above all showed peak values in the same decade (Legrand et al., 2016), supporting the fact that this period of enhanced biomass burning could originate from the same decadal-scale climatic event. Severe drought conditions prevailed in central Asia during this decade due to South Asian monsoon failure (Cook et al., 2010). According to the dust proxy records from the Dasuopu ice core (Tibet), this decade experienced the driest conditions of the last millennium for this part of the globe (Thompson et al., 2000). In the Altai region, 9 out of 10 years between 1783 and 1792 belonged to the 10 % of the coldest years of the time period 1200–1850, while the following summers between 1793 and 1811 were clearly warmer (Büntgen et al., 2016). Those cold and dry conditions likely promoted dry dead wood accumulation, which then facilitated fire spread when temperatures rose later in the 1790s, a situation in agreement with the findings from Eichler et al. (2011). In Fig. 8 an exhaustive comparison is made between enhanced background concentration periods and peak years versus summer temperature anomalies and drought reconstructions from two regions of northern Eurasia for which datasets are available, namely northern Europe (Cook et al., 2015; Esper et al., 2014) and the Altai (Büntgen et al., 2016; Cook et al., 2010). It appears that biomass burning episodes frequently occurred in concert with decadal-scale summer temperature increases. Conversely, the link with moisture variations seems less consistent as conditions were either drier or wetter than average depending on the period, suggesting that summer temperature is the controlling factor for biomass burning activity in these regions. While dry conditions can lead to dead fuel accumulation (Eichler et al., 2011), wet conditions promote biomass productivity, especially for grasslands (Pederson et al., 2014). Both of these different mechanisms can enhance fire severity in the context of decadal-scale temperature increases.
Refractory black carbon (rBC) was analyzed in two ice cores from the Lomonosovfonna ice field, Svalbard, spanning 1222–2011. Long-term trends were discussed and compared to other ice core records and climate proxies in order to assess the representativeness of the rBC signal archived in the LF ice core in terms of anthropogenic and biomass burning inputs. Our results show that a clear anthropogenic imprint is present since the beginning of the Industrial Revolution, thus hindering the identification of natural biomass burning trends in the most recent 2 centuries. Concentrations of rBC we attributed to predominantly industrial emissions show two maxima, at the end of the 19th century and in the middle of the 20th century. This profile differs from those observed in Greenland ice cores and we suggest that Eurasian emissions account for most of the rBC deposition in the LF ice core in contrast to Greenland where North American emission sources appear more important. Contrary to the Holtedahlfonna EC record, LF rBC concentrations decreased in the last 40 years, in agreement with atmospheric measurements throughout the Arctic. However, during the warm climate regime over most of the 20th century, parts of the record experienced high levels of melting, which potentially disturbed the preservation of the rBC signal due to percolation and runoff. We thus advocate for a careful interpretation of the trends, especially for the time period with low concentrations between 1910 and 1940, which could be an artefact resulting from the early 20th century Arctic warming.
Before the 19th century, as both the melting and the anthropogenic influence are shown to be low, the LF rBC record can be used to reconstruct past biomass burning trends. No obvious long-term variability is evident in both the rBC and ammonium records. Formate, VA, and p-HBA records, however, exhibit a more pronounced decadal-to-centennial-scale variability with a decreasing long-term trend throughout the Little Ice Age interrupted by several multi-decadal periods of enhanced biomass burning activity, the most remarkable one occurring in the 17th century. Those periods, as well as some single peak events such as the one around 1790, coincide in time with other reconstructed periods of increased fire activity from ice cores in Siberia and Greenland. We suggest that the paleofire record from the LF ice core primarily reflects biomass burning episodes from northern Eurasia, induced by decadal-scale summer temperature increases. Our study highlights the need of a multi-proxy reconstruction in order to efficiently capture past changes in biomass burning as each proxy possesses its own behavior and sensitivity towards emission, transport, degradation in the atmosphere, deposition, and post-depositional processes. Such reconstructions are of prime importance to gain a better understanding of the complex linkages among fires, climate, and human activities as future biomass burning trends under a warmer climate remain largely unknown.
The rBC data are available at the US National Oceanic and Atmospheric Administration (NOAA) data center for paleoclimate (ice core sites) at the following address: http://www.ncdc.noaa.gov/data-access/paleoclimatology-data/datasets/ice-core (last access: 17 August 2018).
DO performed SP2 measurements, analyzed the data, and wrote the paper. IAW cut the LF-09 ice core, performed the dating, and designed the analytical method. LS optimized the method and performed SP2 analyses. MiS helped with the data interpretation. CPV processed and dated the LF-11 ice core. EI organized the field campaigns in Svalbard. MaS designed and led the project, organized and conducted ice core drilling, and led the paper writing.
The authors declare that they have no conflict of interest.
This study was supported by the Swiss National Science Foundation through the
Sinergia project “Paleo fires from high-alpine ice cores”
(CRSII2_154450/1). The authors would like to thank Sabina Brütsch for
ion chromatography analyses; Philipp Steffen, Denis Alija, and Susanne
Haselbeck for helping with the SP2 measurements; Joel Corbin, Robin Modini,
Jinfeng Yuan, and Susan Kaspari for their support regarding technical issues
with the SP2; the NPI, Utrecht University, and Uppsala University joint team
that retrieved the LF-11 ice core; Mackenzie Grieman for the VA and p-HBA
data; and the three reviewers for their relevant comments improving the
quality of the paper.
Edited by: Aurélien Dommergue
Reviewed by: Legrand Michel, Mauro Rubino, and one anonymous referee
Aamaas, B., Bøggild, C. E., Stordal, F., Berntsen, T., Holmén, K., and Ström, J.: Elemental carbon deposition to Svalbard snow from Norwegian settlements and long-range transport, Tellus B, 63, 340–351, 2011.
AMAP: The Impact of Black Carbon on Arctic Climate, by: Quinn, P. K., Stohl, A., Arneth, A., Berntsen, T., Burkhart, J. F., Christensen, J., Flanner, M., Kupiainen, K., Lihavainen, H., Shepherd, M., Shevchenko, V., Skov, H., and Vestreng, V., Arctic Monitoring and Assessment Programme (AMAP), Oslo, Norway, 72 pp, 2011a.
AMAP: Snow, Water, Ice and Permafrost in the Arctic (SWIPA): Climate Change and the Cryosphere, Arctic Monitoring and Assessment Programme (AMAP), Oslo, Norway, xii + 538 pp., 2011b.
Bauer, S. E., Bausch, A., Nazarenko, L., Tsigaridis, K., Xu, B. Q., Edwards, R., Bisiaux, M., and McConnell, J.: Historical and future black carbon deposition on the three ice caps: Ice core measurements and model simulations from 1850 to 2100, J. Geophys. Res.-Atmos., 118, 7948–7961, 2013.
Beaudon, E., Moore, J. C., Martma, T., Pohjola, V. A., van de Wal, R. S. W., Kohler, J., and Isaksson, E.: Lomonosovfonna and Holtedahlfonna ice cores reveal east–west disparities of the Spitsbergen environment since AD 1700, J. Glaciol., 59, 1069–1083, 2013.
Bengtsson, L., Semenov, V. A., and Johannessen, O. M.: The Early Twentieth-Century Warming in the Arctic – A Possible Mechanism, J. Climate, 17, 4045–4057, 2004.
Bond, T. C., Bhardwaj, E., Dong, R., Jogani, R., Jung, S. K., Roden, C., Streets, D. G., and Trautmann, N. M.: Historical emissions of black and organic carbon aerosol from energy-related combustion, 1850–2000, Global Biogeochem. Cy., 21, GB2018, https://doi.org/10.1029/2006GB002840, 2007.
Bond, T. C., Doherty, S. J., Fahey, D. W., Forster, P. M., Berntsen, T., DeAngelo, B. J., Flanner, M. G., Ghan, S., Karcher, B., Koch, D., Kinne, S., Kondo, Y., Quinn, P. K., Sarofim, M. C., Schultz, M. G., Schulz, M., Venkataraman, C., Zhang, H., Zhang, S., Bellouin, N., Guttikunda, S. K., Hopke, P. K., Jacobson, M. Z., Kaiser, J. W., Klimont, Z., Lohmann, U., Schwarz, J. P., Shindell, D., Storelvmo, T., Warren, S. G., and Zender, C. S.: Bounding the role of black carbon in the climate system: A scientific assessment, J. Geophys. Res.-Atmos., 118, 5380–5552, 2013.
Büntgen, U., Myglan, V. S., Charpentier Ljungqvist, F., McCormick, M., Di Cosmo, N., Sigl, M., Jungclaus, J., Wagner, S., Krusic, P. J., Esper, J., Kaplan, J. O., de Vaan, M. A. C., Luterbacher, J., Wacker, L., Tegel, W., and Kirdyanov, A. V.: Cooling and societal change during the Late Antique Little Ice Age from 536 to around 660 AD, Nat. Geosci., 9, 231–236, 2016.
Catford, K.: The Industrial Archaeology of Spitsbergen, Ind. Archaeol. Rev., 24, 23–36, 2002.
Clarke, A. D. and Noone, K. J.: Soot in the Arctic snowpack: a cause for perturbations in radiative transfer, Atmos. Environ., 19, 2045–2053, 1985.
Conway, H., Gades, A., and Raymond, C. F.: Albedo of dirty snow during conditions of melt, Water Resour. Res., 32, 1713–1718, 1996.
Cook, E. R., Anchukaitis, K. J., Buckley, B. M., D'Arrigo, R. D., Jacoby, G. C., and Wright, W. E.: Asian Monsoon Failure and Megadrought During the Last Millenium, Science, 328, 486–489, 2010.
Cook, E. R., Seager, R., Kushnir, Y., Briffa, K. R., Büntgen, U., Frank, D., Krusic, P. J., Tegel, W., van der Schrier, G., Andreu-Hayles, L., Baillie, M., Baittinger, C., Bleicher, N., Bonde, N., Brown, D., Carrer, M., Cooper, R., Čufar, K., Dittmar, C., Esper, J., Griggs, C., Gunnarson, B., Günther, B., Gutierrez, E., Haneca, K., Helama, S., Herzig, F., Heussner, K.-U., Hofmann, J., Janda, P., Kontic, R., Köse, N., Kyncl, T., Levanič, T., Linderholm, H., Manning, S., Melvin, T. M., Miles, D., Neuwirth, B., Nicolussi, K., Nola, P., Panayotov, M., Popa, I., Rothe, A., Seftigen, K., Seim, A., Svarva, H., Svoboda, M., Thun, T., Timonen, M., Touchan, R., Trotsiuk, V., Trouet, V., Walder, F., Ważny, T., Wilson, R., and Zang, C.: Old World megadroughts and pluvials during the Common Era, Science Advances, 1, e1500561, https://doi.org/10.1126/sciadv.1500561, 2015.
Deane, P.: The first industrial revolution, Cambridge University Press, Cambridge, UK, 1965.
De Angelis, M. and Legrand, M.: Preliminary investigations of post depositional effects on HCl, HNO3, and organic acids in polar firn, in: Ice Core Studies of Global Biogeochemical Cycles, edited by: Delmas, R. J., NATO ASI Series I, 30, 336–381, 1995.
Dibb, J. E., Talbot, R. W., Whitlow, S. I., Shipham, M. C., Winterle, J., McConnell, J., and Bales, R.: Biomass burning signatures in the atmosphere and snow at Summit, Greenland: An event on 5 August 1994, Atmos. Environ., 30, 553–561, 1996.
Divine, D., Isaksson, E., Martma, T., Meijer, H. A. J., Moore, J., Pohjola, V., van de Wal, R. S. W., and Godtliebsen, F.: Thousand years of winter surface air temperature variations in Svalbard and northern Norway reconstructed from ice core data, Polar Res., 30, 7379, https://doi.org/10.3402/polar.v30i0.7379, 2011.
Doherty, S. J., Warren, S. G., Grenfell, T. C., Clarke, A. D., and Brandt, R. E.: Light-absorbing impurities in Arctic snow, Atmos. Chem. Phys., 10, 11647–11680, https://doi.org/10.5194/acp-10-11647-2010, 2010.
Doherty, S. J., Grenfell, T. C., Forsström, S., Hegg, D. L., Brandt, R. E., and Warren, S. G.: Observed vertical redistribution of black carbon and other insoluble light-absorbing particles in melting snow, J. Geophys. Res.-Atmos., 118, 5553–5569, 2013.
Dutkiewicz, V. A., DeJulio, A. M., Ahmed, T., Laing, J., Hopke, P. K., Skeie, R. B., Viisanen, Y., Paatero, J., and Husain, L.: Forty-seven years of weekly atmospheric black carbon measurements in the Finnish Arctic: Decrease in black carbon with declining emissions, J. Geophys. Res.-Atmos., 119, 7667–7683, 2014.
Eichler, A., Schwikowski, M., Gäggeler, H. W., Furrer, V., Synal, H.-A., Beer, J., Saurer, M., and Funk, M.: Glaciochemical dating of an ice core from upper Grenzgletscher (4200 m a.s.l.), J. Glaciol., 46, 507–515, 2000.
Eichler, A., Brütsch, S., Olivier, S., Papina, T., and Schwikowski, M.: A 750 year ice core record of past biogenic emissions from Siberian boreal forests, Geophys. Res. Lett., 36, L18813, https://doi.org/10.1029/2009GL038807, 2009.
Eichler, A., Tinner, W., Brütsch, S., Olivier, S., Papina, T., and Schwikowski, M.: An ice-core based history of Siberian forest fires since AD 1250, Quaternary Sci. Rev., 30, 1027–1034, 2011.
Eleftheriadis, K., Vratolis, S., and Nyeki, S.: Aerosol black carbon in the European Arctic: Measurements at Zeppelin station, Ny Ålesund, Svalbard from 1998–2007, Geophys. Res. Lett., 36, L02809, 2009.
Esper, J., Düthorn, E., Krusic, P. J., Timonen, M., and Büntgen, U.: Northern European summer temperature variations over the Common Era from integrated tree-rings density records, J. Quaternary Sci., 29, 487–494, 2014.
Fischer, H., Schüpbach, S., Gfeller, G., Bigler, M., Rothlisberger, R., Erhardt, T., Stocker, T. F., Mulvaney, R., and Wolff, E.: Millennial changes in North American wildfire and soil activity over the last glacial cycle, Nat. Geosci., 8, 723–728, 2015.
Flanner, M. G., Zender, C. S., Randerson, J. T., and Rasch, P. J.: Present-day climate forcing and response from black carbon in snow, J. Geophys. Res., 112, D11202, https://doi.org/10.1029/2006JD008003, 2007.
Forsström, S., Ström, J., Pedersen, C. A., Isaksson, E., and Gerland, S.: Elemental carbon distribution in Svalbard snow, J. Geophys. Res., 114, D19112, https://doi.org/10.1029/2008JD011480, 2009.
Forsström, S., Isaksson, E., Skeie, R. B., Ström, J., Pedersen, C. A., Hudson, S. R., Berntsen, T. K., Lihavainen, H., Godtliebsen, F., and Gerland, S.: Elemental carbon measurements in European Arctic snow packs, J. Geophys. Res.-Atmos., 118, 13614–13627, 2013.
Fuhrer, K., Neftel, A., Anklin, M., Staffelbach, T., and Legrand, M.: High-resolution ammonium ice core record covering a complete glacial-interglacial cycle, J. Geophys. Res., 101, 4147–4164, 1996.
Gabbi, J., Huss, M., Bauder, A., Cao, F., and Schwikowski, M.: The impact of Saharan dust and black carbon on albedo and long-term mass balance of an Alpine glacier, The Cryosphere, 9, 1385–1400, https://doi.org/10.5194/tc-9-1385-2015, 2015.
Ginot, P., Stampfli, F., Stampfli, D., Schwikowski, M., and Gäggeler, H. W.: FELICS, a new ice core drilling system for high-altitude glaciers, Memoirs of National Institute of Polar Research, Special issue, 56, 38–48, 2002.
Goldberg, E. D.: Black Carbon in the Environment, Wiley, New York, USA, 1985.
Gong, S. L., Zhao, T. L., Sharma, S., Toom-Sauntry, D., Lavoué, D., Zhang, X. B., Leaitch, W. R., and Barrie, L. A.: Identification of trends and interannual variability of sulfate and black carbon in the Canadian high Arctic: 1981–2007, J. Geophys. Res., 115, D07305, https://doi.org/10.1029/2009JD012943, 2010.
Gordiyenko, F. G., Kotlyakov, V. M., Punning, Y.-K. M., and Vairmäe, R.: Study of a 200-m core from the Lomonosov ice plateau on Spitsbergen and the paleoclimatic implications, Polar Geography and Geology, 5, 242–251, 1981.
Goto-Azuma, K. and Koerner, R. M.: Ice core studies of anthropogenic sulfate and nitrate trends in the Arctic, J. Geophys. Res., 106, 4959–4969, 2001.
Grieman, M. M., Greaves, J., and Saltzman, E. S.: A method for analysis of vanillic acid in polar ice cores, Clim. Past, 11, 227–232, https://doi.org/10.5194/cp-11-227-2015, 2015.
Grieman, M. M., Aydin, M., Fritzsche, D., McConnell, J. R., Opel, T., Sigl, M., and Saltzman, E. S.: Aromatic acids in a Eurasian Arctic ice core: a 2600-year proxy record of biomass burning, Clim. Past, 13, 395–410, https://doi.org/10.5194/cp-13-395-2017, 2017.
Grieman, M. M., Aydin, M., Isaksson, E., Schwikowski, M., and Saltzman, E. S.: Aromatic acids in an Arctic ice core from Svalbard: a proxy record of biomass burning, Clim. Past, 14, 637–651, https://doi.org/10.5194/cp-14-637-2018, 2018.
Grinsted, A., Moore, J. C., Pohjola, V., Martma, T., and Isaksson, E.: Svalbard summer melting, continentality, and sea ice extent from the Lomonosovfonna ice core, J. Geophys. Res., 111, D07110, https://doi.org/10.1029/2005JD006494, 2006.
Gysel, M., Laborde, M., Olfert, J. S., Subramanian, R., and Gröhn, A. J.: Effective density of Aquadag and fullerene soot black carbon reference materials used for SP2 calibration, Atmos. Meas. Tech., 4, 2851–2858, https://doi.org/10.5194/amt-4-2851-2011, 2011.
Hansen, J. and Nazarenko, L.: Soot climate forcing via snow and ice albedos, P. Natl. Acad. Sci. USA, 101, 423–428, 2004.
Hennigan, C. J., Sullivan, A. P., Collett, J. L., and Robinson, A. L.: Levoglucosan stability in biomass burning particles exposed to hydroxyl radicals, Geophys. Res. Lett., 37, L09806, https://doi.org/10.1029/2010GL043088, 2010.
Hicks, S. and Isaksson, E.: Assessing source areas of pollutants from studies of fly ash, charcoal and pollen from Svalbard snow and ice, J. Geophys. Res., 111, D02113, https://doi.org/10.1029/2005JD006167, 2006.
Hirdman, D., Sodemann, H., Eckhardt, S., Burkhart, J. F., Jefferson, A., Mefford, T., Quinn, P. K., Sharma, S., Ström, J., and Stohl, A.: Source identification of short-lived air pollutants in the Arctic using statistical analysis of measurement data and particle dispersion model output, Atmos. Chem. Phys., 10, 669–693, https://doi.org/10.5194/acp-10-669-2010, 2010a.
Hirdman, D., Burkhart, J. F., Sodemann, H., Eckhardt, S., Jefferson, A., Quinn, P. K., Sharma, S., Ström, J., and Stohl, A.: Long-term trends of black carbon and sulphate aerosol in the Arctic: changes in atmospheric transport and source region emissions, Atmos. Chem. Phys., 10, 9351–9368, https://doi.org/10.5194/acp-10-9351-2010, 2010b.
Hisdal, V.: Svalbard: nature and history, Norsk Polarinstitutt, Oslo, Norway, 1998.
Hoffmann, D., Tilgner, A., Iinuma, Y., and Herrmann, H.: Atmospheric stability of levoglucosan: a detailed laboratory and modeling study, Environ. Sci. Technol., 44, 694–699, 2010.
Iizuka, Y., Igarashi, M., Kamiyama, K., Motoyama, H., and Watanabe, O.: Ratios of Mg2+ ∕ Na+ in snowpack and an ice core at Austfonna ice cap, Svalbard, as an indicator of seasonal melting, J. Glaciol., 48, 452–460, 2002.
IPCC: Climate Change 2013: The Physical Science Basis, Contribution of Working Group I to the Fifth Assessment Report of the Intergovernmental Panel on Climate Change, edited by: Stocker, T. F., Qin, D., Plattner, G.-K., Tignor, M., Allen, S. K., Boschung, J., Nauels, A., Xia, Y., Bex, V., and Midgley, P. M., Cambridge University Press, Cambridge, United Kingdom and New York, NY, USA, 1535 pp., 2013.
Isaksson, E., Pohjola, V., Jauhiainen, T., Moore, J., Pinglot, J. F., Vaikmaae, R., van de Wal, R. S. W., Hagen, J. O., Ivask, J., Karlöf, L., Martma, T., Meijer, H. A. J., Mulvaney, R., Thomassen, M., and van den Broeke, M.: A new ice-core record from Lomonosovfonna, Svalbard: viewing the 1920–97 data in relation to present climate and environmental conditions, J. Glaciol., 47, 335–345, 2001.
Jenk, T. M., Szidat, S., Schwikowski, M., Gäggeler, H. W., Brütsch, S., Wacker, L., Synal, H.-A., and Saurer, M.: Radiocarbon analysis in an Alpine ice core: record of anthropogenic and biogenic contributions to carbonaceous aerosols in the past (1650–1940), Atmos. Chem. Phys., 6, 5381–5390, https://doi.org/10.5194/acp-6-5381-2006, 2006.
Jenkins, M., Kaspari, S., Kang, S.-C., Grigholm, B., and Mayewski, P. A.: Tibetan Plateau Geladaindong black carbon ice core record (1843–1982): Recent increases due to higher emissions and lower snow accumulation, Adv. Clim. Change Res., 7, 132–138, 2016.
Kaspari, S. D., Schwikowski, M., Gysel, M., Flanner, M. G., Kang, S., Hou, S., and Mayewski, P. A.: Recent Increase in Black Carbon Concentrations from a Mt. Everest Ice Core Spanning 1860–2000 AD, Geophys. Res. Lett., 38, L04703, https://doi.org/10.1029/2010GL046096, 2011.
Kawamura, K., Izawa, Y., Mochida, M., and Shiraiwa, T.: Ice core records of biomass burning tracers (levoglucosan and dehydroabietic, vanillic and p-hydroxybenzoic acids) and total organic carbon for past 300 years in the Kamchatka Peninsula, Northeast Asia, Geochim. Cosmochim. Ac., 99, 317–329, 2012.
Keegan, K. M., Albert, M. R., McConnell, J. R., and Baker, I.: Climate change and forest fires synergistically drive widespread melt events of the Greenland Ice Sheet, P. Natl. Acad. Sci. USA, 111, 7964–7967, 2014.
Kehrwald, N., Zangrando, R., Gabrielli, P., Jaffrezo, J.-L., Boutron, C., Barbante, C., and Gambaro, A.: Levoglucosan as a specific marker of fire events in Greenland snow, Tellus B, 64, 18196–18204, 2012.
Kekonen, T., Moore, J., Perämäki, P., Mulvaney, R., Isaksson, E., Pohjola, V., and van de Wal, R. S. W.: The 800 year long ion record from the Lomonosovfonna (Svalbard) ice core, J. Geophys. Res., 110, D07304, https://doi.org/10.1029/2004JD005223, 2005.
Kellerhals, T., Brütsch, S., Sigl, M., Knüsel, S., Gäggeler, H. W., and Schwikowski, M.: Ammonium concentration in ice cores: A new proxy for regional temperature reconstruction?, J. Geophys. Res., 115, D16123, https://doi.org/10.1029/2009JD012603, 2010.
Lee, Y. H., Lamarque, J.-F., Flanner, M. G., Jiao, C., Shindell, D. T., Berntsen, T., Bisiaux, M. M., Cao, J., Collins, W. J., Curran, M., Edwards, R., Faluvegi, G., Ghan, S., Horowitz, L. W., McConnell, J. R., Ming, J., Myhre, G., Nagashima, T., Naik, V., Rumbold, S. T., Skeie, R. B., Sudo, K., Takemura, T., Thevenon, F., Xu, B., and Yoon, J.-H.: Evaluation of preindustrial to present-day black carbon and its albedo forcing from Atmospheric Chemistry and Climate Model Intercomparison Project (ACCMIP), Atmos. Chem. Phys., 13, 2607–2634, https://doi.org/10.5194/acp-13-2607-2013, 2013.
Legrand, M. and De Angelis, M.: Light carboxylic acids in Greenland ice: A record of past forest fires and vegetation emissions from the boreal zone, J. Geophys. Res., 101, 4129–4145, 1996.
Legrand, M., McConnell, J., Fischer, H., Wolff, E. W., Preunkert, S., Arienzo, M., Chellman, N., Leuenberger, D., Maselli, O., Place, P., Sigl, M., Schüpbach, S., and Flannigan, M.: Boreal fire records in Northern Hemisphere ice cores: a review, Clim. Past, 12, 2033–2059, https://doi.org/10.5194/cp-12-2033-2016, 2016.
Lim, S., Faïn, X., Zanatta, M., Cozic, J., Jaffrezo, J.-L., Ginot, P., and Laj, P.: Refractory black carbon mass concentrations in snow and ice: method evaluation and inter-comparison with elemental carbon measurement, Atmos. Meas. Tech., 7, 3307–3324, https://doi.org/10.5194/amt-7-3307-2014, 2014.
Lim, S., Faïn, X., Ginot, P., Mikhalenko, V., Kutuzov, S., Paris, J.-D., Kozachek, A., and Laj, P.: Black carbon variability since preindustrial times in the eastern part of Europe reconstructed from Mt. Elbrus, Caucasus, ice cores, Atmos. Chem. Phys., 17, 3489–3505, https://doi.org/10.5194/acp-17-3489-2017, 2017.
Matoba, S., Narita, H., Motoyama, H., Kamiyama, K., and Watanabe, O.: Ice core chemistry of Vestfonna ice cap in Svalbard, Norway, J. Geophys. Res., 107, 4721–4727, 2002.
McConnell, J. R., Edwards, R., Kok, G. L., Flanner, M. G., Zender, C. S., Saltzman, E. S., Banta, J. R., Pasteris, D. R., Carter, M. M., and Kahl, J. D. W.: 20th-century industrial black carbon emissions altered arctic climate forcing, Science, 317, 1381–1384, 2007.
McKay, N. P. and Kaufman, D. S.: An extended Arctic proxy temperature database for the past 2,000 years, Sci. Data, 1, 140026, https://doi.org/10.1038/sdata.2014.26, 2014.
Moore, J. C., Grinsted, A., Kekonen, T., and Pohjola, V.: Separation of melting and environmental signals in an ice core with seasonal melt, Geophys. Res. Lett., 32, L10501, https://doi.org/10.1029/2005GL023039, 2005.
Müller-Tautges, C., Eichler, A., Schwikowski, M., Pezzatti, G. B., Conedera, M., and Hoffmann, T.: Historic records of organic compounds from a high Alpine glacier: influences of biomass burning, anthropogenic emissions, and dust transport, Atmos. Chem. Phys., 16, 1029–1043, https://doi.org/10.5194/acp-16-1029-2016, 2016.
Nordli, Ø., Przybylak, R., Ogilvie, A. E. J., and Isaksen, K.: Long-term temperature trends and variability on Spitsbergen: the extended Svalbard Airport temperature series, 1898–2012, Polar Res., 33, 21349, https://doi.org/10.3402/polar.v33.21349, 2014.
Pederson, N., Hessl, A. E., Baatarbileg, N., Anchukaitis, K. J., and Di Cosmo, N.: Pluvials, droughts, the Mongol empire, and modern Mongolia, P. Natl. Acad. Sci. USA, 111, 4375–4379, 2014.
Petzold, A., Ogren, J. A., Fiebig, M., Laj, P., Li, S.-M., Baltensperger, U., Holzer-Popp, T., Kinne, S., Pappalardo, G., Sugimoto, N., Wehrli, C., Wiedensohler, A., and Zhang, X.-Y.: Recommendations for reporting “black carbon” measurements, Atmos. Chem. Phys., 13, 8365–8379, https://doi.org/10.5194/acp-13-8365-2013, 2013.
Pohjola, V. A., Moore, J. C., Isaksson, E., Jauhiainen, T., Van de Wal, R. S. W., Martma, T., Meijer, H. A. J., and Vaikmäe, R.: Effect of periodic melting on geochemical and isotopic signals in an ice core from Lomonosovfonna, Svalbard, J. Geophys. Res., 107, 4036–4049, 2002.
Quinn, P. K., Shaw, G., Andrews, E., Dutton, E. G., Ruoho-Airola, T., and Gong, S. L.: Arctic Haze: current trends and knowledge gaps, Tellus B, 59, 99–114, 2007.
Ramanathan, V. and Carmichael, G.: Global and regional climate changes due to black carbon, Nat. Geosci., 1, 221–227, 2008.
Ruppel, M. M., Isaksson, E., Ström, J., Beaudon, E., Svensson, J., Pedersen, C. A., and Korhola, A.: Increase in elemental carbon values between 1970 and 2004 observed in a 300-year ice core from Holtedahlfonna (Svalbard), Atmos. Chem. Phys., 14, 11447–11460, https://doi.org/10.5194/acp-14-11447-2014, 2014.
Ruppel, M. M., Soares, J., Gallet, J.-C., Isaksson, E., Martma, T., Svensson, J., Kohler, J., Pedersen, C. A., Manninen, S., Korhola, A., and Ström, J.: Do contemporary (1980–2015) emissions determine the elemental carbon deposition trend at Holtedahlfonna glacier, Svalbard?, Atmos. Chem. Phys., 17, 12779–12795, https://doi.org/10.5194/acp-17-12779-2017, 2017.
Schwarz, J. P., Gao, R. S., Fahey, D. W., Thomson, D. S., Watts, L. A., Wilson, J. C., Reeves, J. M., Darbeheshti, M., Baumgardner, D. G., Kok, G. L., Chung, S. H., Schulz, M., Hendricks, J., Lauer, A., Karcher, B., Slowik, J. G., Rosenlof, K. H., Thompson, T. L., Langford, A. O., Loewenstein, M., and Aikin, K. C.: Single-particle measurements of midlatitude black carbon and light-scattering aerosols from the boundary layer to the lower stratosphere, J. Geophys. Res., 111, D16207, https://doi.org/10.1029/2006JD007076, 2006.
Schwarz, J. P., Doherty, S. J., Li, F., Ruggiero, S. T., Tanner, C. E., Perring, A. E., Gao, R. S., and Fahey, D. W.: Assessing Single Particle Soot Photometer and Integrating Sphere/Integrating Sandwich Spectrophotometer measurement techniques for quantifying black carbon concentration in snow, Atmos. Meas. Tech., 5, 2581–2592, https://doi.org/10.5194/amt-5-2581-2012, 2012.
Serreze, M. C. and Barry, R. G.: Processes and impacts of Arctic amplification: A research synthesis, Global Planet. Change, 77, 85–96, 2011.
Sharma, S., Lavoué, D., Cachier, H., Barrie, L. A., and Gong, S. L.: Long-term trends of the black carbon concentrations in the Canadian Arctic, J. Geophys. Res., 109, D15203, https://doi.org/10.1029/2003JD004331, 2004.
Shaw, G. E.: The Arctic Haze Phenomenon, B. Am. Meteorol. Soc., 76, 2403–2413, 1995.
Shindell, D. T., Chin, M., Dentener, F., Doherty, R. M., Faluvegi, G., Fiore, A. M., Hess, P., Koch, D. M., MacKenzie, I. A., Sanderson, M. G., Schultz, M. G., Schulz, M., Stevenson, D. S., Teich, H., Textor, C., Wild, O., Bergmann, D. J., Bey, I., Bian, H., Cuvelier, C., Duncan, B. N., Folberth, G., Horowitz, L. W., Jonson, J., Kaminski, J. W., Marmer, E., Park, R., Pringle, K. J., Schroeder, S., Szopa, S., Takemura, T., Zeng, G., Keating, T. J., and Zuber, A.: A multi-model assessment of pollution transport to the Arctic, Atmos. Chem. Phys., 8, 5353–5372, https://doi.org/10.5194/acp-8-5353-2008, 2008.
Sigl, M., McConnell, J. R., Layman, L., Maselli, O., McGwire, K., Pasteris, D., Dahl-Jensen, D., Steffensen, J. P., Vinther, B., Edwards, R., Mulvaney, R., and Kipfstuhl, S.: A new bipolar ice core record of volcanism from WAIS Divide and NEEM and implications for climate forcing of the last 2000 years, J. Geophys. Res.-Atmos., 118, 1151–1169, 2013.
Simoneit, B. R. T.: Biomass burning – a review of organic tracers for smoke from incomplete combustion, Appl. Geochem., 17, 129–162, 2002.
Spielvogel, J. J.: Western Civilization: A Brief History, 7th edn., Wadsworth, Cengage Learning, Boston, USA, 732 pp., 2010.
Stephens, M., Turner, N., and Sandberg, J.: Particle identification by laser-induced incandescence in a solid-state laser cavity, Appl. Optics, 42, 3726–3736, 2003.
Stocks, B. J., Mason, J. A., Todd, J. B., Bosch, E. M., Wotton, B. M., Amiro, B. D., Flannigan, M. D., Hirsch, K. G., Logan, K. A., Martell, D. L., and Skinner, W. R.: Large forest fires in Canada, 1959–1997, J. Geophys. Res., 108, 8149, https://doi.org/10.1029/2001JD000484, 2003.
Stohl, A.: Characteristics of atmospheric transport into the Arctic troposphere, J. Geophys. Res., 111, D11306, https://doi.org/10.1029/2005JD006888, 2006.
Stohl, A., Klimont, Z., Eckhardt, S., Kupiainen, K., Shevchenko, V. P., Kopeikin, V. M., and Novigatsky, A. N.: Black carbon in the Arctic: the underestimated role of gas flaring and residential combustion emissions, Atmos. Chem. Phys., 13, 8833–8855, https://doi.org/10.5194/acp-13-8833-2013, 2013.
Thompson, L. G., Yao, T., Mosley-Thompson, E., Davis, M. E., Henderson, K. A., and Lin, P.-N.: A high-resolution millennial record of the South Asian Monsoon from Himalayan ice cores, Science, 289, 1916–1919, 2000.
Tunved, P., Ström, J., and Krejci, R.: Arctic aerosol life cycle: linking aerosol size distributions observed between 2000 and 2010 with air mass transport and precipitation at Zeppelin station, Ny-Ålesund, Svalbard, Atmos. Chem. Phys., 13, 3643–3660, https://doi.org/10.5194/acp-13-3643-2013, 2013.
Vega, C. P., Pohjola, V. A., Samyn, D., Pettersson, R., Isaksson, E., Björkman, M. P., Martma, T., Marca, A., and Kaiser, J.: First ice core records of stable isotopes from Lomonosovfonna, Svalbard, J. Geophys. Res.-Atmos., 120, 313–330, 2015a.
Vega, C. P., Björkman, M. P., Pohjola, V. A., Isaksson, E., Pettersson, R., Martma, T., Marca, A. D., and Kaiser, J.: Nitrate stable isotopes and major ions in snow and ice samples from four Svalbard sites, Polar Res., 34, 23246, https://doi.org/10.3402/polar.v34.23246, 2015b.
Vega, C. P., Pohjola, V. A., Beaudon, E., Claremar, B., van Pelt, W. J. J., Pettersson, R., Isaksson, E., Martma, T., Schwikowski, M., and Bøggild, C. E.: A synthetic ice core approach to estimate ion relocation in an ice field site experiencing periodical melt: a case study on Lomonosovfonna, Svalbard, The Cryosphere, 10, 961–976, https://doi.org/10.5194/tc-10-961-2016, 2016.
Wendl, I. A.: High resolution records of black carbon and other aerosol constituents from the Lomonosovfonna 2009 ice core, PhD thesis, University of Bern, Bern, Switzerland, 2014.
Wendl, I. A., Menking, J. A., Färber, R., Gysel, M., Kaspari, S. D., Laborde, M. J. G., and Schwikowski, M.: Optimized method for black carbon analysis in ice and snow using the Single Particle Soot Photometer, Atmos. Meas. Tech., 7, 2667–2681, https://doi.org/10.5194/amt-7-2667-2014, 2014.
Wendl, I. A., Eichler, A., Isaksson, E., Martma, T., and Schwikowski, M.: 800-year ice-core record of nitrogen deposition in Svalbard linked to ocean productivity and biogenic emissions, Atmos. Chem. Phys., 15, 7287–7300, https://doi.org/10.5194/acp-15-7287-2015, 2015.
Wetter, O., Pfister, C., Werner, J. P., Zorita, E., Wagner, S., Seneviratne, S. I., Herget, J., Grünewald, U., Luterbacher, J., Alcoforado, M.-J., Barriendos, M., Bieber, U., Brázdil, R., Burmeister, K. H., Camenisch, C., Contino, A., Dobrovolný, P., Glaser, R., Himmelsbach, I., Kiss, A., Kotyza, O., Labbé, T., Limanówka, D., Litzenburger, L., Nordl, Ø., Pribyl, K., Retsö, D., Riemann, D., Rohr, C., Siegfried, W., Söderberg, J., and Spring, J.-L.: The year-long unprecedented European heat and drought of 1540 – a worst case, Climatic Change, 125, 349–363, 2014.
Xu, B., Cao, J., Joswiak, D. R., Liu, X., Zhao, H., and He, J.: Post-depositional enrichment of black soot in snow-pack and accelerated melting of Tibetan glaciers, Environ. Res. Lett., 7, 014022, https://doi.org/10.1088/1748-9326/7/1/014022, 2012.
Zagorodnov, V. S., Samoylov, O. Y., Raykovskiy, Y. V., Tarusov, A. V., Kuznetsov, M. N., and Sazonov, A. V.: Glubinnoye stroyeniye lednikovogo plato Lomonosova na o. Zap. Shpitsbergen [Depth structure of the Lomonosov ice plateau, Spitsbergen], Mater. Glyatsiol. Issled., 50, 119–126, 1984.
Zdanowicz, C. M., Proemse, B. C., Edwards, R., Feiteng, W., Hogan, C. M., and Kinnard, C.: Historical black carbon deposition in the Canadian High Arctic: A 190-year long ice-core record from Devon Island, Atmos. Chem. Phys. Discuss., https://doi.org/10.5194/acp-2017-895, in review, 2017.
Zennaro, P., Kehrwald, N., McConnell, J. R., Schüpbach, S., Maselli, O. J., Marlon, J., Vallelonga, P., Leuenberger, D., Zangrando, R., Spolaor, A., Borrotti, M., Barbaro, E., Gambaro, A., and Barbante, C.: Fire in ice: two millennia of boreal forest fire history from the Greenland NEEM ice core, Clim. Past, 10, 1905–1924, https://doi.org/10.5194/cp-10-1905-2014, 2014.