the Creative Commons Attribution 4.0 License.
the Creative Commons Attribution 4.0 License.
 | 29 Aug 2018
How reliable are CMIP5 models in simulating dust optical depth?
Paul Ginoux
Dust aerosol plays an important role in the climate system by affecting the radiative and energy balances. Biases in dust modeling may result in biases in simulating global energy budget and regional climate. It is thus very important to understand how well dust is simulated in the Coupled Model Intercomparison Project Phase 5 (CMIP5) models. Here seven CMIP5 models using interactive dust emission schemes are examined against satellite-derived dust optical depth (DOD) during 2004–2016.
It is found that multi-model mean can largely capture the global spatial pattern and zonal mean of DOD over land in present-day climatology in MAM and JJA. Global mean land DOD is underestimated by −25.2 % in MAM to −6.4 % in DJF. While seasonal cycle, magnitude, and spatial pattern are generally captured by the multi-model mean over major dust source regions such as North Africa and the Middle East, these variables are not so well represented by most of the models in South Africa and Australia. Interannual variations in DOD are not captured by most of the models or by the multi-model mean. Models also do not capture the observed connections between DOD and local controlling factors such as surface wind speed, bareness, and precipitation. The constraints from surface bareness are largely underestimated while the influences of surface wind and precipitation are overestimated.
Projections of DOD change in the late half of the 21st century under the Representative Concentration Pathways 8.5 scenario in which the multi-model mean is compared with that projected by a regression model. Despite the uncertainties associated with both projections, results show some similarities between the two, e.g., DOD pattern over North Africa in DJF and JJA, an increase in DOD in the central Arabian Peninsula in all seasons, and a decrease over northern China from MAM to SON.
- Article
(7716 KB) -
Supplement
(14236 KB) - BibTeX
- EndNote


Dust is the second most abundant aerosol by mass in the atmosphere after sea salt. It absorbs and scatters both shortwave and longwave radiation and thus modifies local radiative budget and consequently vertical temperature profile, influencing global and regional climate. For instance, studies found dust influences the strength of the West African monsoon (e.g., Miller and Tegen, 1998; Miller et al., 2004; Mahowald et al., 2010; Strong et al., 2015) and Indian monsoonal rainfall (e.g., Vinoj et al., 2014; Jin et al., 2014, 2015, 2016; Solmon et al., 2015; Kim et al., 2016; Sharma and Miller, 2017). Dust aerosols were also found to have amplified droughts during the US Dust Bowl and Medieval Climate Anomaly (Cook et al., 2008, 2009, 2013), and they affect Atlantic tropical cyclones (e.g., Dunion and Velden, 2004; Wong and Dessler, 2005; Evan et al., 2006; Sun et al., 2008; Strong et al., 2018). Dust particles can also serve as ice cloud nuclei and influence the properties of the cloud (e.g., Levin et al., 1996; Rosenfield et al., 1997; Wurzler et al., 2000; Nakajima et al., 2001; Bangert et al., 2012) and affect regional radiative balance and hydrological cycle. When deposited in the oceans, iron-enriched dust also provides nutrients for phytoplankton, affecting ocean productivity and therefore carbon and nitrogen cycles and ocean albedo (e.g., Fung et al., 2000; Jickells et al., 2005; Shao et al., 2011).
Globally, the estimated radiative forcing from dust aerosol is 0.10 (−0.30 to +0.10) W m−2, a magnitude about one-fourth of the radiative forcing of sulfate aerosol or black carbon from fossil fuel and biofuel (Myhre et al., 2013; their Table 8.4). Biases in dust simulation may potentially affect global energy budgets and regional climate simulation. Thus, it is very important to examine the capability of current state-of-the-art climate models in simulating dust.
Only a few studies examined the Coupled Model Intercomparison Project Phase 5 (CMIP5) model output of dust and most of them are regional evaluations. For instance, Evan et al. (2014) examined model output for Africa, but mainly focused on an area over the northeastern Atlantic (10–20∘ N and 20–30∘ W) where a long-term proxy of dust optical depth (DOD) data over Cabo Verde islands is available (Evan and Mukhopadhyay, 2010). They found models underestimated dust emission and mass path and failed to capture the interannual variations from 1960 to 2004, as models did not capture the negative connection between dust mass path and precipitation over the Sahel.
Another work examining CMIP5 aerosol optical depth (AOD) is by Sanap et al. (2014) for India. They compared dust distribution in the models with the Earth Probe Total Ozone Mapping Spectrometer (EPTOMS)/Ozone monitoring Instrument (OMI) aerosol index (AI) from 2000 to 2005. They found most CMIP5 models, except two HadGEM2 models, underestimated dust load over the Indo-Gangetic Plains and suggested the biases are due to a misrepresentation of 850 hPa winds in the models. Later, Misra et al. (2016) also examined CMIP5-modeled AOD for India but did not specifically focus on dust.
Shindell et al. (2013) examined the output of 10 models from the Atmospheric Chemistry and Climate Model Intercomparison Project (ACCMIP) for 1 year (2000), among which eight models also participated in the CMIP5. They noticed that simulated dust AOD varies by more than a factor of 2 across models. However, this study also did not focus on dust but emphasized the radiative forcings from anthropogenic aerosols.
None of the above studies examined global dust simulation in CMIP5 models. What is more, most studies focused on annual mean, not seasonal averages. It is very possible that models perform better in some seasons than others. The AeroCom intercomparison among multiple dust models was performed on both global and regional scales (Huneeus et al., 2011) but only focused on 1 year; thus the models' capability of simulating interannual or long-term variability in dust is not clear. A comprehensive evaluation of the climatology and interannual variation in global DOD in CMIP5 models will provide insights into models' capability of simulating the integrated aerosol extinction due to dust, which is one of the key variables that determine the radiative forcing of dust to the climate system.
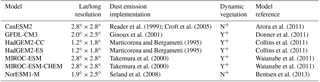
Table 1CMIP5 models used in this study. Models tagged with plus signs (+) included anthropogenic land use and land cover change in their vegetation prediction.
Here we examine the results of seven CMIP5 models (Table 1) by comparing model output with DOD derived from Moderate Resolution Imaging Spectroradiometer (MODIS) Deep Blue aerosol products. Projections on changes of DOD in the late half of the 21st century by CMIP5 models and also by a regression model (Pu and Ginoux, 2017) are examined and analyzed. The following section introduces data and methods used in this study. Results are presented in Sect. 3, including examinations on the climatology and interannual variations in CMIP5 DOD and future projections. Discussion and major conclusions are presented in Sects. 4 and 5, respectively.
2.1 DOD from MODIS
DOD is a widely used variable that describes optical depth due to the extinction by mineral particles. It is one of the key factors (single-scattering albedo and asymmetry factor being the two others) controlling dust interaction with radiation. Monthly DOD values are derived from MODIS aerosol products retrieved using the Deep Blue (MDB2) algorithm, which employs radiance from the blue channels to detect aerosols globally over land even over bright surfaces such as desert (Hsu et al., 2004, 2006). Ginoux et al. (2012b) used collection 5.1 level 2 aerosol products from MODIS aboard the Aqua satellite to derive DOD. Here, both MODIS aerosol products (collection 6, level 2; Hsu et al., 2013) from the Aqua and Terra platforms are used. Aerosol products such as AOD (550 nm), single-scattering albedo, and the Ångström exponent are first interpolated to a regular 0.1∘ by 0.1∘ grid using the algorithm described by Ginoux et al. (2010). The DOD is then derived from AOD following the methods of Ginoux et al. (2012b) with adaptions for the newly released MODIS collection 6 aerosol products (Pu and Ginoux, 2016). To separate dust from other aerosols, we use the Ångström exponent (α) and single-scattering albedo (ω). The Ångström exponent has been shown to be highly sensitive to particle size (Eck et al., 1999). A continuous function relating the Ångström exponent to fine-mode AOD established by Anderson et al. (2005; their Eq. 5) based on ground-based data is used to separate dust from fine particles. We also screen the data by setting single-scattering albedo at 470 nm to be less than 1 for dust due to its absorption of solar radiation. This separates dust from scattering aerosols such as sea salt, which is purely scattering. The formula can be summarized as follows:
Note that DOD represents the coarse-mode fraction of dust only. It is estimated that the fine-mode dust at emission is less than 10 % (Kok et al., 2017).
Aqua and Terra DOD values have previously been used to study global dust sources (Ginoux et al., 2012b) and their geomorphological signature (Baddock et al., 2016) as well as dust variations in the Middle East (Pu and Ginoux, 2016) and the US (Pu and Ginoux, 2017), and they have been validated with AErosol RObotic NETwork (AERONET) stations over the US (Pu and Ginoux, 2017). Here we compare Aqua and Terra DOD against AERONET stations globally (Sect. S1 and Figs. S1, S2 in the Supplement). Both Aqua and Terra DOD values are slightly underestimated, with respective errors of 0.08+0.52 DOD and 0.10+0.48 DOD.
Daily DOD from Aqua and Terra is averaged to monthly data and interpolated to a 1∘ by 1∘ grid. Terra passes the Equator from north to south around 10:30 LT while Aqua passes the Equator from south to north around 13:30 LT. To reduce missing data and also to combine the information from both morning and afternoon hours, a combined monthly DOD (here after MODIS DOD) is derived by averaging Aqua and Terra DOD when both products are available or using either Aqua or Terra DOD when only one product is available. As shown in Fig. S3, the mean available days in each season and also spatial coverage are more enhanced in combined DOD than using Aqua or Terra (not shown) DOD alone. This combined DOD is available from January 2003 to December 2016.
We also compared MODIS DOD climatology with both AERONET observation and DOD retrieved from Cloud-Aerosol Lidar with Orthogonal Polarization (CALIOP; Winker et al., 2004, 2007) aboard the Cloud-Aerosol Lidar and Infrared Pathfinder Satellite Observation (CALIPSO) satellite. AERONET stations provide cloud-screened and quality assured (level 2) coarse-mode aerosol optical depth (COD) at 500 nm, which is processed using the spectral deconvolution algorithm (O'Neill et al., 2003). Only nine sites have long-term COD records during 2003–2016, and the climatological mean of MODIS DOD generally compares well with these sites (Fig. S4).
Table 2List of regions selected to compare model output with MODIS DOD. Locations of these regions are also plotted in Fig. 1b. Acronyms are used for some regions for short, and are listed in the brackets in the first column. Note that the region names such as northern China and India are not exactly the same as their geographical definitions but also cover some areas from nearby countries.
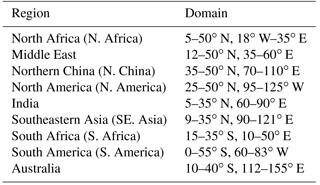
CALIOP measures backscattered radiances attenuated by the presence of aerosols and clouds and retrieves corresponding microphysical and optical properties of aerosols. Monthly dust AOD (or DOD) measurements on a 2∘ latitude by 5∘ longitude grid are available since June 2006. The climatology of CALIOP DOD during 2007–2016 is similar to that of MODIS DOD during the same period (Fig. S5). The global mean (over land) MODIS DOD is slightly higher than that from CALIOP, probably due to the lower horizontal resolution of the latter. The pattern correlations (e.g., Pu et al., 2016) between the two products range from 0.83 in boreal spring and summer to 0.63 in boreal winter (Fig. S5). Due to higher spatial resolution (compared with CALIOP) and coverage (compared with AERONET sites), MODIS DOD is chosen as the primary product to validate CMIP5 model output. Nine regions (Table 2) are selected to study the DOD magnitude, spatial pattern, and variations. These regions cover major dust source regions previously identified (Ginoux et al., 2012).
Given the analysis above (Figs. S3–S5), there are some uncertainties associated with DOD in a few regions in some seasons: (1) relatively low coverage (<30 days per season) over northern China and southeastern Asia in JJA, (2) DOD slightly higher than COD from AERONET over the Arabian Peninsula in DJF and SON, and (3) DOD lower than CALIOP over northern India in MAM. We will consider these uncertainties in the following analysis wherever they are relevant.
2.2 Reanalysis and observation datasets
Previous studies have found that the variations in dust event frequency over the US in the recent decade could be largely represented by the variations in three local controlling factors: seasonal mean surface wind speed, bareness, and precipitation (Pu and Ginoux, 2017). These factors have previously been found to constrain dust emission or variability on multiple timescales (e.g., Gillette and Passi, 1988; Fecan et al., 1999; Zender and Kwon, 2005). While surface wind is positively related to the emission and transport of dust, vegetation is an important non-erodible element that prevents wind erosion. Precipitation is generally negatively related to dust emission and transport processes. While the scavenging effect of precipitation on small dust particles only lasts a few hours or days, influences of precipitation on soil moisture lasts longer.
To examine the interannual variations in DOD and its connection with local controlling factors such as surface wind speed, bareness, and precipitation, monthly data of 10 m wind speed from the ERA-Interim (Dee et al., 2011), leaf area index (LAI) data from Advanced Very High Resolution Radiometer (AVHRR; Claverie et al., 2014, 2016) and precipitation from the Precipitation Reconstruction over Land (PRECL; Chen et al., 2002) are used.
ERA-Interim is a global reanalysis from the European Centre for Medium-Range Weather Forecasts (ECMWF). Its horizontal resolution is T255 (about 0.75∘ or 80 km). We choose this analysis because of its relatively high spatial resolution. The monthly data are available from 1979 to present day.
Monthly LAI derived from version 4 of the Climate Data Record (CDR) of AVHRR is used to calculate surface bareness. The data are produced by the National Aeronautics and Space Administration (NASA) Goddard Space Flight Center (GSFC) and the University of Maryland. Monthly gridded data at a horizontal resolution of 0.05∘ by 0.05∘ are available from 1981 to present. This product is selected due to its high spatial resolution and long temporal coverage. Surface bareness is calculated from seasonal mean LAI (Pu and Ginoux, 2017) as the following:
Bareness is originally defined as exp (−LAI − SAI), where SAI is stem area index (Evans et al., 2016). Since the satellite does not retrieve brownish SAI, we only use LAI to calculate bareness.
PRECL precipitation from the National Oceanic and Atmospheric Administration (NOAA) is a global analysis available monthly from 1948 to present at a 1∘ by 1∘ resolution. The dataset is derived from gauge observations from the Global Historical Climatology Network (GHCN), version 2, and the Climate Anomaly Monitoring System (CAMS) datasets. Its long coverage and spatial resolution are suitable to study the connections between DOD and precipitation.
2.3 CMIP5 model output
Among CMIP5 models we selected seven models (Table 1) that used interactive dust emission schemes, in which dust emission varied in response to changes of climate. The outputs of 10 m wind speed, precipitation, and LAI are also available from these models. In models in which dust is simulated offline, i.e., dust emission did not interactively respond to meteorological and climate changes, the connections between DOD and modeled controlling factors are lost. Other models (to the best of our knowledge) either used offline dust as an input or did not write out the variables needed for this analysis.
Both the historical run from 1861 to 2005 and the future run under the Representative Concentration Pathways 8.5 (RCP8.5) scenario (Riahi et al., 2011) from 2006 to 2100 are used. Here the RCP8.5 scenario is chosen because it represents the upper limit of the projected greenhouse gas change in the 21st century and thus likely is the worst-case scenario for future DOD variation under climate change. Also, studies found that the observed CO2 emission pathway during 2005–2014 matches the RCP8.5 scenario better than other scenarios (e.g., Fuss et al., 2014), which makes the RCP8.5 output suitable to examine present-day DOD variations after 2005.
Monthly model outputs of dust load, surface 10 m wind speed, precipitation, and LAI are used. Historical output from 2003 to 2005 and RCP8.5 output from 2006 to 2016 are combined to form time series and climatology during 2003–2016 to compare with MODIS DOD during the same time period.
2.3.1 DOD derived from modeled dust load
Most CMIP5 models did not save DOD, so we used monthly dust load and converted it to DOD using the relationship derived by Ginoux et al. (2012a) as follows:
where τ is DOD at 500 nm, M is the load of dust in grams per square meter, and e=0.6 m2 g−1 is the mass extinction efficiency. Dust load from different models is first interpolated to a 2∘ by 2.5∘ grid and then converted to DOD. The same method was used by Pu and Ginoux (2017) for the US. Applying the same mass extinction efficiency everywhere and to all the CMIP5 model outputs used here is a simplification, as different models may have quite different mass extinction efficiency. For instance, e can range from 0.25 to 1.28 m2 g−1 in AeroCom models, with a multi-model medium of 0.72 m2 g−1 (Huneeus et al., 2011). Here, we compare the derived DOD with modeled DOD from one historical simulation of the GFDL-CM3 model (Donner et al., 2011) as an example. A full validation of this method will require modeled DOD from all the other CMIP5 models, which are currently not available. The pattern correlations of the climatology (1861–2005) between the derived DOD and modeled DOD in GFDL-CM3 are very high, all above 0.99 for four seasons (not shown). The percentage differences between derived DOD and modeled DOD averaged over global land range from −3.6 % in DJF and SON to 1.3 % in MAM and JJA.
2.4 A linear regression model
2.4.1 Multiple linear regression
In order to examine the relative contribution of each local controlling factor to DOD variations, multiple linear regressions are applied by regressing MODIS DOD onto standardized seasonal mean ERA-Interim surface wind speed, AVHRR bareness, and PRECL precipitation at each grid point. All the data are re-gridded to a 1∘ by 1∘ grid before the calculation. Over regions where values are missing for any of the explanatory variables (i.e., precipitation, bareness, and surface wind speed) or DOD, the regression coefficients are set to missing values. The collinearity among these explanatory variables is examined by calculating the variance inflation factor (VIF) (e.g., O'Brien, 2007; Abudu et al., 2011), and in most regions the VIF is below 2 (not shown), indicating a low collinearity (5–10 is usually considered high). Bootstrap resampling is used to test the significance of the regression coefficients, following the method used by Pu and Ginoux (2017).
Multiple linear regression is also applied to CMIP5-model-derived DOD and outputs of surface wind speed, bareness, and precipitation to obtain regression coefficients from the models from 2004 to 2016. All variables are interpolated to a 2∘ by 2.5∘ grid before regression. The results are compared with regression coefficients derived from observational datasets.
2.4.2 DOD reconstruction and future projection
Using regression coefficients obtained from observations and observed variations in precipitation, bareness, and surface wind speed from 2004 to 2016, we can reconstruct DOD in the present day and compare it with MODIS DOD (see discussion in Sect. 3.2).
Similar to the method used by Pu and Ginoux (2017), the regression coefficients derived from MODIS DOD and observed controlling factors and CMIP5 model output of surface wind speed, bareness, and precipitation are used to project variations in future DOD. The regression coefficients are interpolated from the 1∘ by 1∘ grid to a 2∘ by 2.5∘ grid to be consistent with model output. Such an interpolation may smooth out some spatial characteristics from observations. Here we tried two groups of CMIP5 output for these controlling factors. One group used seven models with an interactive dust emission scheme (Table 1), and the other used 16 CMIP5 models (see Supplement Table S1 of Pu and Ginoux, 2017) that include the seven models with the interactive dust emission scheme. The reason to test the latter is to include as much model output of the controlling factors as possible. The differences between the historical run (1861–2005 average) and that of the RCP8.5 run for the late half of the 21st century (2051–2100) are standardized by the standard deviation of the historical run for each explanatory variable. The projected change reveals how DOD will vary with reference to the historical conditions (mean and standard deviation).
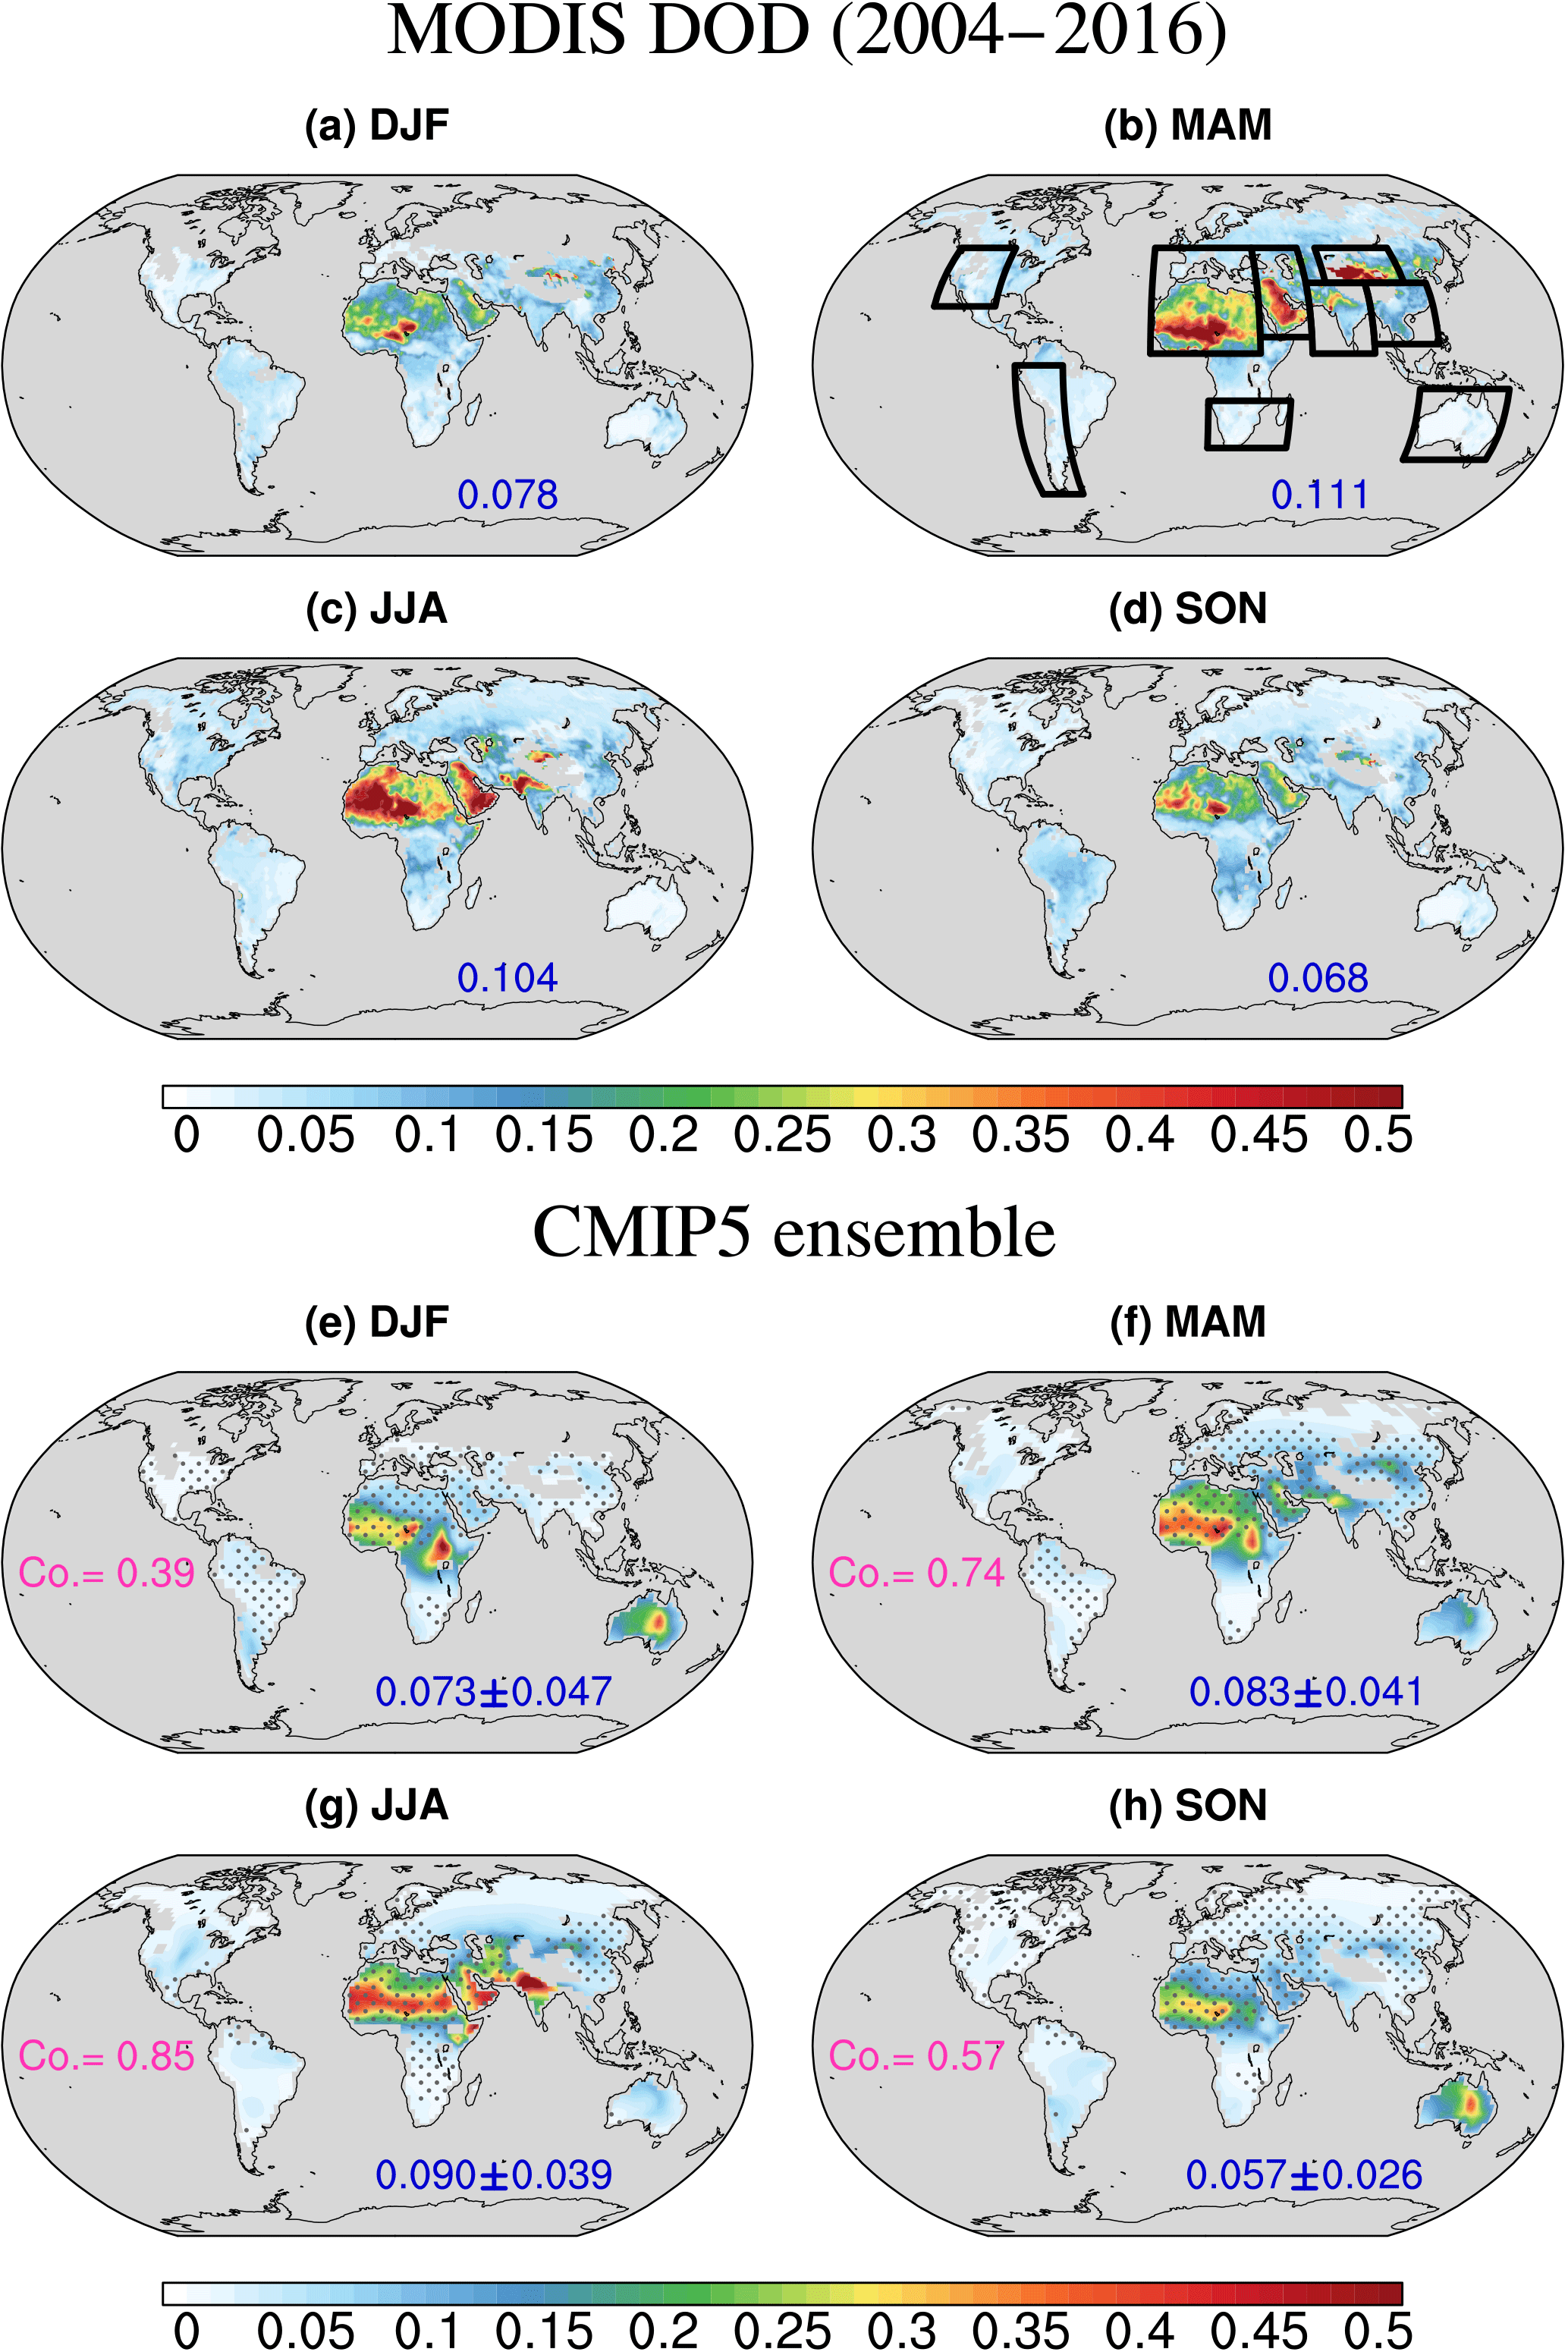
Figure 1Climatology (2004–2016) of Aqua and Terra combined DOD (i.e., MODIS DOD; a–d) and multi-model mean of CMIP5 DOD (e–h) for four seasons. The pattern correlations (centered; calculated after interpolating MODIS DOD to CMIP5 DOD grids) between CMIP5 and MODIS DOD are shown in pink in the bottom panel. Blue numbers denote global mean DOD over land. For CMIP5 model results, ± 1 standard deviation among seven CMIP5 models is also shown. Black boxes in (b) denote nine averaging regions (Table 2). Here we only added these boxes in (b) instead of every plot to keep the figure clean. Note that CMIP5 multi-model mean is masked by MODIS DOD for comparison. The dotted area in (e–h) shows where multi-model mean is greater than 1 inter-model standard deviation.

Figure 2Zonal mean DOD from MODIS (thick red), CMIP5 multi-model mean (thick black), and each individual model (other colorful lines).
3.1 Climatology (2004–2016)
Figure 1 shows the climatology of MODIS DOD (Fig. 1a–d) in four seasons during 2004–2016 and that from the CMIP5 multi-model mean (Fig. 1e–h). Globally, the dustiest regions are largely located over the Northern Hemisphere (NH) over North Africa, the Middle East, and East Asia (Fig. 1a–d). In these regions, DOD is higher in boreal spring and summer than fall and winter. Modeled global DOD over land is generally lower than that from MODIS DOD, ranging from −0.028 (−25.2 %) in MAM to −0.005 (−6.4 %) in DJF. The global spatial pattern is better captured in MAM and JJA, with pattern correlations of 0.74 and 0.85, respectively (Fig. 1f–g). In DJF, DOD is overestimated over central Africa and Australia but underestimated over the Middle East and Asia (Fig. 1e) while in SON there is a similar overestimation in Australia and an underestimation in the Middle East (Fig. 1h).
Figure 2 shows the zonal mean of CMIP5 DOD from individual models (thin colorful lines) and multi-model ensemble mean (thick black), in comparison with MODIS DOD (thick red). In DJF, DOD is underestimated in the NH from 15 to 50∘ N but overestimated over the tropics and Southern Hemisphere (SH) (Fig. 2a). While the overestimation in the SH is largely contributed by three models, the underestimation in the NH appears in all seven models. The overestimation of DOD in HadGEM2-ES has also been identified in a previous study (Bellouin et al., 2011) and will be discussed later. In MAM, a similar overestimation of DOD in the tropics and SH also occurs in some models, and the multi-model mean slightly overestimates DOD around 20–30∘ S (Fig. 2b). In the NH, there is a weak underestimation too, but the overall gradient is largely captured. In JJA, the multi-model mean resembles MODIS DOD very well (Fig. 2c), consistent with the highest pattern correlation in this season shown in Fig. 1. The peak around 19∘ N in North Africa and the Middle East is well captured by the multi-model mean, although the magnitude is slightly underestimated. In SON, different from MODIS DOD that peaks around 19∘ N, the multi-model mean has two peaks around 15∘ N and 28∘ S, a pattern somewhat similar to that in DJF (Fig. 2d). Consequently, DOD in CMIP5 multi-model mean is overestimated at 15–40∘ S and 0–15∘ N but underestimated at 0–15∘ S and 15–40∘ N.

Figure 3Seasonal cycle of DOD in nine regions (Table 2) averaged over 2004–2016. Thick red lines denote MODIS DOD, thick black lines denote CMIP5 multi-model mean, and other colorful lines denote individual model output. The annual means from MODIS DOD (Obs; red) and multi-model mean (Ens; black) are shown in each panel. Note that in (i) MODIS DOD (red line) is scaled 10 times to better display the season cycle.
Seasonal cycles of CMIP5 DOD are compared with MODIS DOD in nine regions in Fig. 3. The annual means of DOD in each region from multi-model mean (black) and MODIS (red) are also listed in each plot. The spread of DOD among individual models is greater during boreal spring and summer for regions in the NH and during austral spring and summer for regions in the SH. Seasonal cycles over North Africa, the Middle East, North America, and India are generally captured by multi-model mean, with modeled DOD peaking during the same seasons as MODIS DOD (Fig. 3a–e). While some models overestimate the seasonal peaks over the Middle East, North America, and India (e.g., CanESM2, HadGEM2-ES, and HadGEM2-CC), a few models have very weak seasonal cycles and underestimate DOD over North America and India (e.g., GFDL-CM3, NorESM1-M, MIROC-ESM, and MIROC-ESM-CHEM). Note that MODIS DOD is slightly lower than CALIOP DOD over India in MAM (Fig. S5); therefore for these models the underestimation may be larger than shown in Fig. 3e.
Since the temporal coverage of MODIS DOD over northern China and southeastern Asia is relatively low in JJA compared with other regions (Fig. S3), we also examined the seasonal cycle of CALIOP DOD (not shown) and results are similar but with weaker magnitude. Over northern China, MODIS DOD peaks in spring (Fig. 3c), consistent with previous studies (e.g., Zhao et al., 2006; Laurent et al., 2006; Ginoux et al., 2012b), while multi-model mean peaks later in May–June. Individual models have quite different seasonal cycles, with the GFDL-CM3 model having a peak (in April) closer to the timing of the MODIS maximum. Similar misrepresentation occurs over the southeastern Asia (Fig. 3f).
In South Africa and South America the observed maxima in early austral spring (i.e., September) are also not captured by the multi-model mean (Fig. 3g–h). Note that CanESM2 largely captures the seasonal cycle of DOD over South America, although the magnitude is overestimated (Fig. 3h). In Australia, DOD is largely overestimated and the peak from November to January in MODIS DOD is shifted about 1 month earlier in the multi-model mean (Fig. 3i). Similar to the finding here, Bellouin et al. (2011) also found that the HadGEM2-ES model overestimated DOD over Australia and the Thar Desert region in northwestern India and suggested that these overestimations were likely due to the model's overestimation of bare soil fraction and underestimation of soil moisture. Despite overestimation, the seasonal cycle in the HadGEM2-CC model is more similar to MODIS DOD than other models (Fig. 3i).
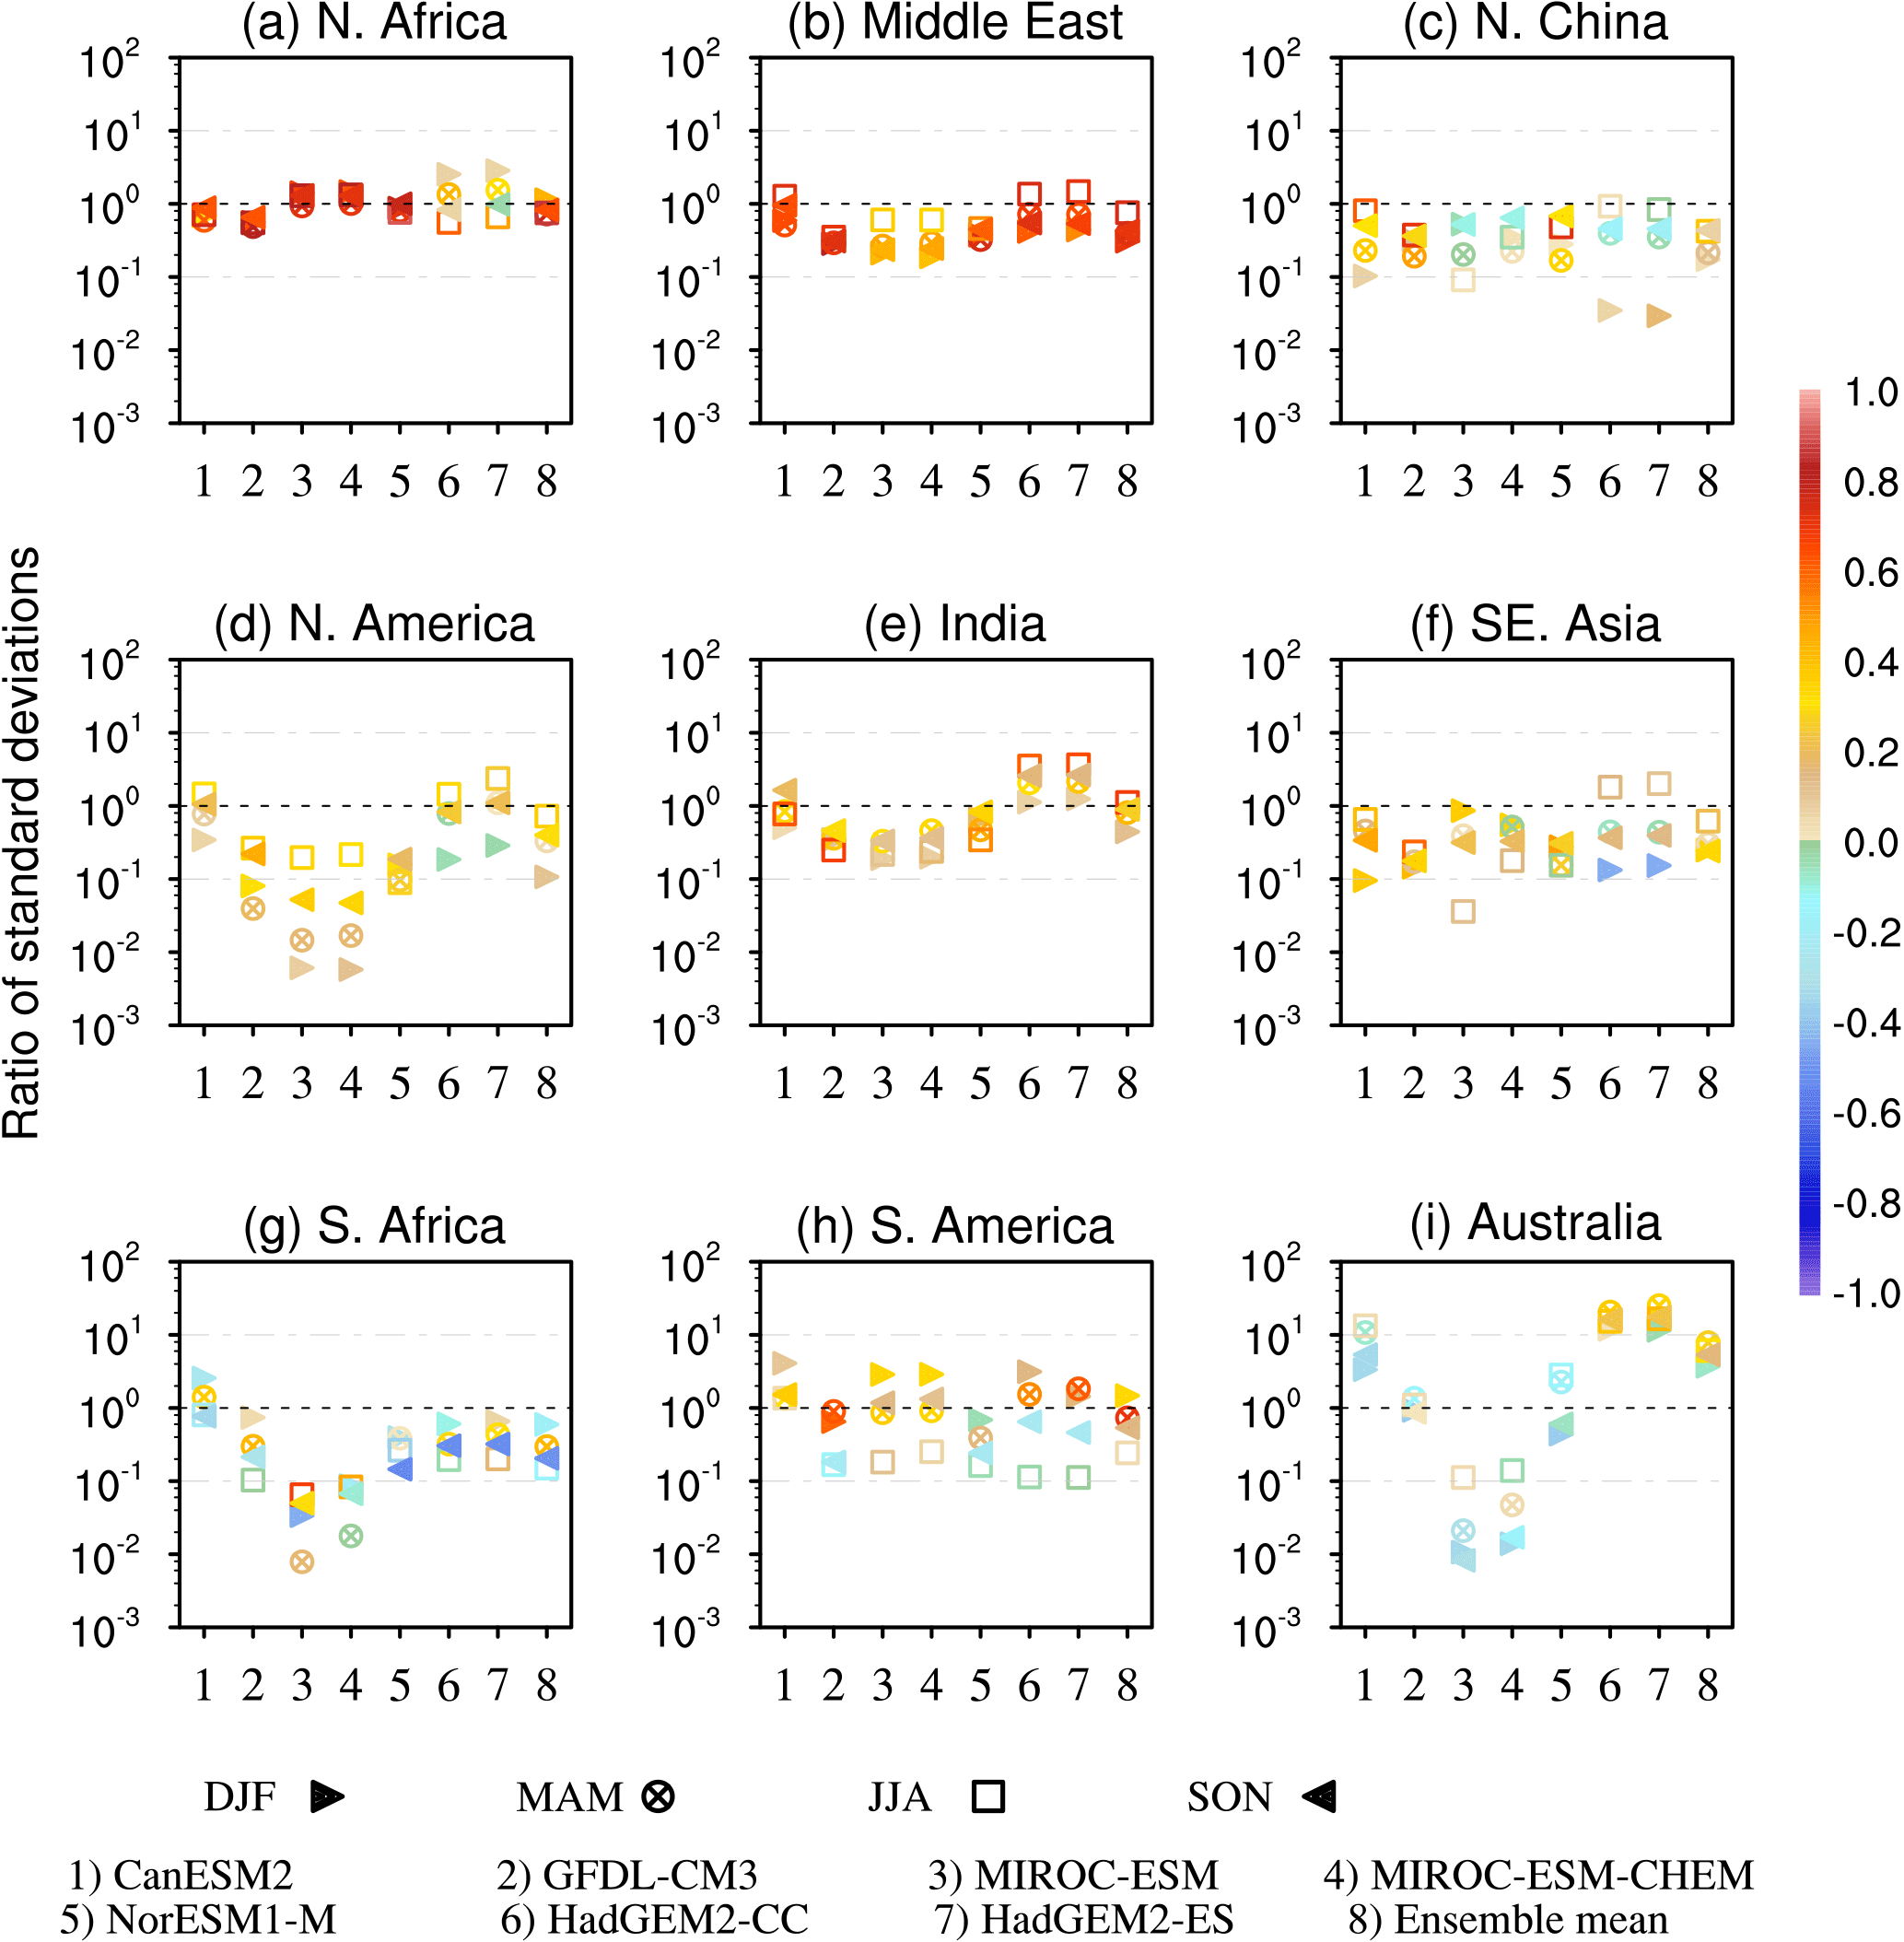
Figure 4Spatial statistics comparing DOD from CMIP5 models with that from MODIS in nine regions. Label on the x axis shows individual models (1–7) and multi-model mean (8). y axis shows the ratio of pattern standard deviations between model climatology (2004–2016) and that of MODIS, which reveals the relative amplitude of the simulated DOD versus satellite DOD. The color denotes pattern correlation (centered) between each model and MODIS DOD in each region.
We further examine the magnitudes and spatial patterns of CMIP5 DOD in these regions. Figure 4 shows the ratio of pattern standard deviations (standard deviations of values within the domain) and pattern correlation between CMIP5 DOD and MODIS DOD climatology (2004–2016) in each region for four seasons. While the former reveals the magnitude differences, the latter demonstrates the spatial resemblance.
Over North Africa, the Middle East, and India, the ratio of CMIP5 DOD from individual models and multi-model mean versus MODIS DOD are all within ± 1 order of magnitude (Fig. 4). Most models underestimate DOD in northern China, although the magnitudes are largely within the range of −1 order of magnitude to 1. Over North America, South Africa, and Australia, some models underestimate the DOD by more than 2 orders of magnitude, while over Australia three models overestimate DOD by more than 1 order of magnitude. In general, magnitudes of multi-model mean are closer to satellite DOD than most individual models and are largely within ± 1 order of magnitude of MODIS DOD.
The spatial patterns are better captured over North Africa and the Middle East than other regions (Fig. 4), with pattern correlations above 0.6 in most models (with the highest pattern correlations of 0.92 and 0.83). Pattern correlations from multi-model mean are also high, reaching 0.87 (0.78) over North Africa and 0.75 (0.73) over the Middle East in JJA (MAM). Nonetheless, some models show negative pattern correlations over North Africa, northern China, North America, southeastern Asia, South Africa, South America, and Australia. Overall, spatial patterns are less well represented in regions over the SH than over the NH in CMIP5 models.
In short, in terms of both magnitudes and spatial pattern, DOD climatology is best represented over North Africa and the Middle East among the nine regions. The multi-model mean shows that DOD over North Africa is slightly better simulated than over the Middle East, somewhat similar to the finding of the AeroCom multi-model analysis (Huneeus et al., 2011).
3.2 Interannual variations
An important aspect of dust activity is its long-term variability, including interannual and decadal variations. Dust emission in North Africa is known to have strong decadal variations (e.g., Prospero and Nees, 1986; Prospero and Lamb, 2003; Mahowald et al., 2010; Evan et al., 2014, 2016), while over Australia, strong interannual variations have been related to El Niño–Southern Oscillation (e.g., Marx et al., 2009; Evans et al., 2016). Due to the short time coverage of high-quality satellite products, we focus on interannual variations in DOD from 2004 to 2016.
Figure 5 shows the correlations of regional mean time series of DOD between MODIS and CMIP5 models and multi-model mean for each season in nine regions. We also show correlations between the reconstructed DOD (see Sect. 2.4.2 for details) and MODIS DOD for reference (Table S1). The reconstructed DOD is calculated using observed regression coefficients and time-varying controlling factors from observations (i.e., surface wind speed, bareness, and precipitation).
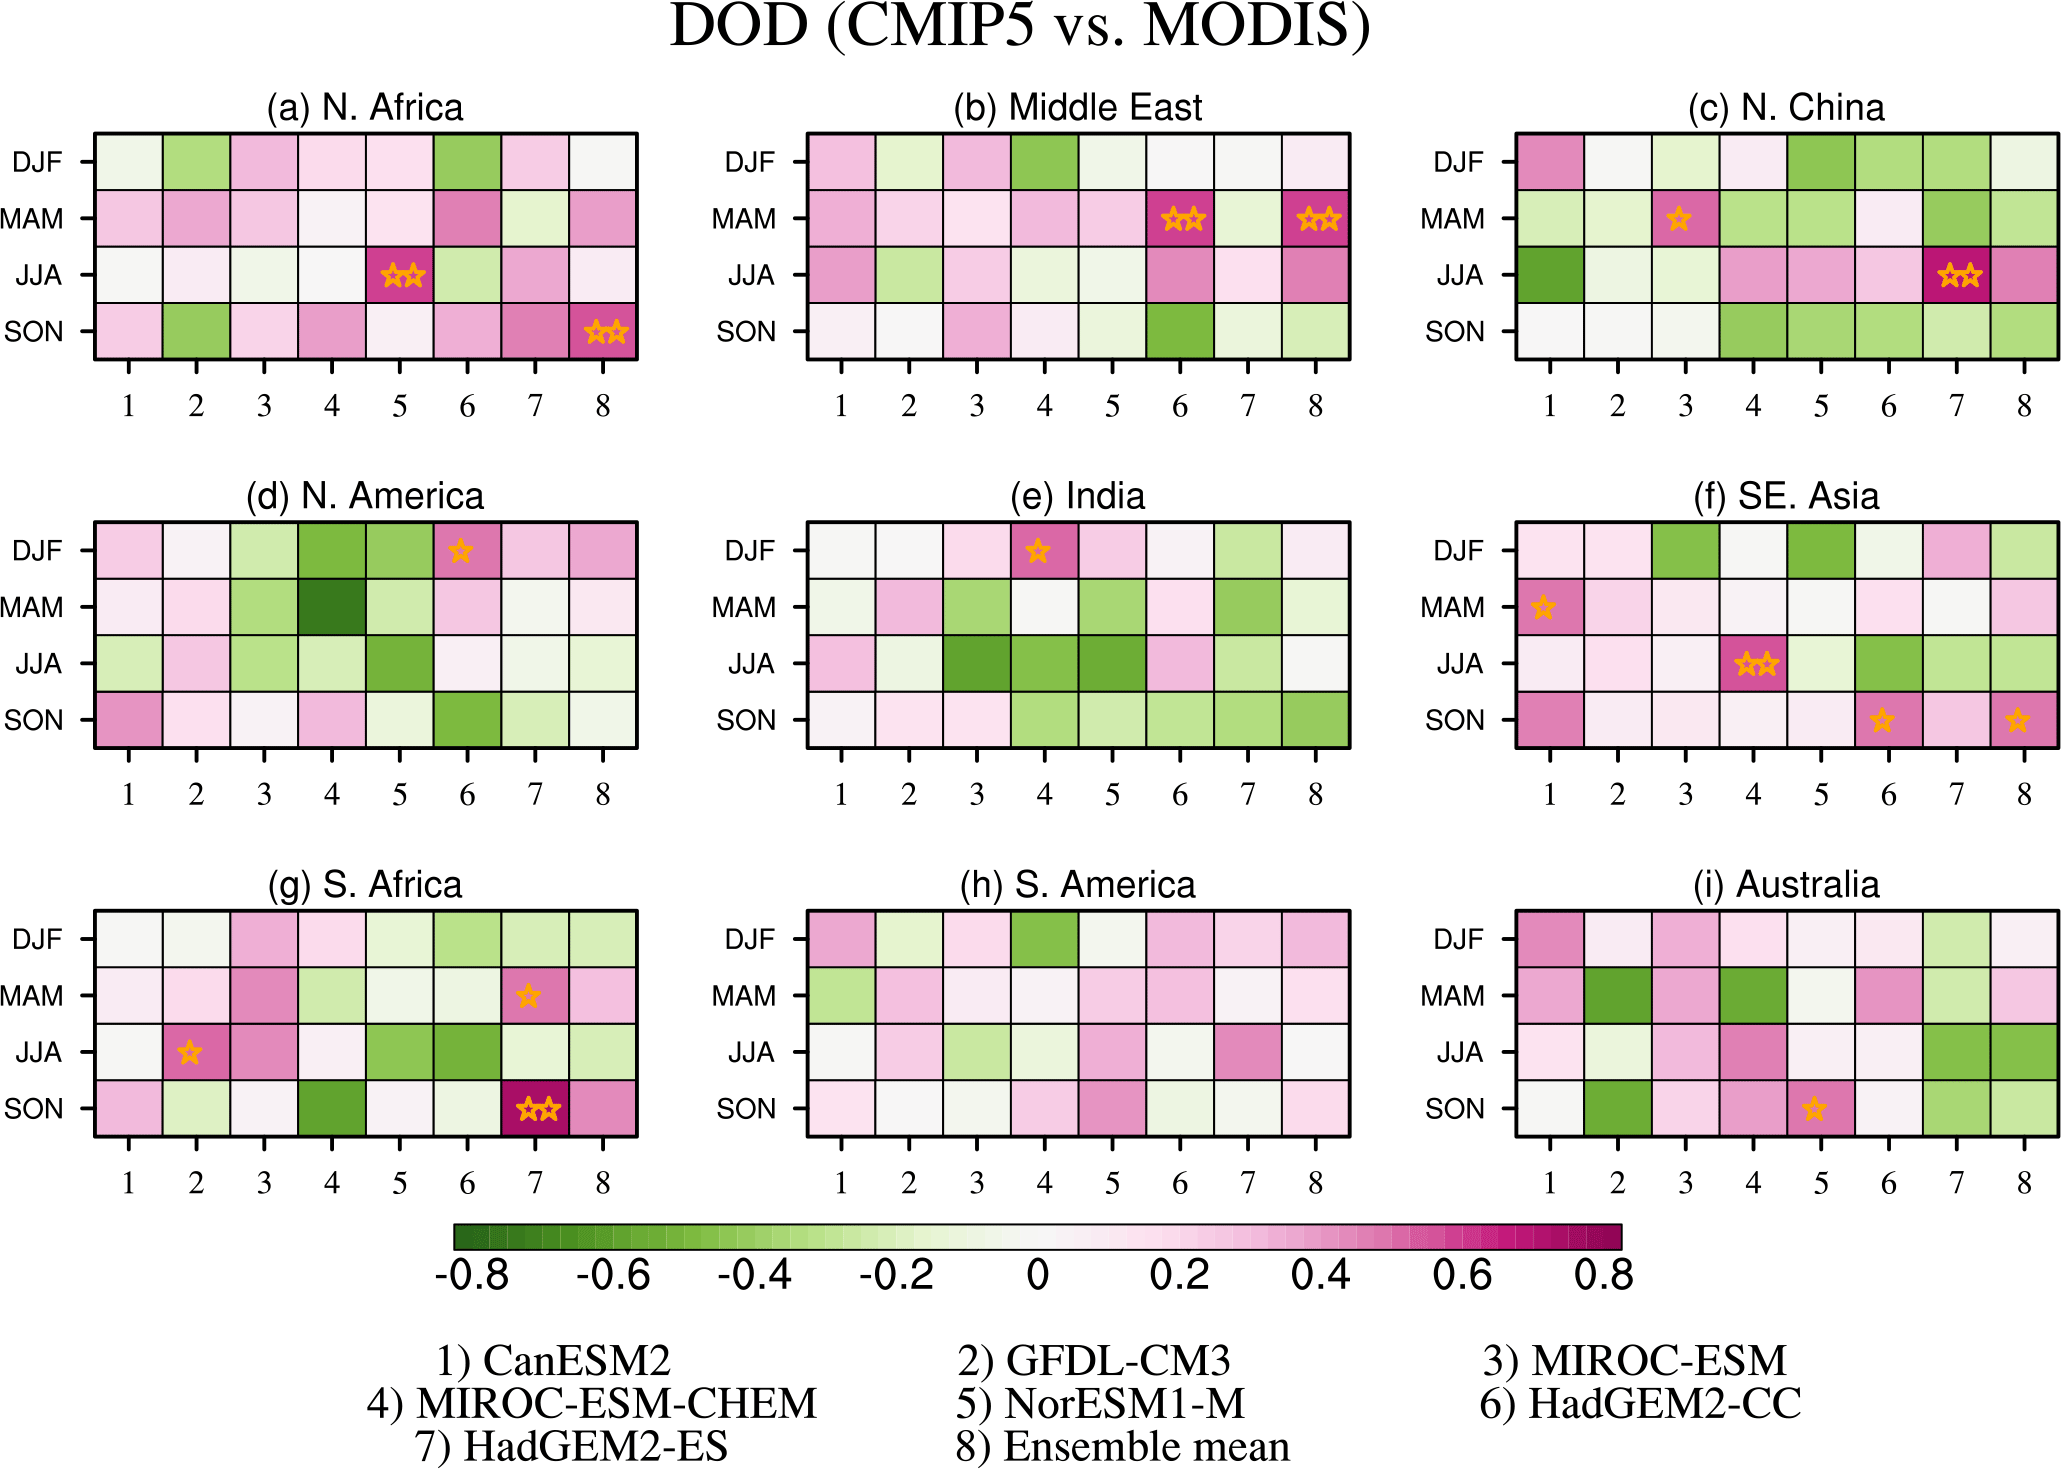
Figure 5Correlations (color) between regional averaged time series from CMIP5 DOD and MODIS DOD from 2004 to 2016 for four seasons. Numbers on the x axis denote each model (1–7) and multi-model mean (8). Correlations significant at the 90 % confidence level are marked by a star and significance at the 95 % confidence level by two stars.
The interannual variations in DOD are in general not well captured by CMIP5 models. This is consistent with a previous study by Evan et al. (2014), who found dust variability downwind of North Africa over the northeastern Atlantic was misrepresented in CMIP5 models. In most regions, only one or two models show significant positive correlation with MODIS DOD in some seasons, and negative correlations exist in all regions (Fig. 5). North Africa, the Middle East, southeastern Asia, South America, and Australia show fewer negative correlations than other dusty regions. Conversely, reconstructed DOD shows significant positive correlations with MODIS DOD over most regions in all seasons (Table S1). This suggests that the interannual variations in DOD can be largely attributed to the variations in these controlling factors, and models may misrepresent these relationships, in addition to their incapacity to capture the interannual variations in individual controlling factors in general (not shown), which is not uncommon for coupled models.
We further examine the connection between those controlling factors and DOD in CMIP5 models. Figure 6 shows the dominant controlling factors among the three (surface wind speed, bareness, and precipitation) on DOD variations in four seasons from MODIS (left column) and from CMIP5 multi-model mean (right column). To highlight factors controlling DOD variations near the dust source regions, a mask of AVHRR LAI ≤0.5 is applied to both coefficients.
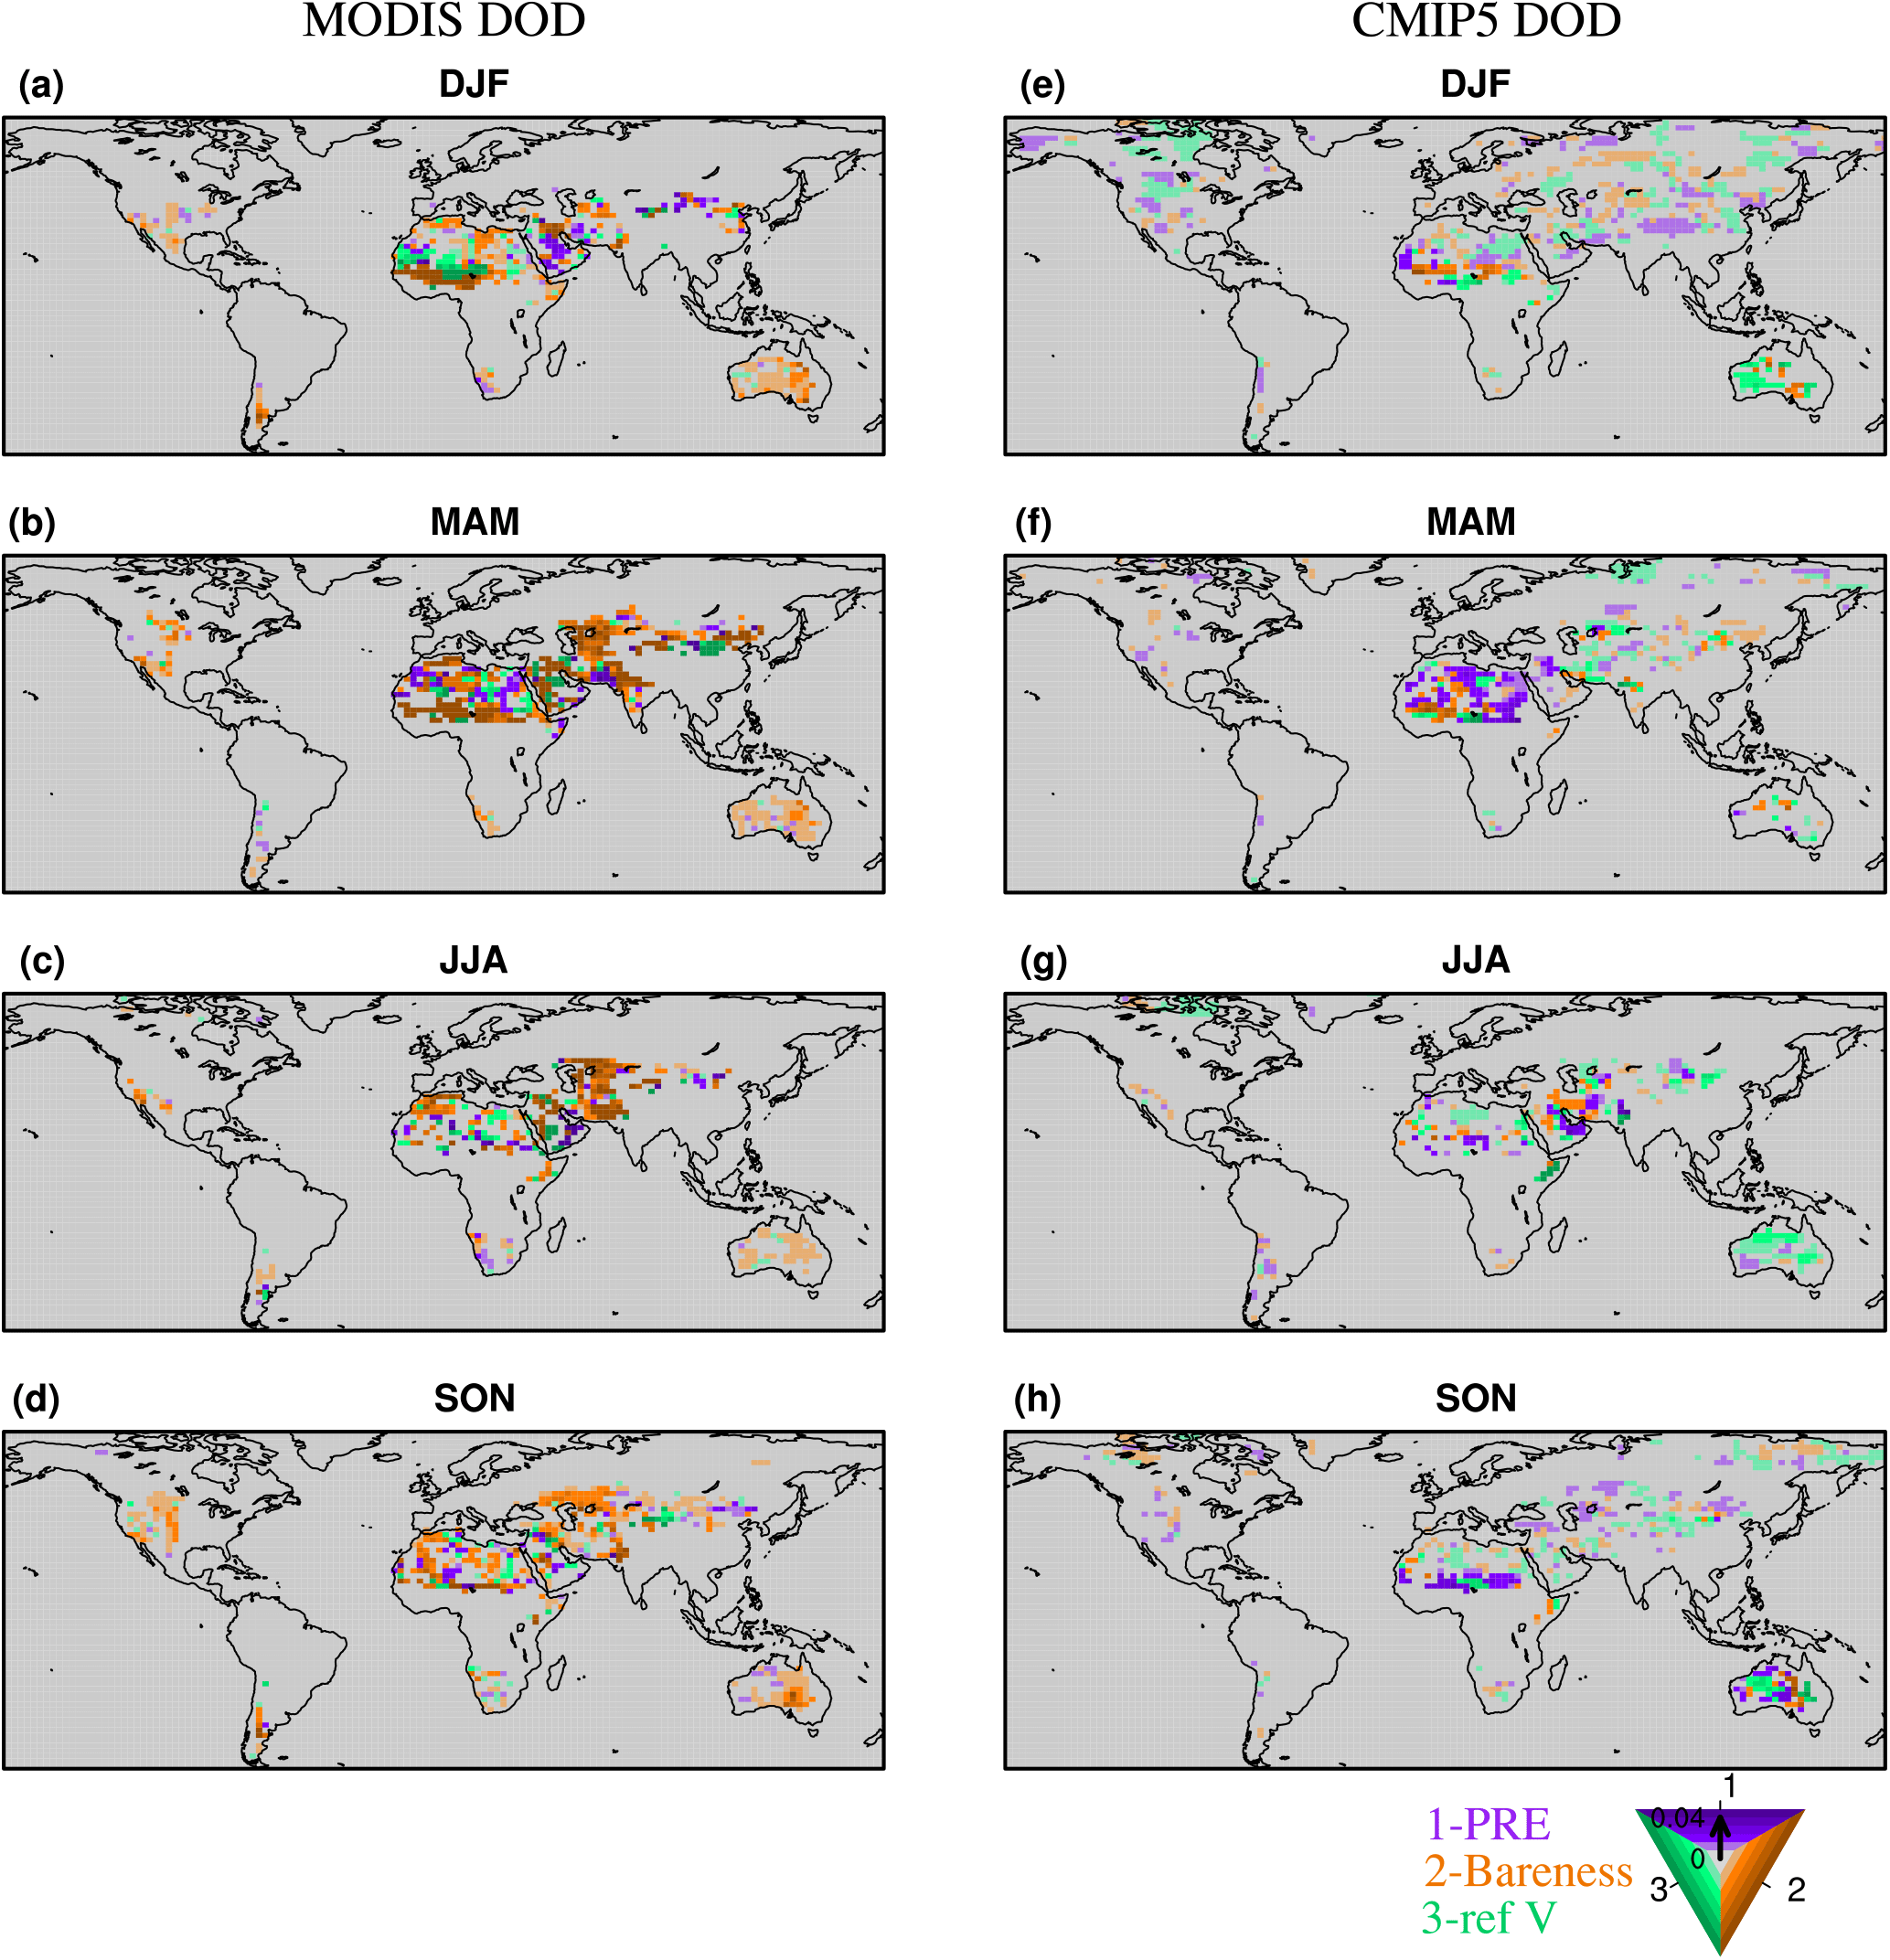
Figure 6Regression coefficients calculated by regressing DOD in each season onto standardized precipitation (purple), bareness (orange), and surface wind speed (green) from 2004 to 2016. Coefficients obtained using MODIS DOD and observed controlling factors (interpolated to a 2∘ by 2.5∘ grid) and those using CMIP5 multi-model mean DOD and controlling factors are shown in the left and right columns, respectively. The color of the shading denotes the largest coefficient in absolute value among the three, while the saturation of the color shows the magnitude of the coefficient (from 0 to 0.02). Only regression coefficients significant at the 90 % confidence level (bootstrap test) are shown. Missing values are shaded in grey. To highlight coefficients near the source regions, a mask of LAI ≤0.5 is applied.
Bareness plays the most important role in many dusty regions in observations, e.g., over Australia, the central US, and South America (Fig. 6a–d). Note that while bareness plays an important role over the Sahel during DJF and MAM, it also shows strong signal over some areas in northern North Africa (Fig. 6a–b). The reliability of this information is limited by the accuracy of LAI retrieval in these areas. The value of bareness in this region is actually quite high (as LAI is very low), but still has weak interannual variability (Fig. S6). Over some areas of North and South Africa, the Middle East, and East Asia, surface wind and precipitation are also quite important.
The role of bareness is largely underestimated in CMIP5 models while surface wind and precipitation become the dominant factors (Fig. 6e–h). The misrepresentation of the connection between DOD and these controlling factors may cause the misrepresentation of the dust load and its variability. Taking Australia for an example, the overestimation of DOD magnitudes may be related to an overestimation of the influence of surface wind on DOD and a lack of constraints from surface bareness.
Despite the large differences between the observed and modeled connections between DOD and the controlling factors, some regions show similarities. For instance, over North Africa in DJF, both show an important influence from surface winds (Fig. 6a, e), although the locations of surface-wind-dominant areas are not exactly the same. Evan et al. (2016) also found a dominant role of surface wind in African dust variability, but they focused on monthly means not seasonal averages. In MAM, precipitation starts to play a role in some parts of North Africa while surface wind still dominates in some areas (Fig. 6b). The same increasing influence of precipitation is shown in the multi-model mean, but such an influence seems overestimated (Fig. 6f). In JJA, the influences of precipitation and bareness over the eastern Arabian Peninsula in the multi-model mean (Fig. 6g) also show some similarity to observation (Fig. 6c), although an underestimation of the influence from bareness and an overestimation of precipitation are still there.
Also, note that in CMIP5 models, due to a lack of constraints from low surface temperature (e.g., over frozen land) and snow cover on dust emission or misrepresentations of dust transport, DOD and also the regression coefficients still exist over NH high latitudes in boreal winter and spring in the multi-model mean (Fig. 6e–f).

Figure 7Projected changes of DOD in the late half of the 21st century (under the RCP8.5 scenario) from that in the historical level (1861–2005) by the CMIP5 multi-model mean for four seasons. The percentage change of global mean (over land) DOD ± 1 inter-model standard deviation is shown at the bottom of each plot. Areas with sign agreement among the models reaching 71.4 % (i.e., at least five out of seven models have the same sign as the multi-model mean) are dotted.
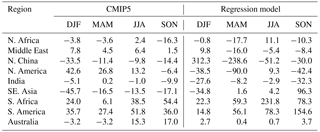
Table 3Changes of DOD in the late half of the 21st century (2051–2100; RCP8.5 scenario) from the historical condition (1861–2005) projected by the CMIP5 multi-model mean (second to fifth columns) and the regression model (sixth to ninth columns) in nine regions. Changes of DOD are shown as a percentage with reference to CMIP5 multi-model historical run. Note that in some regions the projected change by the regression model is quite large (i.e., greater than ±100 %), largely due to the underestimation of CMIP5 historical run in these regions.
3.3 Future projections
How will DOD change in response to increasing greenhouse gases? The results from the CMIP5 multi-model mean are shown in Fig. 7. We compare the DOD during the late half of the 21st century under the RCP8.5 scenario with that in the historical level (1861–2005 average).
Over land, the CMIP5 model projects a decrease in global mean DOD in all seasons except JJA (Fig. 7a–d). The inter-model standard deviation is much greater than the multi-model mean, suggesting large discrepancies among individual models. The projected decrease is largely over northern North America, southern North Africa, eastern central Africa, and East Asia while the increase is largely over northern North Africa, the Middle East, southern North America, South Africa, South America, and southern Australia (Fig. 7). Regional means of DOD change (as a percentage) with reference to the CMIP5 historical run are summarized in Table 3.
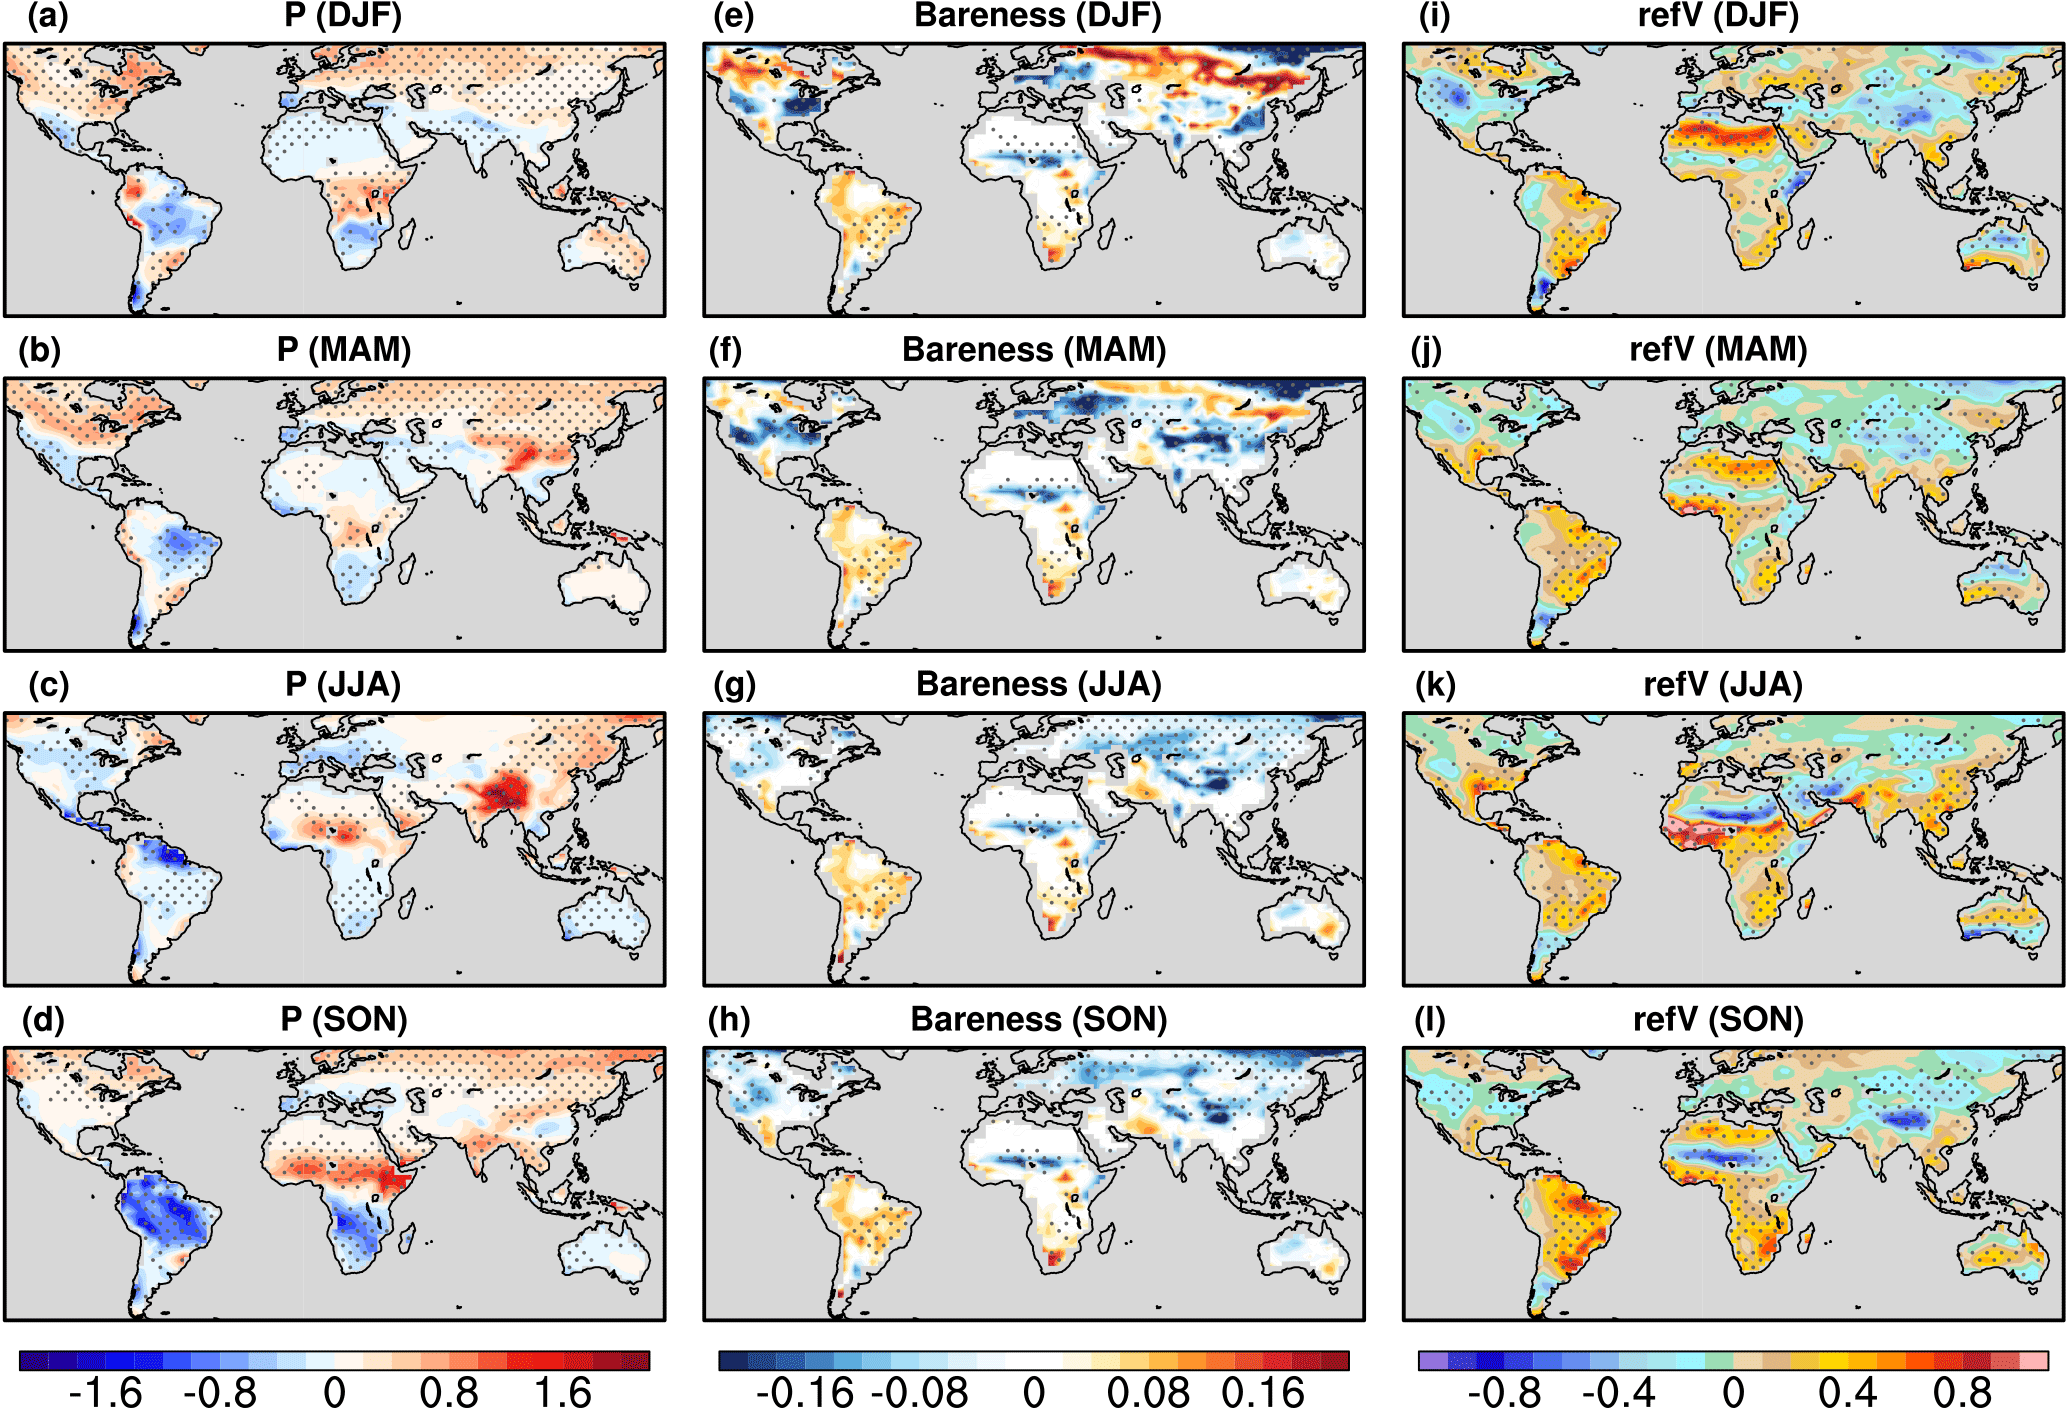
Figure 8Projected difference of (a–d) precipitation (mm d−1), (e–h) bareness, and (i–l) 10 m wind (m s−1) between the late half of the 21st century (2051–2100; RCP8.5 scenario) and historical levels (1861–2005) from the multi-model mean of seven CMIP5 models. Areas with sign agreement among the models reaching 71.4 % (i.e., at least five out of seven models have the same sign as the multi-model mean) are dotted.
What might be the causes of DOD change? Figure 8 shows the projected change of precipitation, bareness, and surface wind speed from CMIP5 multi-model mean. These factors play an important role in DOD variations in the present day, although models tend to underestimate the role of bareness and overestimate the influences of precipitation and surface wind (Fig. 6). Increases in precipitation can increase soil moisture and remove airborne dust, thus usually favoring a decrease in DOD. As shown in Fig. 8a–d, the increases in precipitation in northern Eurasia, northern North America, the Congo basin in Africa, and Australia (DJF and MAM) may contribute to the decrease in DOD in these regions, while the decreases in precipitation over northern North Africa and the Middle East (DJF and MAM), South Africa, and South America may contribute to the increase in DOD (DJF-SON). Also note that in JJA both precipitation and DOD increase over northern North Africa and the Middle East (Fig. 8c), suggesting other factors dominate the variation in DOD in the multi-model mean.
A decrease (increase) in bareness indicates a growth (decay) of vegetation and is usually associated with a decrease (increase) in DOD. In general, except regions such as southern North America, South America, South Africa, part of northern Eurasia, and central Sahel, the pattern of bareness change does not resemble DOD change (Fig. 8e–h). This is probably due to the fact that the overall influence of bareness on DOD variation is underestimated in CMIP5 models (Fig. 6).
Increases in surface wind can enhance dust emission and transport, and vice versa. The changes of surface wind in DJF and MAM are similar and likely to contribute to the increase in DOD over northern North Africa, the Middle East, eastern South America, southern South Africa, and southern Australia (Fig. 8i–j). The decrease in DOD over northwestern North America, the Sahel, and northern Australia may also relate to the decrease in surface wind there, in addition to an increase in precipitation and a reduction of bareness. In JJA and SON (Fig. 8k–l), the increases in surface wind in South America, South Africa, and central Australia and the decreases in wind in northwestern North America, northern Eurasia, and the central Sahel are also consistent with patterns of DOD change.
In short, variations in CMIP5 DOD in the late half of the 21st century are more consistent with changes of precipitation and surface wind speed than with surface bareness, consistent with the analysis above regarding the present-day condition.
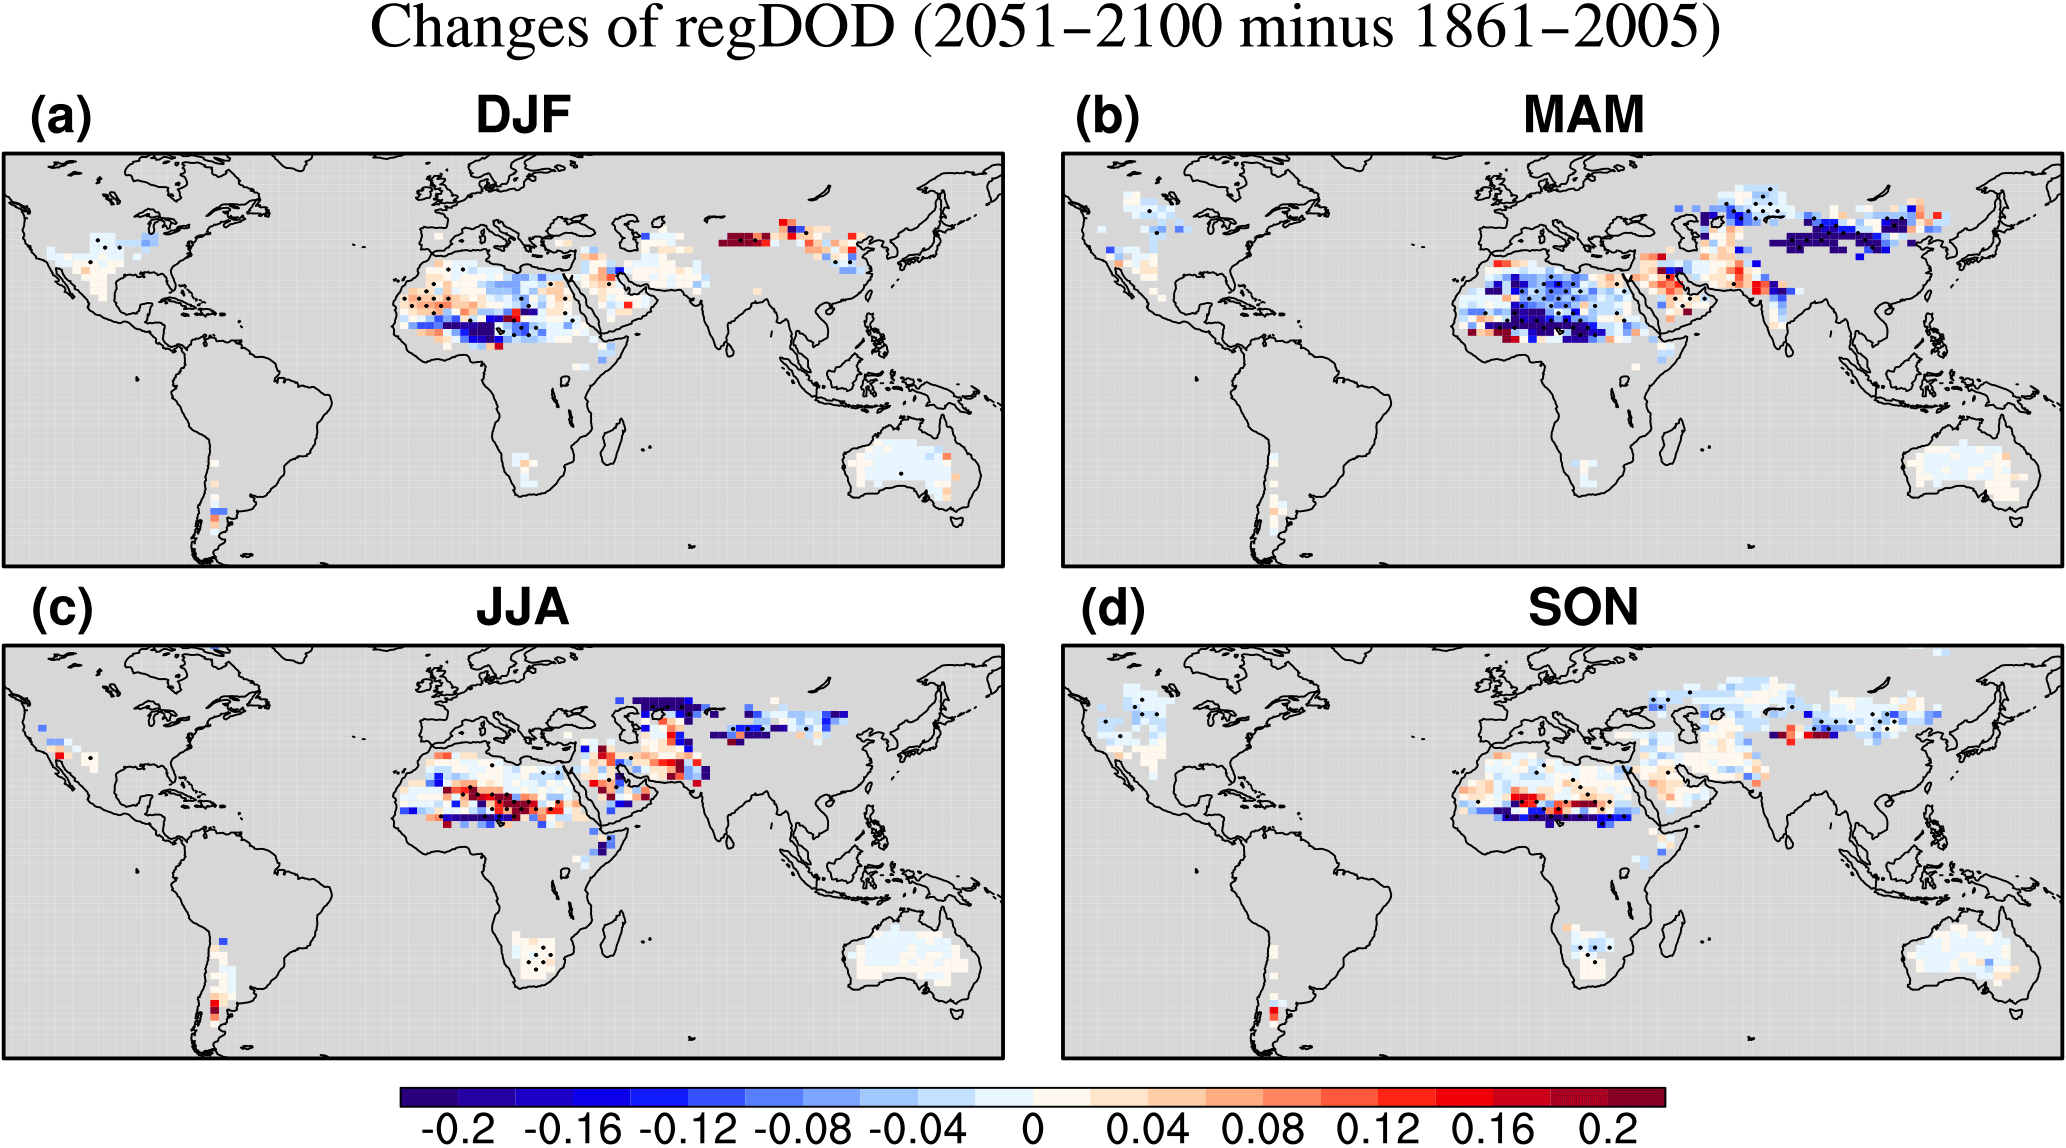
Figure 9Projected change of DOD in the late half of the 21st century under the RCP8.5 scenario by the regression model. The results are calculated using the regression coefficients obtained from observations during 2004–2016 (see Sect. 2) and projected changes of precipitation, bareness, and surface wind from seven CMIP5 models. Dotted areas are regions with sign agreement among the regression projections (using output of each of the seven models) above 71.4 % (i.e., at least five out of seven regression projections have the same sign as the multi-model mean projection). To highlight DOD variations near the source regions, a mask of LAI ≤0.5 (from present-day climatology) is applied.
Here we also present the projected change of DOD from the regression model in Fig. 9. The regression model (see Sect. 2.4 for details) is developed based on observed relationships between MODIS DOD and local controlling factors and can largely capture the interannual variations in DOD in the present-day climate (Table S1). Assuming that the observed connection between DOD and these controlling factors does not change dramatically in the future, we can use this regression model and CMIP5-model-projected change of controlling factors to project DOD variations. Compared to DOD projection from CMIP5 models, this approach additionally utilizes observational constraints and is likely to provide a more reliable future projection. We use projected changes of precipitation, bareness, and surface wind speed from seven CMIP5 models with an interactive dust emission scheme (see methodology). A similar method is applied to the model output from 16 CMIP5 models, and results are similar (Fig. S7). A mask of present-day LAI ≤0.5 is also applied to highlight the changes of DOD near dust source regions. By doing this, we assume the location of major dust sources will not change much in the late half of the 21st century. The unmasked figure is presented in the Supplement (Fig. S8). The reason we did not use the projected future LAI as a mask is that there are large uncertainties associated with LAI projection, especially over NH subtropical regions (e.g., Fig. 8e–h).
In DJF, change of DOD over Mexico, North Africa, the Middle East and part of northern China (Fig. 9a) projected by the regression model is similar to that projected by CMIP5 models over those dust source regions (Fig. 7a), but with a greater magnitude. In MAM, a decrease in DOD is projected over a large area of North Africa (Fig. 9b), which is different from the pattern projected from the CMIP5 multi-model mean (Fig. 7b). The decrease in DOD over the northern central US is also different from the overall increase projected by CMIP5 DOD. However, the increase in DOD over the Middle East and the decrease in DOD over northern China are similar to that of CMIP5 DOD. During JJA and SON, DOD decreases over the Sahel and northern China but increases over a belt to the north of the central Sahel and parts of the Middle East (Fig. 9c–d). The weak increase in DOD over the southern corner of South Africa in JJA and a slight decrease in SON also have high agreement among the regression projections (dotted areas in Fig. 9c–d). Changes of DOD over Australia are very small in all seasons and show little consistency among the regression projections.
The regression model projection using 16-model output shows very similar patterns (Fig. S7), largely because the projected changes of precipitation, surface wind speed, and bareness from the 16-model ensemble mean are similar to those from the seven-model ensemble mean in dusty regions (Fig. S9). But there are also some discrepancies in terms of magnitude and pattern that are revealed in the projected DOD patterns, e.g., the projected reduction of DOD is greater and more widespread over northern Asia in MAM if using the 16-model output and the increase in DOD along the southern edge of the Sahara is weaker in JJA and SON (Fig. S7 vs. Fig. 9).
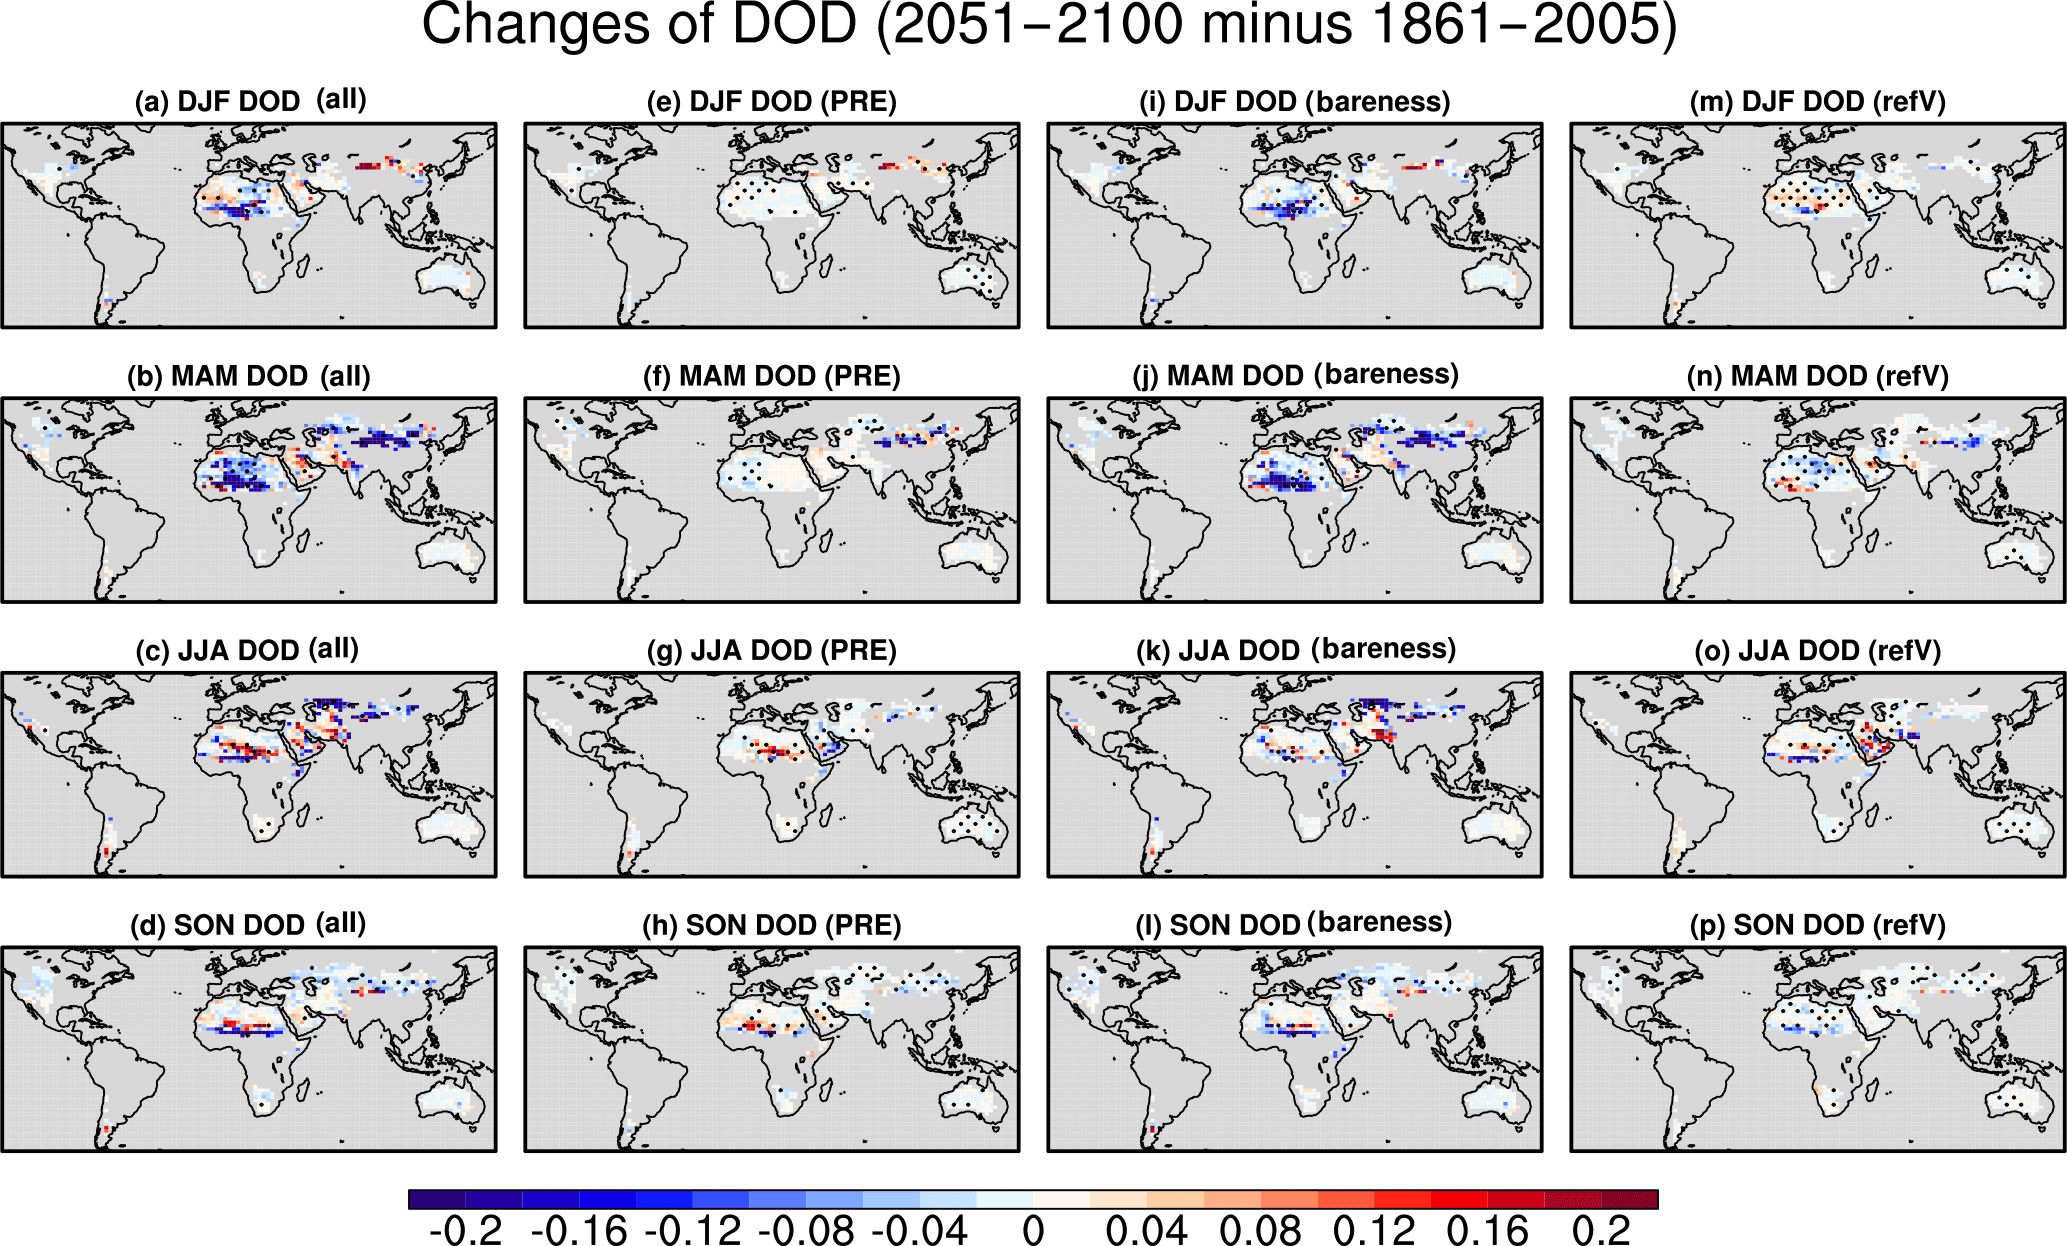
Figure 10(a–d) Projected change of DOD in the late half of the 21st century under the RCP8.5 scenario by the regression model and output from seven CMIP5 models (same as Fig. 9), as well as contributions from each component, (e–h) precipitation, (j–i) bareness, and (m–p) surface wind speed. Dotted areas are regions with sign agreement above 71.4 % among the models. To highlight DOD variations near the source regions, a mask of LAI ≤0.5 (from present-day climatology) is applied.
The contribution of each controlling factor to the total DOD change is shown in Fig. 10. While changes of bareness over North Africa and northern China play an important role in DOD change, changes of precipitation, e.g., over northwestern China in MAM, and surface wind, e.g., over northern North Africa and the Middle East in DJF and MAM, also play vital roles.
Both projections from the CMIP5 models and those from the regression model have some uncertainties. The reliability of future projections by CMIP5 models is limited by models' capability of capturing present-day climatology and the observed connection between DOD and local controlling factors. As discussed earlier, the overall performance of models is better in those very dusty regions in the NH, such as North Africa and the Middle East, than other regions. The multi-model mean also overestimates the connection among DOD, precipitation, and surface wind and underestimates the influence of bareness in the present (Fig. 6), which can cast doubts on the projected variation in DOD in response to climate change.
The uncertainties associated with the regression model are twofold. First, there are uncertainties associated with the regression model itself. Since the regression coefficients are derived from observed relationships between DOD and controlling factors in a relatively short time period, factors controlling the low-frequency variation in DOD (e.g., decadal variations) may not be included. Other meteorological factors that could play an important role in regional dust variability, e.g., nocturnal low-level jets (e.g., Todd et al., 2008; Fiedler et al., 2013, 2016) and haboobs over Africa (e.g., Ashpole and Washington, 2013), are not directly considered in the model. The influences of anthropogenic land use and land cover change are also not included in the regression model. Anthropogenic land use and land cover change has been found to play an important role in long-term dust variability in some regions (e.g., Neff et al., 2005, 2008; Moulin and Chiapello, 2006; McConnell et al., 2007), although previous modeling studies found its influences on future dust emissions to be minor compared to climate change (Tegen et al., 2004). Thus the projection made by the regression model only reveals the change of DOD in association with climate change. Second, uncertainties associated with model-projected change of controlling factors, such as bareness in the US in JJA as pointed out by Pu and Ginoux (2017), also limit the accuracy of the results.
Despite these uncertainties, both methods make similar projections, particularly in some dusty regions: for instance, the DOD pattern over North Africa in DJF and JJA, an increase in DOD in the central Arabian Peninsula in all seasons, and a decrease in DOD over northern China from MAM to SON (Figs. 7, 9).
We examined DOD in seven CMIP5 models with interactive dust emission schemes. Other important variables that influence the radiative property of dust, such as the Angström exponent and single-scattering albedo, are also worth further examination, if these variables are archived. A better quantification of the radiative forcing of dust may also require an examination of the size distribution of dust particles, as studies (e.g., Kok et al., 2017) found that in current AeroCom models the fraction of coarse dust particles was underestimated and so was the warming effect of dust. Whether this is the case in the CMIP5 models is not clear.
Also note that since DOD is an integrated variable, it does not reflect the vertical distribution of dust aerosols. As pointed out by Huneeus et al. (2016), dust models with similar performance in simulating AOD may have quite large differences in simulating vertical distribution, emission, deposition, and surface concentration of dust. An overall evaluation of dust modeling capability will require detailed examination of these variables and the life cycle of dust in CMIP5 models in addition to DOD.
Early studies on future dust projection used offline dust models driven by climate model output under different scenarios. For instance, Mahowald and Luo (2003) used an offline dust model and output from the National Center of Atmospheric Research's coupled Climate System Model (CSM) 1.0 (Boville and Gent, 1998) under the A1 scenario (Houghton et al., 2001) and projected a decrease in dust emissions by the end of the 21st century by −20 % to −63 %, depending on different scenarios. In general, when they included vegetation change, the projected dust reduction became greater, but including land use change slightly weakened such reduction. Similarly, Tegen et al. (2004) used output from ECHAM4, HadCM3, and a dust model (Tegen et al., 2002) to examine the change of dust emission by 2040–2050 and 2070–2080 and found results were model and scenario dependent, from −26 % to 10 %. However, including anthropogenic cultivation practices tended to increase dust emission in both models. They also pointed out that such an influence from anthropogenic land use was not big enough to overcome the effect of climate change.
The interactive dust emission schemes and new generations of climate models used in CMIP5 are likely to provide more reliable projections, but this may also depend on how changes of dust and its radiative forcing are fed back to the climate system in the models. While these projections are largely model dependent, based on our analysis on the DOD climatology in CMIP5 models, the multi-model mean has a better chance to provide a more reliable projection than individual models.
Here a regression model combined with MODIS DOD is used to identify key local factors that control the variation in DOD on the interannual timescale. The results are then compared with model output to examine models' capability of capturing observed connections between DOD and controlling factors. This method may be applied to other dust model intercomparison projects as well, such as AeroCom (Huneeus et al., 2011), to help examine model performance.
Dust aerosol plays an important role in the climate system by directly scattering and absorbing solar and longwave radiation and indirectly affecting the formation and radiative properties of cloud. It is thus very important to understand how well dust is simulated in the state-of-the-art climate models. While many features and variables are systematically examined in the CMIP5 multi-model output, we found that to the best of our knowledge an evaluation of global dust modeling in CMIP5 models is still missing. In this study we examined a key variable associated with dust radiative effect, dust optical depth (DOD), using seven CMIP5 models with interactive dust emission schemes and DOD retrieved from MODIS Deep Blue aerosol products.
We found that the global spatial pattern and magnitude are largely captured by CMIP5 models in the 2004–2016 climatology, with an underestimation of global DOD (over land) by −25.2 % in MAM to −6.4 % in DJF. The spatial pattern is better captured in boreal dusty seasons during MAM and JJA. In JJA, the simulated zonal mean DOD from the multi-model mean largely resembles MODIS DOD.
The magnitudes of multi-model mean are closer to MODIS climatology than most individual models and are largely within ± 1 order of magnitude of MODIS DOD in the nine regions examined here (North Africa, the Middle East, northern China, North America, India, southeastern Asia, South Africa, South America, and Australia; see Fig. 1 and Table 2 for domains). While some models underestimate DOD in North America and South America by more than 2 orders of magnitude, a few also overestimate DOD in Australia by more than 1 order of magnitude. Both the magnitude and spatial patterns of DOD are better captured over North Africa and the Middle East than other regions.
The multi-model mean also largely captures the seasonal cycle of DOD in some very dusty regions, such as North Africa and the Middle East. Seasonal variations in North America and India are also generally captured by the multi-model mean, with the modeled DOD peaking at approximately the same season as in MODIS DOD but not so in northern China and southeastern Asia. Seasonal cycles in those dusty regions in the Southern Hemisphere are generally not well captured, with modeled DOD over South Africa and South America peaking later than that in MODIS DOD but earlier in Australia.
The interannual variations in DOD are not captured by most of the CMIP5 models during 2004–2016. Models also underestimate the constraints from surface bareness on the variations in DOD and overestimate the influences from surface wind speed and precipitation in those major dust source regions. CMIP5-projected change of DOD in the late half of the 21st century (under the RCP8.5 scenario) with reference to historical conditions (1861–2005) also shows greater influence from precipitation and surface wind change than from surface bareness. Overall, the multi-model mean projects a change of DOD over land from −3.8 % in SON to 3.3 % in JJA.
We also provide a projection of future DOD change using a regression model based on local controlling factors such as surface wind, bareness, and precipitation (Pu and Ginoux, 2017). This model can largely capture the interannual variations in MODIS DOD in 2004–2016. The regression model projects a reduction of DOD in the Sahel in all seasons in the late half of the 21st century under the RCP8.5 scenario, largely due to a decrease in surface bareness. DOD is projected to increase over the southern edge of the Sahara in association with surface wind and precipitation changes except in MAM, when a reduction of DOD over most of North Africa is projected. DOD is also projected to increase over the central Arabian Peninsula in all seasons and to decrease over northern China from MAM to SON.
Despite large uncertainties associated with both projections, we find some similarities between the two, which adds to the confidence of projected DOD change in these regions, for instance, changes of DOD over North Africa in DJF and JJA, an increase in DOD in the central Arabian Peninsula in all seasons, and a decrease in DOD over northern China from MAM to SON.
PRECL precipitation data are provided by the NOAA/OAR/ESRL PSD, Boulder, Colorado, USA, from their web site at http://www.esrl.noaa.gov/psd (last access: February 2018). The CALIOP products are downloaded from https://data.nodc.noaa.gov/cgi-bin/iso?id=gov.noaa.ncdc:C00898 (last access: February 2018). ERA-Interim is downloaded from http://www.ecmwf.int/en/research/climate-reanalysis/era-interim. The AERONET coarse-mode aerosol optical depth data are downloaded from https://aeronet.gsfc.nasa.gov. CMIP5 data are downloaded from https://esgf-node.llnl.gov/projects/esgf-llnl/ (last access: December 2017) (Taylor et al., 2012).
The supplement related to this article is available online at: https://doi.org/10.5194/acp-18-12491-2018-supplement.
BP conceived the study, downloaded and analyzed the data and wrote the manuscript with input from PG. PG retrieved MODIS DOD data from MODIS Deep Blue aerosol products. All authors edited and commented on the manuscript.
The authors declare that they have no conflict of interest.
This research is supported by NOAA and Princeton University's Cooperative
Institute for Climate Science and NASA under grants NNH14ZDA001N-ACMAP and
NNH16ZDA001N-MAP. The authors thank Songmiao Fan and Fabien Paulot for their
helpful comments on an early version of this paper. The insightful comments
from the two anonymous reviewers improved the paper. We also thank the AERONET
program for establishing and maintaining the sun photometer sites used in this
study. We acknowledge the World Climate Research Programme's Working Group on
Coupled Modelling, which is responsible for CMIP, and we thank the climate modeling
groups (listed in Table 1 of this paper) for producing and making available their
model output. For CMIP the U.S. Department of Energy's Program for Climate Model
Diagnosis and Intercomparison provides coordinating support and led the development
of software infrastructure in partnership with the Global Organization for Earth System
Science Portals.
Edited by: Philip Stier
Reviewed by: two anonymous referees
Abudu, S., Cui, C. L., King, J. P., Moreno, J., and Bawazir, A. S.: Modeling of daily pan evaporation using partial least squares regression, Sci. China Technol. Sc., 54, 163–174, https://doi.org/10.1007/s11431-010-4205-z, 2011.
Arora, V. K., Scinocca, J. F., Boer, G. J., Christian, J. R., Denman, K. L., Flato, G. M., Kharin, V. V., Lee, W. G., and Merryfield, W. J.: Carbon emission limits required to satisfy future representative concentration pathways of greenhouse gases, Geophys. Res. Lett., 38, L05805, https://doi.org/10.1029/2010gl046270, 2011.
Ashpole, I. and Washington, R.: A new high-resolution central and western Saharan summertime dust source map from automated satellite dust plume tracking, J. Geophys. Res.-Atmos., 118, 6981–6995, https://doi.org/10.1002/jgrd.50554, 2013.
Baddock, M. C., Ginoux, P., Bullard, J. E., and Gill, T. E.: Do MODIS-defined dust sources have a geomorphological signature?, Geophys. Res. Lett., 43, 2606–2613, https://doi.org/10.1002/2015gl067327, 2016.
Bangert, M., Nenes, A., Vogel, B., Vogel, H., Barahona, D., Karydis, V. A., Kumar, P., Kottmeier, C., and Blahak, U.: Saharan dust event impacts on cloud formation and radiation over Western Europe, Atmos. Chem. Phys., 12, 4045–4063, https://doi.org/10.5194/acp-12-4045-2012, 2012.
Bellouin, N., Rae, J., Jones, A., Johnson, C., Haywood, J., and Boucher, O.: Aerosol forcing in the Climate Model Intercomparison Project (CMIP5) simulations by HadGEM2-ES and the role of ammonium nitrate, J. Geophys. Res.-Atmos., 116, D20206, https://doi.org/10.1029/2011jd016074, 2011.
Bentsen, M., Bethke, I., Debernard, J. B., Iversen, T., Kirkevåg, A., Seland, Ø., Drange, H., Roelandt, C., Seierstad, I. A., Hoose, C., and Kristjánsson, J. E.: The Norwegian Earth System Model, NorESM1-M – Part 1: Description and basic evaluation of the physical climate, Geosci. Model Dev., 6, 687–720, https://doi.org/10.5194/gmd-6-687-2013, 2013.
Boville, B. A. and Gent, P. R.: The NCAR Climate System Model, version one, J. Climate, 11, 1115–1130, https://doi.org/10.1175/1520-0442(1998)011<1115:TNCSMV>2.0.CO;2, 1998.
Chen, M. Y., Xie, P. P., Janowiak, J. E., and Arkin, P. A.: Global land precipitation: A 50-yr monthly analysis based on gauge observations, J. Hydrometeorol., 3, 249–266, https://doi.org/10.1175/1525-7541(2002)003<0249:GLPAYM>2.0.CO;2, 2002.
Claverie, M., Matthews, J. L., Vermote, E. F., and Justice, C. O.: A 30+ Year AVHRR LAI and FAPAR Climate Data Record: Algorithm Description and Validation, Remote Sens.-Basel, 8, 263, https://doi.org/10.3390/rs8030263, 2016.
Collins, W. J., Bellouin, N., Doutriaux-Boucher, M., Gedney, N., Halloran, P., Hinton, T., Hughes, J., Jones, C. D., Joshi, M., Liddicoat, S., Martin, G., O'Connor, F., Rae, J., Senior, C., Sitch, S., Totterdell, I., Wiltshire, A., and Woodward, S.: Development and evaluation of an Earth-System model – HadGEM2, Geosci. Model Dev., 4, 1051–1075, https://doi.org/10.5194/gmd-4-1051-2011, 2011.
Cook, B. I., Miller, R. L., and Seager, R.: Dust and sea surface temperature forcing of the 1930s “Dust Bowl” drought, Geophys. Res. Lett., 35, L08710, https://doi.org/10.1029/2008gl033486, 2008.
Cook, B. I., Miller, R. L., and Seager, R.: Amplification of the North American “Dust Bowl” drought through human-induced land degradation, P. Natl. Acad. Sci. USA, 106, 4997–5001, https://doi.org/10.1073/pnas.0810200106, 2009.
Cook, B. I., Seager, R., Miller, R. L., and Mason, J. A.: Intensification of North American Megadroughts through Surface and Dust Aerosol Forcing, J. Climate, 26, 4414–4430, https://doi.org/10.1175/Jcli-D-12-00022.1, 2013.
Croft, B., Lohmann, U., and von Salzen, K.: Black carbon ageing in the Canadian Centre for Climate modelling and analysis atmospheric general circulation model, Atmos. Chem. Phys., 5, 1931–1949, https://doi.org/10.5194/acp-5-1931-2005, 2005.
Donner, L. J., Wyman, B. L., Hemler, R. S., Horowitz, L. W., Ming, Y., Zhao, M., Golaz, J. C., Ginoux, P., Lin, S. J., Schwarzkopf, M. D., Austin, J., Alaka, G., Cooke, W. F., Delworth, T. L., Freidenreich, S. M., Gordon, C. T., Griffies, S. M., Held, I. M., Hurlin, W. J., Klein, S. A., Knutson, T. R., Langenhorst, A. R., Lee, H. C., Lin, Y. L., Magi, B. I., Malyshev, S. L., Milly, P. C. D., Naik, V., Nath, M. J., Pincus, R., Ploshay, J. J., Ramaswamy, V., Seman, C. J., Shevliakova, E., Sirutis, J. J., Stern, W. F., Stouffer, R. J., Wilson, R. J., Winton, M., Wittenberg, A. T., and Zeng, F. R.: The Dynamical Core, Physical Parameterizations, and Basic Simulation Characteristics of the Atmospheric Component AM3 of the GFDL Global Coupled Model CM3, J. Climate, 24, 3484–3519, https://doi.org/10.1175/2011jcli3955.1, 2011.
Dunion, J. P. and Velden, C. S.: The impact of the Saharan air layer on Atlantic tropical cyclone activity, B. Am. Meteorol. Soc., 85, 353–365, https://doi.org/10.1175/Bams-85-3-353, 2004.
Evan, A. T., Dunion, J., Foley, J. A., Heidinger, A. K., and Velden, C. S.: New evidence for a relationship between Atlantic tropical cyclone activity and African dust outbreaks, Geophys. Res. Lett., 33, L19813, https://doi.org/10.1029/2006gl026408, 2006.
Evan, A. T. and Mukhopadhyay, S.: African Dust over the Northern Tropical Atlantic: 1955–2008, J. Appl. Meteorol. Clim., 49, 2213–2229, https://doi.org/10.1175/2010jamc2485.1, 2010.
Evan, A. T., Flamant, C., Fiedler, S., and Doherty, O.: An analysis of aeolian dust in climate models, Geophys. Res. Lett., 41, 5996–6001, https://doi.org/10.1002/2014gl060545, 2014.
Evan, A. T., Flamant, C., Gaetani, M., and Guichard, F.: The past, present and future of African dust, Nature, 531, 493–495, https://doi.org/10.1038/nature17149, 2016.
Evans, S., Ginoux, P., Malyshev, S., and Shevliakova, E.: Climate-vegetation interaction and amplification of Australian dust variability, Geophys. Res. Lett., 43, 11823–11830, https://doi.org/10.1002/2016gl071016, 2016.
Fecan, F., Marticorena, B., and Bergametti, G.: Parametrization of the increase of the aeolian erosion threshold wind friction velocity due to soil moisture for arid and semi-arid areas, Ann. Geophys.-Atm. Hydr., 17, 149–157, https://doi.org/10.1007/s005850050744, 1999.
Fiedler, S., Schepanski, K., Heinold, B., Knippertz, P., and Tegen, I.: Climatology of nocturnal low-level jets over North Africa and implications for modeling mineral dust emission, J. Geophys. Res.-Atmos., 118, 6100–6121, https://doi.org/10.1002/jgrd.50394, 2013.
Fiedler, S., Knippertz, P., Woodward, S., Martin, G. M., Bellouin, N., Ross, A. N., Heinold, B., Schepanski, K., Birch, C. E., and Tegen, I.: A process-based evaluation of dust-emitting winds in the CMIP5 simulation of HadGEM2-ES, Clim. Dynam., 46, 1107–1130, https://doi.org/10.1007/s00382-015-2635-9, 2016.
Fung, I. Y., Meyn, S. K., Tegen, I., Doney, S. C., John, J. G., and Bishop, J. K. B.: Iron supply and demand in the upper ocean, Global Biogeochem. Cy., 14, 281–295, https://doi.org/10.1029/1999gb900059, 2000.
Fuss, S., Canadell, J. G., Peters, G. P., Tavoni, M., Andrew, R. M., Ciais, P., Jackson, R. B., Jones, C. D., Kraxner, F., Nakicenovic, N., Le Quere, C., Raupach, M. R., Sharifi, A., Smith, P., and Yamagata, Y.: COMMENTARY: Betting on negative emissions, Nat. Clim. Change, 4, 850–853, https://doi.org/10.1038/nclimate2392, 2014.
Gillette, D. A. and Passi, R.: Modeling Dust Emission Caused by Wind Erosion, J. Geophys. Res.-Atmos., 93, 14233–14242, https://doi.org/10.1029/JD093iD11p14233, 1988.
Ginoux, P., Chin, M., Tegen, I., Prospero, J. M., Holben, B., Dubovik, O., and Lin, S. J.: Sources and distributions of dust aerosols simulated with the GOCART model, J. Geophys. Res.-Atmos., 106, 20255–20273, https://doi.org/10.1029/2000jd000053, 2001.
Ginoux, P., Garbuzov, D., and Hsu, N. C.: Identification of anthropogenic and natural dust sources using Moderate Resolution Imaging Spectroradiometer (MODIS) Deep Blue level 2 data, J. Geophys. Res.-Atmos., 115, D05204, https://doi.org/10.1029/2009jd012398, 2010.
Ginoux, P., Clarisse, L., Clerbaux, C., Coheur, P.-F., Dubovik, O., Hsu, N. C., and Van Damme, M.: Mixing of dust and NH3 observed globally over anthropogenic dust sources, Atmos. Chem. Phys., 12, 7351–7363, https://doi.org/10.5194/acp-12-7351-2012, 2012a.
Ginoux, P., Prospero, J. M., Gill, T. E., Hsu, N. C., and Zhao, M.: Global-Scale Attribution of Anthropogenic and Natural Dust Sources and Their Emission Rates Based on MODIS Deep Blue Aerosol Products, Rev. Geophys., 50, RG3005, https://doi.org/10.1029/2012rg000388, 2012b.
Houghton, J., Ding, Y., Griggs, D. J., Noguer, M., Linden, P. J. V. D., Dai, X., Maskell, K., and Johnson, C. A.: Climate Change 2001: The scientific basis. Contribution of Working Group I to the Third Assessment Report of the Intergovernmental Panel on Climate Change, Cambridge Univ. Press, Cambridge, UK, 2001.
Hsu, N. C., Tsay, S. C., King, M. D., and Herman, J. R.: Aerosol properties over bright-reflecting source regions, IEEE T. Geosci. Remote, 42, 557–569, https://doi.org/10.1109/Tgrs.2004.824067, 2004.
Hsu, N. C., Tsay, S. C., King, M. D., and Herman, J. R.: Deep blue retrievals of Asian aerosol properties during ACE-Asia, IEEE T. Geosci. Remote, 44, 3180–3195, https://doi.org/10.1109/Tgrs.2006.879540, 2006.
Hsu, N. C., Jeong, M. J., Bettenhausen, C., Sayer, A. M., Hansell, R., Seftor, C. S., Huang, J., and Tsay, S. C.: Enhanced Deep Blue aerosol retrieval algorithm: The second generation, J. Geophys. Res.-Atmos., 118, 9296–9315, https://doi.org/10.1002/jgrd.50712, 2013.
Huneeus, N., Schulz, M., Balkanski, Y., Griesfeller, J., Prospero, J., Kinne, S., Bauer, S., Boucher, O., Chin, M., Dentener, F., Diehl, T., Easter, R., Fillmore, D., Ghan, S., Ginoux, P., Grini, A., Horowitz, L., Koch, D., Krol, M. C., Landing, W., Liu, X., Mahowald, N., Miller, R., Morcrette, J.-J., Myhre, G., Penner, J., Perlwitz, J., Stier, P., Takemura, T., and Zender, C. S.: Global dust model intercomparison in AeroCom phase I, Atmos. Chem. Phys., 11, 7781–7816, https://doi.org/10.5194/acp-11-7781-2011, 2011.
Jickells, T. D., An, Z. S., Andersen, K. K., Baker, A. R., Bergametti, G., Brooks, N., Cao, J. J., Boyd, P. W., Duce, R. A., Hunter, K. A., Kawahata, H., Kubilay, N., laRoche, J., Liss, P. S., Mahowald, N., Prospero, J. M., Ridgwell, A. J., Tegen, I., and Torres, R.: Global iron connections between desert dust, ocean biogeochemistry, and climate, Science, 308, 67–71, https://doi.org/10.1126/science.1105959, 2005.
Jin, Q., Wei, J., Yang, Z.-L., Pu, B., and Huang, J.: Consistent response of Indian summer monsoon to Middle East dust in observations and simulations, Atmos. Chem. Phys., 15, 9897–9915, https://doi.org/10.5194/acp-15-9897-2015, 2015.
Jin, Q. J., Wei, J. F., and Yang, Z. L.: Positive response of Indian summer rainfall to Middle East dust, Geophys. Res. Lett., 41, 4068–4074, https://doi.org/10.1002/2014gl059980, 2014.
Jin, Q. J., Yang, Z. L., and Wei, J. F.: Seasonal Responses of Indian Summer Monsoon to Dust Aerosols in the Middle East, India, and China, J. Climate, 29, 6329–6349, https://doi.org/10.1175/Jcli-D-15-0622.1, 2016.
Kim, M. K., Lau, W. K. M., Kim, K. M., Sang, J., Kim, Y. H., and Lee, W. S.: Amplification of ENSO effects on Indian summer monsoon by absorbing aerosols, Clim. Dynam., 46, 2657–2671, https://doi.org/10.1007/s00382-015-2722-y, 2016.
Kok, J. F., Ridley, D. A., Zhou, Q., Miller, R. L., Zhao, C., Heald, C. L., Ward, D. S., Albani, S., and Haustein, K.: Smaller desert dust cooling effect estimated from analysis of dust size and abundance, Nat. Geosci., 10, https://doi.org/10.1038/Ngeo2912, 2017.
Laurent, B., Marticorena, B., Bergametti, G., and Mei, F.: Modeling mineral dust emissions from Chinese and Mongolian deserts, Glob. Planet Change, 52, 121–141, https://doi.org/10.1016/j.gloplacha.2006.02.012, 2006.
Levin, Z., Ganor, E., and Gladstein, V.: The effects of desert particles coated with sulfate on rain formation in the eastern Mediterranean, J. Appl. Meteorol., 35, 1511–1523, https://doi.org/10.1175/1520-0450(1996)035<1511:TEODPC>2.0.CO;2, 1996.
Mahowald, N. M. and Luo, C.: A less dusty future?, Geophys. Res. Lett., 30, 1903, https://doi.org/10.1029/2003gl017880, 2003.
Mahowald, N. M., Kloster, S., Engelstaedter, S., Moore, J. K., Mukhopadhyay, S., McConnell, J. R., Albani, S., Doney, S. C., Bhattacharya, A., Curran, M. A. J., Flanner, M. G., Hoffman, F. M., Lawrence, D. M., Lindsay, K., Mayewski, P. A., Neff, J., Rothenberg, D., Thomas, E., Thornton, P. E., and Zender, C. S.: Observed 20th century desert dust variability: impact on climate and biogeochemistry, Atmos. Chem. Phys., 10, 10875–10893, https://doi.org/10.5194/acp-10-10875-2010, 2010.
Marticorena, B. and Bergametti, G.: Modeling the Atmospheric Dust Cycle 1, Design of a Soil-Derived Dust Emission Scheme, J. Geophys. Res.-Atmos., 100, 16415–16430, https://doi.org/10.1029/95jd00690, 1995.
Marx, S. K., McGowan, H. A., and Kamber, B. S.: Long-range dust transport from eastern Australia: A proxy for Holocene aridity and ENSO-type climate variability, Earth Planet. Sc. Lett., 282, 167–177, https://doi.org/10.1016/j.epsl.2009.03.013, 2009.
McConnell, J. R., Aristarain, A. J., Banta, J. R., Edwards, P. R., and Simoes, J. C.: 20th-Century doubling in dust archived in an Antarctic Peninsula ice core parallels climate change and desertification in South America, P. Natl. Acad. Sci. USA, 104, 5743–5748, https://doi.org/10.1073/pnas.0607657104, 2007.
Miller, R. L. and Tegen, I.: Climate response to soil dust aerosols, J. Climate, 11, 3247–3267, https://doi.org/10.1175/1520-0442(1998)011<3247:CRTSDA>2.0.CO;2, 1998.
Miller, R. L., Tegen, I., and Perlwitz, J.: Surface radiative forcing by soil dust aerosols and the hydrologic cycle, J. Geophys. Res.-Atmos., 109, D04203, https://doi.org/10.1029/2003jd004085, 2004.
Misra, A., Kanawade, V. P., and Tripathi, S. N.: Quantitative assessment of AOD from 17 CMIP5 models based on satellite-derived AOD over India, Ann. Geophys., 34, 657–671, https://doi.org/10.5194/angeo-34-657-2016, 2016.
Moulin, C. and Chiapello, I.: Impact of human-induced desertification on the intensification of Sahel dust emission and export over the last decades, Geophys. Res. Lett., 33, L18808, https://doi.org/10.1029/2006gl025923, 2006.
Myhre, G., Shindell, D., Bréon, F.-M., Collins, W., Fuglestvedt, J., Huang, J., Koch, D., Lamarque, J.-F., Lee, D., Mendoza, B., Nakajima, T., Robock, A., Stephens, G., Takemura, T., and Zhang, H.: Anthropogenic and Natural Radiative Forcing, in: Climate Change 2013: The Physical Science Basis, Contribution of Working Group I to the Fifth Assessment Report of the Intergovernmental Panel on Climate Change, edited by: Stocker, T. F., Qin, D., Plattner, G.-K., Tignor, M., Allen, S. K., Boschung, J., Nauels, A., Xia, Y., Bex, V., and Midgley, P. M., Cambridge University Press, Cambridge, United Kingdom and New York, NY, USA, 2013.
Nakajima, T., Higurashi, A., Kawamoto, K., and Penner, J. E.: A possible correlation between satellite-derived cloud and aerosol microphysical parameters, Geophys. Res. Lett., 28, 1171–1174, https://doi.org/10.1029/2000gl012186, 2001.
Neff, J. C., Reynolds, R. L., Belnap, J., and Lamothe, P.: Multi-decadal impacts of grazing on soil physical and biogeochemical properties in southeast Utah, Ecol. Appl., 15, 87–95, https://doi.org/10.1890/04-0268, 2005.
Neff, J. C., Ballantyne, A. P., Farmer, G. L., Mahowald, N. M., Conroy, J. L., Landry, C. C., Overpeck, J. T., Painter, T. H., Lawrence, C. R., and Reynolds, R. L.: Increasing eolian dust deposition in the western United States linked to human activity, Nat. Geosci., 1, 189–195, https://doi.org/10.1038/ngeo133, 2008.
O'Brien, R. M.: A caution regarding rules of thumb for variance inflation factors, Qual. Quant., 41, 673–690, https://doi.org/10.1007/s11135-006-9018-6, 2007.
O'Neill, N. T., Eck, T. F., Smirnov, A., Holben, B. N., and Thulasiraman, S.: Spectral discrimination of coarse and fine mode optical depth, J. Geophys. Res.-Atmos., 108, 4559, https://doi.org/10.1029/2002jd002975, 2003.
Prospero, J. M. and Nees, R. T.: Impact of the North African Drought and El-Nino on Mineral Dust in the Barbados Trade Winds, Nature, 320, 735–738, https://doi.org/10.1038/320735a0, 1986.
Prospero, J. M. and Lamb, P. J.: African droughts and dust transport to the Caribbean: Climate change implications, Science, 302, 1024–1027, https://doi.org/10.1126/science.1089915, 2003.
Pu, B., Fu, R., Dickinson, R. E., and Fernando, D. N.: Why do summer droughts in the Southern Great Plains occur in some La Nina years but not others?, J. Geophys. Res.-Atmos., 121, 1120–1137, https://doi.org/10.1002/2015jd023508, 2016.
Pu, B. and Ginoux, P.: The impact of the Pacific Decadal Oscillation on springtime dust activity in Syria, Atmos. Chem. Phys., 16, 13431–13448, https://doi.org/10.5194/acp-16-13431-2016, 2016.
Pu, B. and Ginoux, P.: Projection of American dustiness in the late 21st century due to climate change, Sci. Rep., 7, 5553, https://doi.org/10.1038/s41598-017-05431-9, 2017.
Reader, M. C., Fung, I., and McFarlane, N.: The mineral dust aerosol cycle during the last glacial maximum, J. Geophys. Res.-Atmos., 104, 22319–22320, https://doi.org/10.1029/1999jd900434, 1999.
Riahi, K., Rao, S., Krey, V., Cho, C. H., Chirkov, V., Fischer, G., Kindermann, G., Nakicenovic, N., and Rafaj, P.: RCP 8.5-A scenario of comparatively high greenhouse gas emissions, Clim. Change, 109, 33–57, https://doi.org/10.1007/s10584-011-0149-y, 2011.
Rosenfield, J. E., Considine, D. B., Meade, P. E., Bacmeister, J. T., Jackman, C. H., and Schoeberl, M. R.: Stratospheric effects of Mount Pinatubo aerosol studied with a coupled two-dimensional model, J. Geophys. Res.-Atmos., 102, 3649–3670, https://doi.org/10.1029/96jd03820, 1997.
Sanap, S. D., Ayantika, D. C., Pandithurai, G., and Niranjan, K.: Assessment of the aerosol distribution over Indian subcontinent in CMIP5 models, Atmos. Environ., 87, 123–137, https://doi.org/10.1016/j.atmosenv.2014.01.017, 2014.
Seland, O., Iversen, T., Kirkevag, A., and Storelvmo, T.: Aerosol-climate interactions in the CAM-Oslo atmospheric GCM and investigation of associated basic shortcomings, Tellus A, 60, 459–491, https://doi.org/10.1111/j.1600-0870.2008.00318.x, 2008.
Shao, Y. P., Wyrwoll, K. H., Chappell, A., Huang, J. P., Lin, Z. H., McTainsh, G. H., Mikami, M., Tanaka, T. Y., Wang, X. L., and Yoon, S.: Dust cycle: An emerging core theme in Earth system science, Aeolian Res., 2, 181–204, https://doi.org/10.1016/j.aeolia.2011.02.001, 2011.
Sharma, D. and Miller, R. L.: Revisiting the observed correlation between weekly averaged Indian monsoon precipitation and Arabian Sea aerosol optical depth, Geophys. Res. Lett., 44, 10006–10016, https://doi.org/10.1002/2017gl074373, 2017.
Shindell, D. T., Lamarque, J.-F., Schulz, M., Flanner, M., Jiao, C., Chin, M., Young, P. J., Lee, Y. H., Rotstayn, L., Mahowald, N., Milly, G., Faluvegi, G., Balkanski, Y., Collins, W. J., Conley, A. J., Dalsoren, S., Easter, R., Ghan, S., Horowitz, L., Liu, X., Myhre, G., Nagashima, T., Naik, V., Rumbold, S. T., Skeie, R., Sudo, K., Szopa, S., Takemura, T., Voulgarakis, A., Yoon, J.-H., and Lo, F.: Radiative forcing in the ACCMIP historical and future climate simulations, Atmos. Chem. Phys., 13, 2939–2974, https://doi.org/10.5194/acp-13-2939-2013, 2013.
Solmon, F., Nair, V. S., and Mallet, M.: Increasing Arabian dust activity and the Indian summer monsoon, Atmos. Chem. Phys., 15, 8051–8064, https://doi.org/10.5194/acp-15-8051-2015, 2015.
Strong, J. D., Vecchi, G. A., and Ginoux, P.: The Climatological Effect of Saharan Dust on Global Tropical Cyclones in a Fully Coupled GCM, J. Geophys. Res.-Atmos., 123, 5538–5559, https://doi.org/10.1029/2017JD027808, 2018.
Strong, J. D. O., Vecchi, G. A., and Ginoux, P.: The Response of the Tropical Atlantic and West African Climate to Saharan Dust in a Fully Coupled GCM, J. Climate, 28, 7071–7092, https://doi.org/10.1175/Jcli-D-14-00797.1, 2015.
Sun, D. L., Lau, K. M., and Kafatos, M.: Contrasting the 2007 and 2005 hurricane seasons: Evidence of possible impacts of Saharan dry air and dust on tropical cyclone activity in the Atlantic basin, Geophys. Res. Lett., 35, L15405, https://doi.org/10.1029/2008gl034529, 2008.
Takemura, T., Okamoto, H., Maruyama, Y., Numaguti, A., Higurashi, A., and Nakajima, T.: Global three-dimensional simulation of aerosol optical thickness distribution of various origins, J. Geophys. Res.-Atmos., 105, 17853–17873, https://doi.org/10.1029/2000jd900265, 2000.
Taylor, K. E., Stouffer, R. J., and Meehl, G. A.: An Overview of CMIP5 and the experiment design, Bull. Am. Meteor. Soc., 93, 485–498, https://doi.org/10.1175/BAMS-D-11-00094.1, 2012.
Tegen, I., Harrison, S. P., Kohfeld, K., Prentice, I. C., Coe, M., and Heimann, M.: Impact of vegetation and preferential source areas on global dust aerosol: Results from a model study, J. Geophys. Res.-Atmos., 107, https://doi.org/10.1029/2001jd000963, 2002.
Tegen, I., Werner, M., Harrison, S. P., and Kohfeld, K. E.: Relative importance of climate and land use in determining present and future global soil dust emission, Geophys. Res. Lett., 31, L05105, https://doi.org/10.1029/2003gl019216, 2004.
Todd, M. C., Washington, R., Raghavan, S., Lizcano, G., and Knippertz, P.: Regional model simulations of the Bodele low-level jet of northern Chad during the Bodele Dust Experiment (BoDEx 2005), J. Climate, 21, 995–1012, https://doi.org/10.1175/2007jcli1766.1, 2008.
Vinoj, V., Rasch, P. J., Wang, H. L., Yoon, J. H., Ma, P. L., Landu, K., and Singh, B.: Short-term modulation of Indian summer monsoon rainfall by West Asian dust, Nat. Geosci., 7, 308–313, https://doi.org/10.1038/ngeo2107, 2014.
Watanabe, S., Hajima, T., Sudo, K., Nagashima, T., Takemura, T., Okajima, H., Nozawa, T., Kawase, H., Abe, M., Yokohata, T., Ise, T., Sato, H., Kato, E., Takata, K., Emori, S., and Kawamiya, M.: MIROC-ESM 2010: model description and basic results of CMIP5-20c3m experiments, Geosci. Model Dev., 4, 845–872, https://doi.org/10.5194/gmd-4-845-2011, 2011.
Winker, D. M., Hunt, W., and Hostetler, C.: Status and performance of the CALIOP lidar, Bba Lib., 5575, 8–15, https://doi.org/10.1117/12.571955, 2004.
Winker, D. M., Hunt, W. H., and McGill, M. J.: Initial performance assessment of CALIOP, Geophys. Res. Lett., 34, https://doi.org/10.1029/2007gl030135, 2007.
Wong, S. and Dessler, A. E.: Suppression of deep convection over the tropical North Atlantic by the Saharan Air Layer, Geophys. Res. Lett., 32, https://doi.org/10.1029/2004gl022295, 2005.
Wurzler, S., Reisin, T. G., and Levin, Z.: Modification of mineral dust particles by cloud processing and subsequent effects on drop size distributions, J. Geophys. Res.-Atmos., 105, 4501–4512, https://doi.org/10.1029/1999jd900980, 2000.
Zender, C. S. and Kwon, E. Y.: Regional contrasts in dust emission responses to climate, J. Geophys. Res.-Atmos., 110, D13201, https://doi.org/10.1029/2004jd005501, 2005.
Zhao, T. L., Gong, S. L., Zhang, X. Y., Blanchet, J. P., McKendry, I. G., and Zhou, Z. J.: A simulated climatology of Asian dust aerosol and its trans-Pacific transport, Part I: Mean climate and validation, J. Climate, 19, 88–103, https://doi.org/10.1175/Jcli3605.1, 2006.