the Creative Commons Attribution 4.0 License.
the Creative Commons Attribution 4.0 License.
 | 28 Aug 2018
Connecting regional aerosol emissions reductions to local and remote precipitation responses
Daniel M. Westervelt
Andrew J. Conley
Arlene M. Fiore
Jean-François Lamarque
Drew T. Shindell
Michael Previdi
Nora R. Mascioli
Greg Faluvegi
Gustavo Correa
Larry W. Horowitz
The unintended climatic implications of aerosol and precursor emission reductions implemented to protect public health are poorly understood. We investigate the precipitation response to regional changes in aerosol emissions using three coupled chemistry–climate models: NOAA Geophysical Fluid Dynamics Laboratory Coupled Model 3 (GFDL-CM3), NCAR Community Earth System Model (CESM1), and NASA Goddard Institute for Space Studies ModelE2 (GISS-E2). Our approach contrasts a long present-day control simulation from each model (up to 400 years with perpetual year 2000 or 2005 emissions) with 14 individual aerosol emissions perturbation simulations (160–240 years each). We perturb emissions of sulfur dioxide and/or carbonaceous aerosol within six world regions and assess the significance of precipitation responses relative to internal variability determined by the control simulation and across the models. Global and regional precipitation mostly increases when we reduce regional aerosol emissions in the models, with the strongest responses occurring for sulfur dioxide emissions reductions from Europe and the United States. Precipitation responses to aerosol emissions reductions are largest in the tropics and project onto the El Niño–Southern Oscillation (ENSO). Regressing precipitation onto an Indo-Pacific zonal sea level pressure gradient index (a proxy for ENSO) indicates that the ENSO component of the precipitation response to regional aerosol removal can be as large as 20 % of the total simulated response. Precipitation increases in the Sahel in response to aerosol reductions in remote regions because an anomalous interhemispheric temperature gradient alters the position of the Intertropical Convergence Zone (ITCZ). This mechanism holds across multiple aerosol reduction simulations and models.
- Article
(4144 KB) -
Supplement
(6772 KB) - BibTeX
- EndNote


Understanding the regional climate consequences of aerosols is of growing importance as emissions of aerosols and their precursors are projected to decline in most regions over the coming decades due to policies enacted to protect human health from the negative effects of air pollution (Rao et al., 2017; van Vuuren et al., 2011). Global emissions of anthropogenic aerosols and their precursors, including sulfur dioxide (SO2, precursor to sulfate aerosol), black carbon (BC), and organic carbon aerosol (OA), peaked in the 1970s and have been declining for the last few decades (Klimont et al., 2013; Smith et al., 2011; Smith and Bond, 2014). Major source regions such as the United States and Europe have also experienced decreases in anthropogenic SO2, BC, and OA emissions during this time (Leibensperger et al., 2012; Tørseth et al., 2012). Emissions in China may also be beginning to decline, whereas emissions in India continue to increase (Fontes et al., 2017; Li et al., 2017; Lu et al., 2011). As emissions of anthropogenic aerosols are phased out regionally and globally, their removal is expected to affect global and regional precipitation (Shindell et al., 2012). However, we currently lack a full understanding of the magnitude, spatial pattern, statistical significance, and underlying physical mechanisms of the precipitation response. In order to address this knowledge gap, we simulate here precipitation responses to the removal of aerosols from six world regions in three different fully coupled chemistry–climate models.
Aerosols impact precipitation primarily through two pathways: by altering the surface and top-of-atmosphere solar radiation balance (direct effect) and through microphysical effects on clouds (indirect effect) (Myhre et al., 2013). Generally, decreasing aerosol emissions results in a net enhancement of precipitation, since the reduced aerosol attenuation of incoming solar radiation results in more radiation reaching the surface, thereby resulting in more available heat for evaporation and convection (Ramanathan et al., 2001; Rosenfeld et al., 2008). Additionally, aerosol removal may enhance autoconversion and thus further increase rainfall locally via the cloud lifetime effect (Albrecht, 1989), though this effect remains uncertain (Stevens and Feingold, 2009). Aerosol composition plays a role in determining precipitation response in both the direct and indirect pathways. Pure sulfate aerosols are scattering agents, while black carbon also absorbs incoming solar radiation and therefore may impact precipitation rates in different ways (Ming et al., 2010). Sulfate aerosols and some organic aerosols are efficient cloud condensation nuclei (CCN), while black carbon aerosols do not seed liquid clouds as readily (Bond et al., 2013; Petters and Kreidenweis, 2007), at least not initially. These differences in optical and microphysical properties related to aerosol composition may lead to unique precipitation responses to the removal of individual aerosol components such as sulfate and black carbon (Andrews et al., 2010; Frieler et al., 2011).
Previous work has found that aerosols are linked to a number of regional precipitation and/or circulation responses, including the location and width of the Intertropical Convergence Zone (ITCZ), (Allen, 2015; Hwang et al., 2013; Ridley et al., 2015; Allen and Ajoku, 2016), rainfall in the Sahel (Ackerley et al., 2011; Biasutti and Giannini, 2006; Chang et al., 2011; Haywood et al., 2013; Held et al., 2005; Rotstayn et al., 2002; Westervelt et al., 2017), South Asian monsoon circulation (Bollasina et al., 2011; Menon et al., 2002), phasing of the North Atlantic Oscillation (NAO) (Fischer-Bruns et al., 2009) and North Atlantic climate variability (Booth et al., 2012), and rainfall in the US (Leibensperger et al., 2012; Shindell et al., 2012). Additional work is needed to identify robustness across multiple models and understand the physical mechanisms of these regional responses to aerosols. Westervelt et al. (2017) began this process by simulating the precipitation response to the complete removal of US anthropogenic SO2 emissions in three coupled chemistry–climate models and found statistically significant increases in Sahel rainfall in multiple models. We build here on the work of Westervelt et al. (2017) by considering, for the same three models, regional emissions removal from not only the US, but also Europe, China, India, South America, and Africa. Additionally, we expand the scope to include multiple aerosol types, including sulfate, BC, and OA in each of these regions. We identify robust (and non-robust) precipitation responses to a variety of regional aerosol perturbations and show that precipitation responses in the Sahel can be explained by a consistent physical mechanism involving a change in the interhemispheric temperature gradient and a northward shift of the ITCZ that is robust across multiple models. We choose to investigate the Sahel in more detail based on its recent climatic vulnerability to drought, which occurred over the latter half of the 20th century and was partially attributed to aerosol forcing (Ackerley et al., 2011; Biasutti and Giannini, 2006; Held et al., 2005). Similarly, precipitation in the Mediterranean has declined since the mid-20th century, although the cause of this decline is not well understood (Giorgi, 2002; Xoplaki et al., 2004). While the response of Mediterranean precipitation to climate variability has been thoroughly investigated (Dünkeloh and Jacobeit, 2003; Krichak and Alpert, 2005), the potential role of aerosol forcing has not been examined. Therefore, we use our multi-model regional aerosol perturbation framework to focus on the Sahel and Mediterranean precipitation responses in detail in addition to our more general analysis of precipitation responses around the globe.
We use an identical modeling framework as described by Westervelt et al. (2017) and Conley et al. (2017). Briefly, we employ three coupled atmosphere–ocean–land–sea–ice climate models with fully interactive chemistry of aerosols and trace gases: (1) Geophysical Fluid Dynamics Laboratory Coupled Climate Model version 3 (GFDL-CM3) (Donner et al., 2011), (2) Goddard Institute for Space Studies ModelE2 (GISS-E2-R) (Schmidt et al., 2014), and (3) Community Earth System Model version 1 (CESM1) (Neale et al., 2012). The model configuration for each is very similar to that used for the Coupled Model Intercomparison Project 5 (CMIP5). For further model description and model evaluation of relevance to precipitation response, we refer readers to Westervelt et al. (2017).
Table 1List of aerosol perturbation simulations, emissions reductions relative to the control simulation, and corresponding aerosol effective radiative forcing (ERF). SO2: sulfur dioxide, BC: black carbon, OC: organic carbon aerosol, ALL: SO2 + BC + OC, BB: biomass burning, US: United States, EU: Europe, CH: China, IN: India, AFR: Africa, SA: South America. N/A means that the particular simulation was not performed with this model. “Zero” refers to a zero-out of emissions, and 80 % refers to an 80 % reduction. Boldface values reported in Table 1 indicate statistical significance at the 2σ (95 %) level.
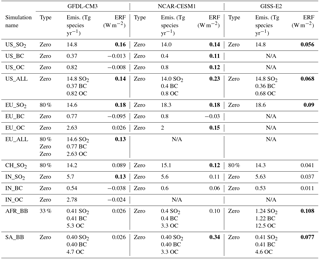
In each model, we conduct a series of long “present-day” control simulations of up to 400 years in length forced by perpetual year 2000 (2005 for NCAR-CESM1) conditions, including all emissions of aerosols and their precursors and greenhouse gas concentrations. We then conduct individual regional aerosol perturbation simulations in each model of at least 160 years and as long as 240 years, in which the anthropogenic aerosol or aerosol precursor emissions for a certain region are set equal to zero or reduced by the amount shown in Table 1. The magnitude of the emissions perturbation was chosen in order to have roughly equivalent emissions decreases across regions and models. As an example, “IN_SO2” refers to a simulation with perpetual year 2000 conditions (2005 for NCAR-CESM1) perturbed by setting all anthropogenic SO2 emissions over India to zero. Other than the regional aerosol emissions perturbation, all other model settings remain identical to the control. Long control and perturbation simulations allow us to establish statistical significance and separate forced responses from internal climate variability. We also conduct an additional set of atmosphere-only, fixed SST simulations of 40–80 years in length with control and perturbed aerosol emissions to calculate the effective radiative forcing (ERF; as defined in Myhre et al., 2013) resulting from the regional perturbations to aerosol emissions. The ERF calculation in GISS-E2 included a land surface temperature adjustment based on the global climate sensitivity parameter (Forster et al., 2016), while GFDL-CM3 and NCAR-CESM1 did not include this adjustment.
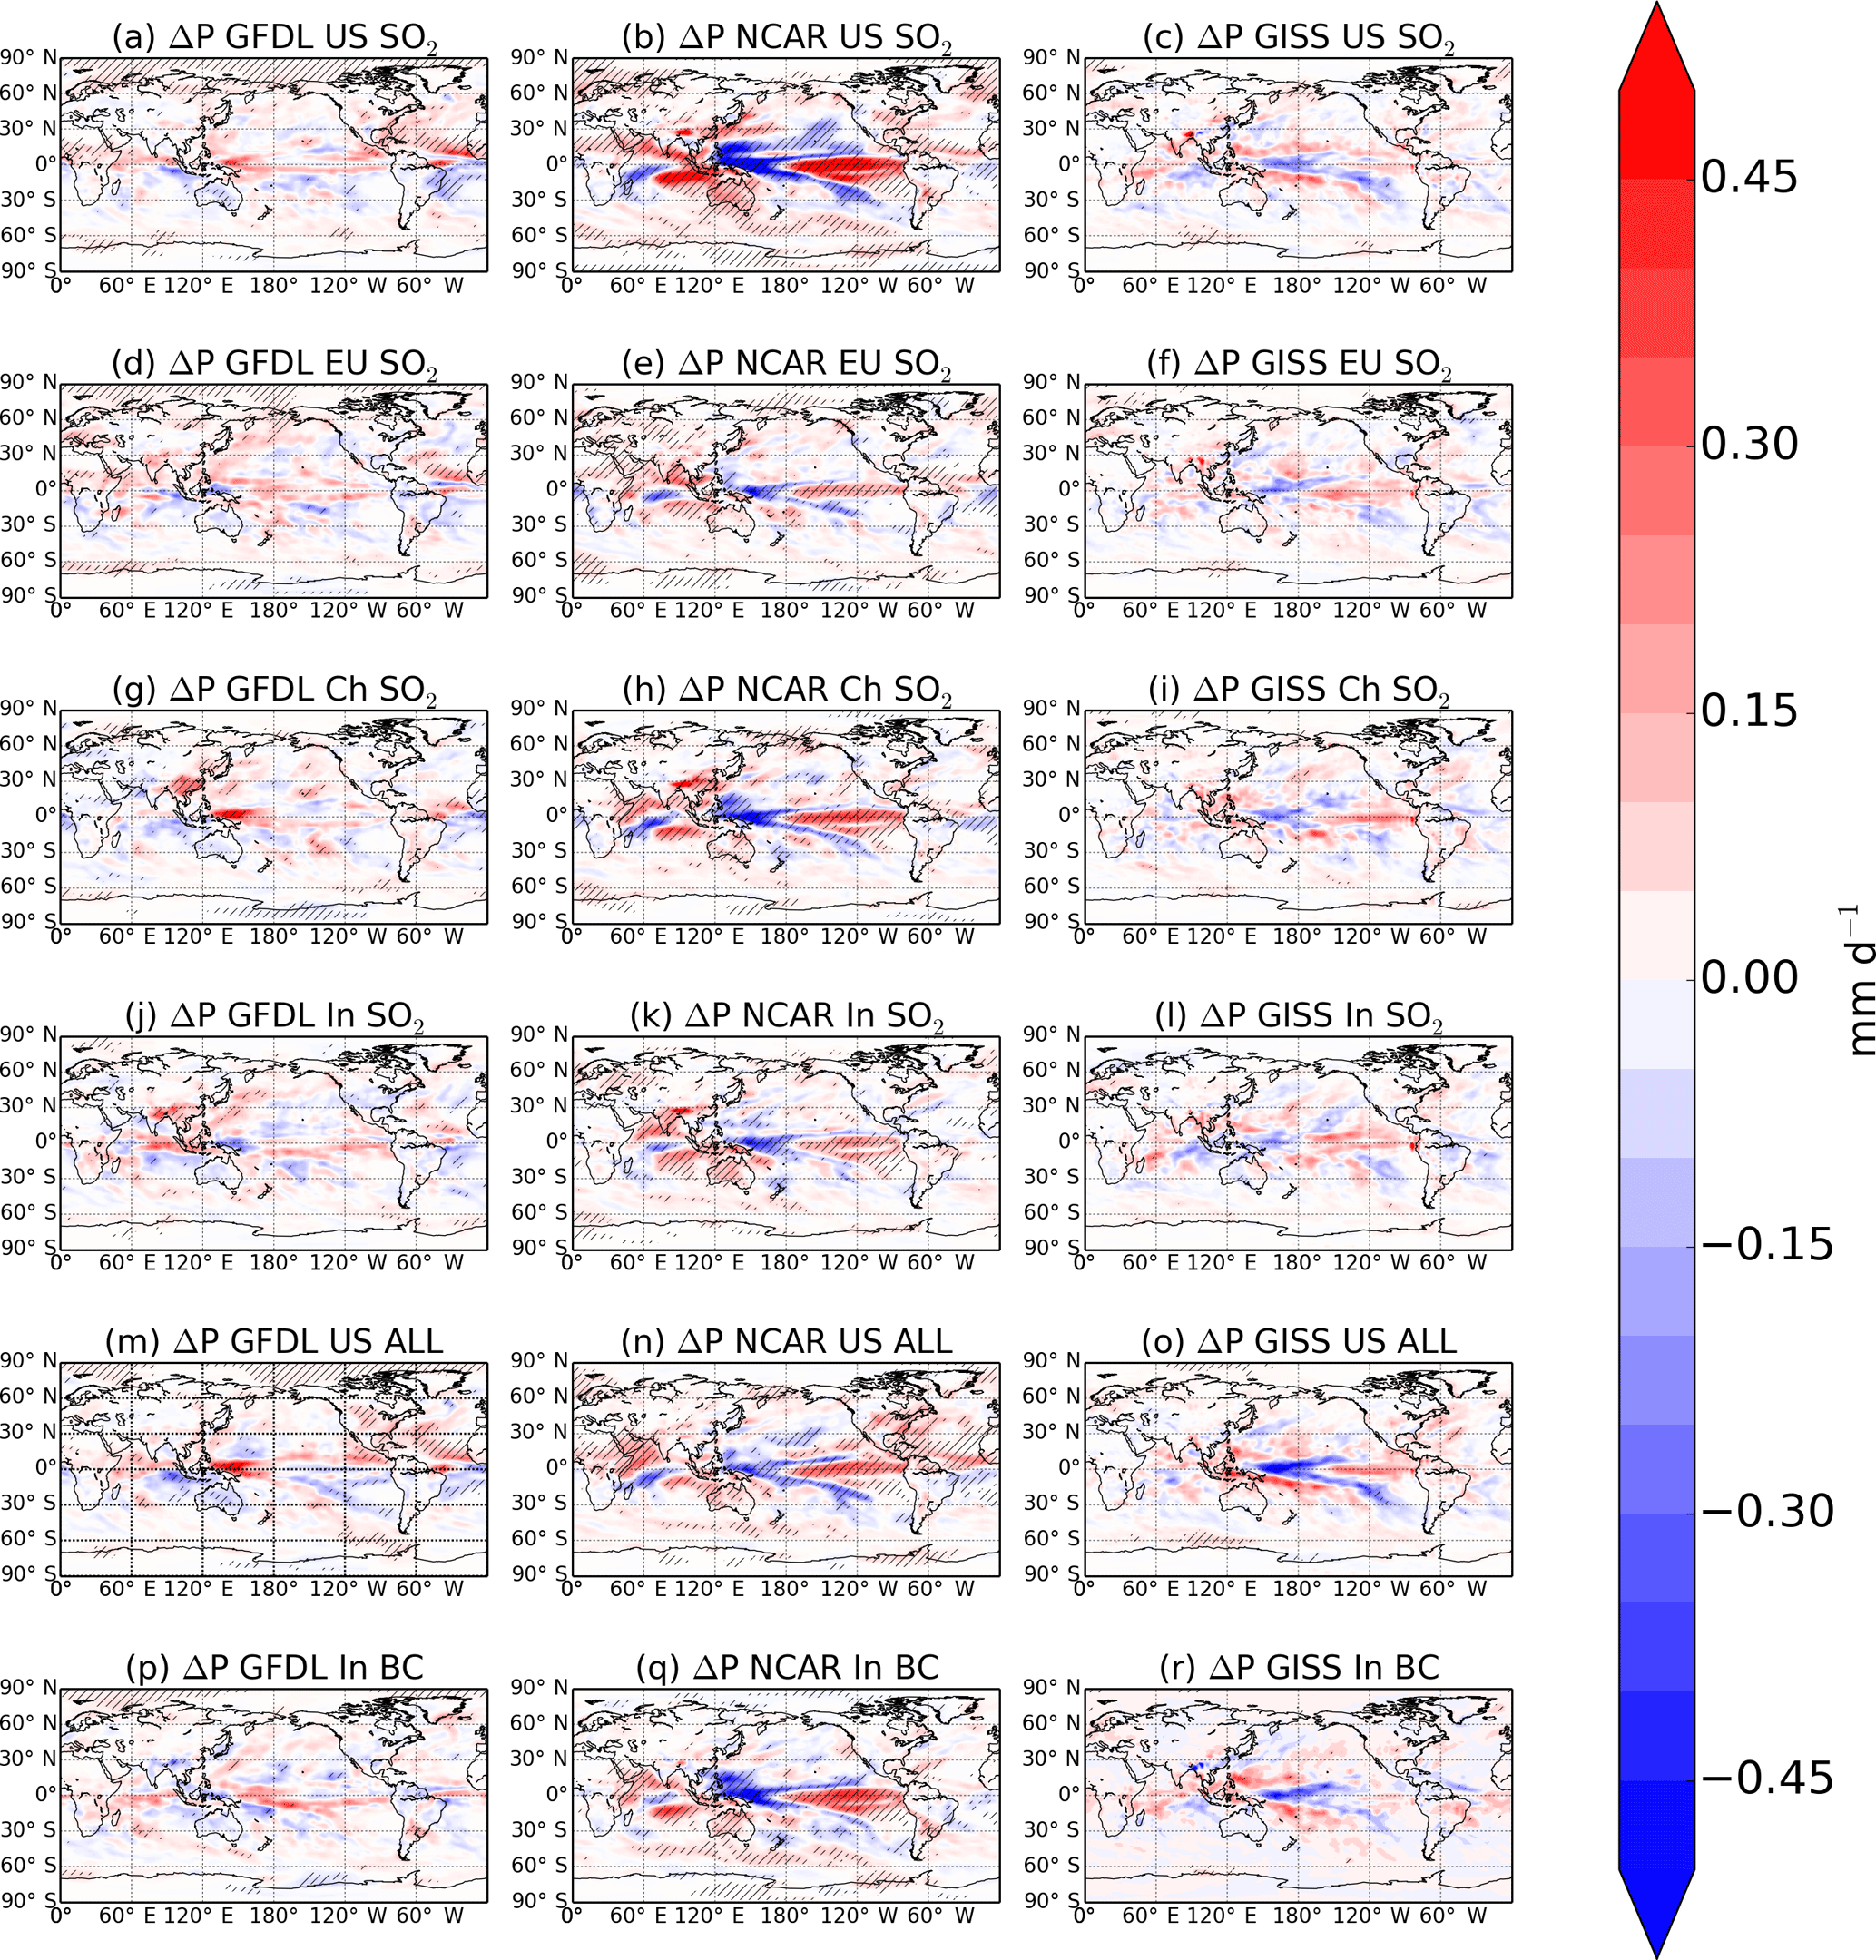
Figure 1200-year annual mean precipitation response to aerosol emissions decreases in each of the three models (GFDL-CM3, first column; NCAR-CESM1, second column; GISS-E2, third column) for several different regional emissions decreases (simulations indicated in figure titles; see Table 1). Hatching represents statistical significance at the 95 % level according to a Student's t test.
Figure 1 presents the annual mean precipitation response to a given aerosol emissions perturbation in each of the three models for six different perturbation simulations. The remaining simulations are presented in Fig. S1 in the Supplement. Hatching represents statistical significance at the 95 % level according to a simple Student's t test. Each plot is the difference between the perturbation simulation and the control (e.g., US_SO2 minus control), differenced at each exact month of the two simulations as done in Westervelt et al. (2017), and can therefore be interpreted as the precipitation response to decreasing regional aerosol emissions. The first row (Fig. 1a–c) is for zero US SO2 emissions and is discussed in detail in Westervelt et al. (2017). Generally, across all perturbations, precipitation responses are largest in NCAR-CESM1, followed by GFDL-CM3 and GISS-E2. GISS-E2 simulations were performed in a setup that does not include a cloud lifetime effect (Schmidt et al., 2014), contributing to a smaller aerosol effective radiative forcing (Table 1 and Fig. S2) and a weaker precipitation response in that model.
Global mean aerosol effective radiative forcing values for each of the models are shown in Table 1, and a scatterplot of global mean precipitation changes versus global mean aerosol effective forcing at the top of the atmosphere (TOA) is presented in Fig. S2. The aerosol ERF values are largest in NCAR-CESM1, followed by GFDL-CM3 and GISS-E2. Aerosol ERF is a factor of 2 or 3 smaller in GISS-E2 than in GFDL-CM3 and NCAR-CESM1 for some simulations. Overall, aerosol ERF is largest in NCAR-CESM1, ranging from 0 to 0.3 W m−2 depending on the regional aerosol perturbation. Across the models, we find a strong to medium linear relationship between global precipitation response and global effective radiative forcing in GFDL-CM3 (r=0.70) and GISS-E2 (r=0.5), but poor correlation in NCAR-CESM1 (r=0.23). Although global precipitation responses are known to be constrained by the atmospheric energy budget (Allen and Ingram, 2002; Ming et al., 2010; Liu et al., 2018), we find weaker correlation (e.g., for GFDL-CM3) between global precipitation response and atmospheric absorption (TOA minus surface forcing) when compared to global precipitation and TOA forcing alone. Samset et al. (2016) and Liu et al. (2018) found strong correlation between global precipitation “fast” response and atmospheric absorption. Their analysis correlated precipitation responses from fixed SST simulations with aerosol ERF, whereas our analysis in Fig. S2 correlates precipitation responses from coupled model simulations with aerosol ERF, which may explain the discrepancy. Global precipitation may also be an imperfect metric for correlation if opposite-signed regional changes are largely offset in the global mean. Recently, Chung and Soden (2017) showed that aerosol indirect effects could dominate precipitation responses to aerosol perturbations, consistent with our finding that GISS-E2, lacking an aerosol cloud lifetime effect, has the smallest precipitation response.
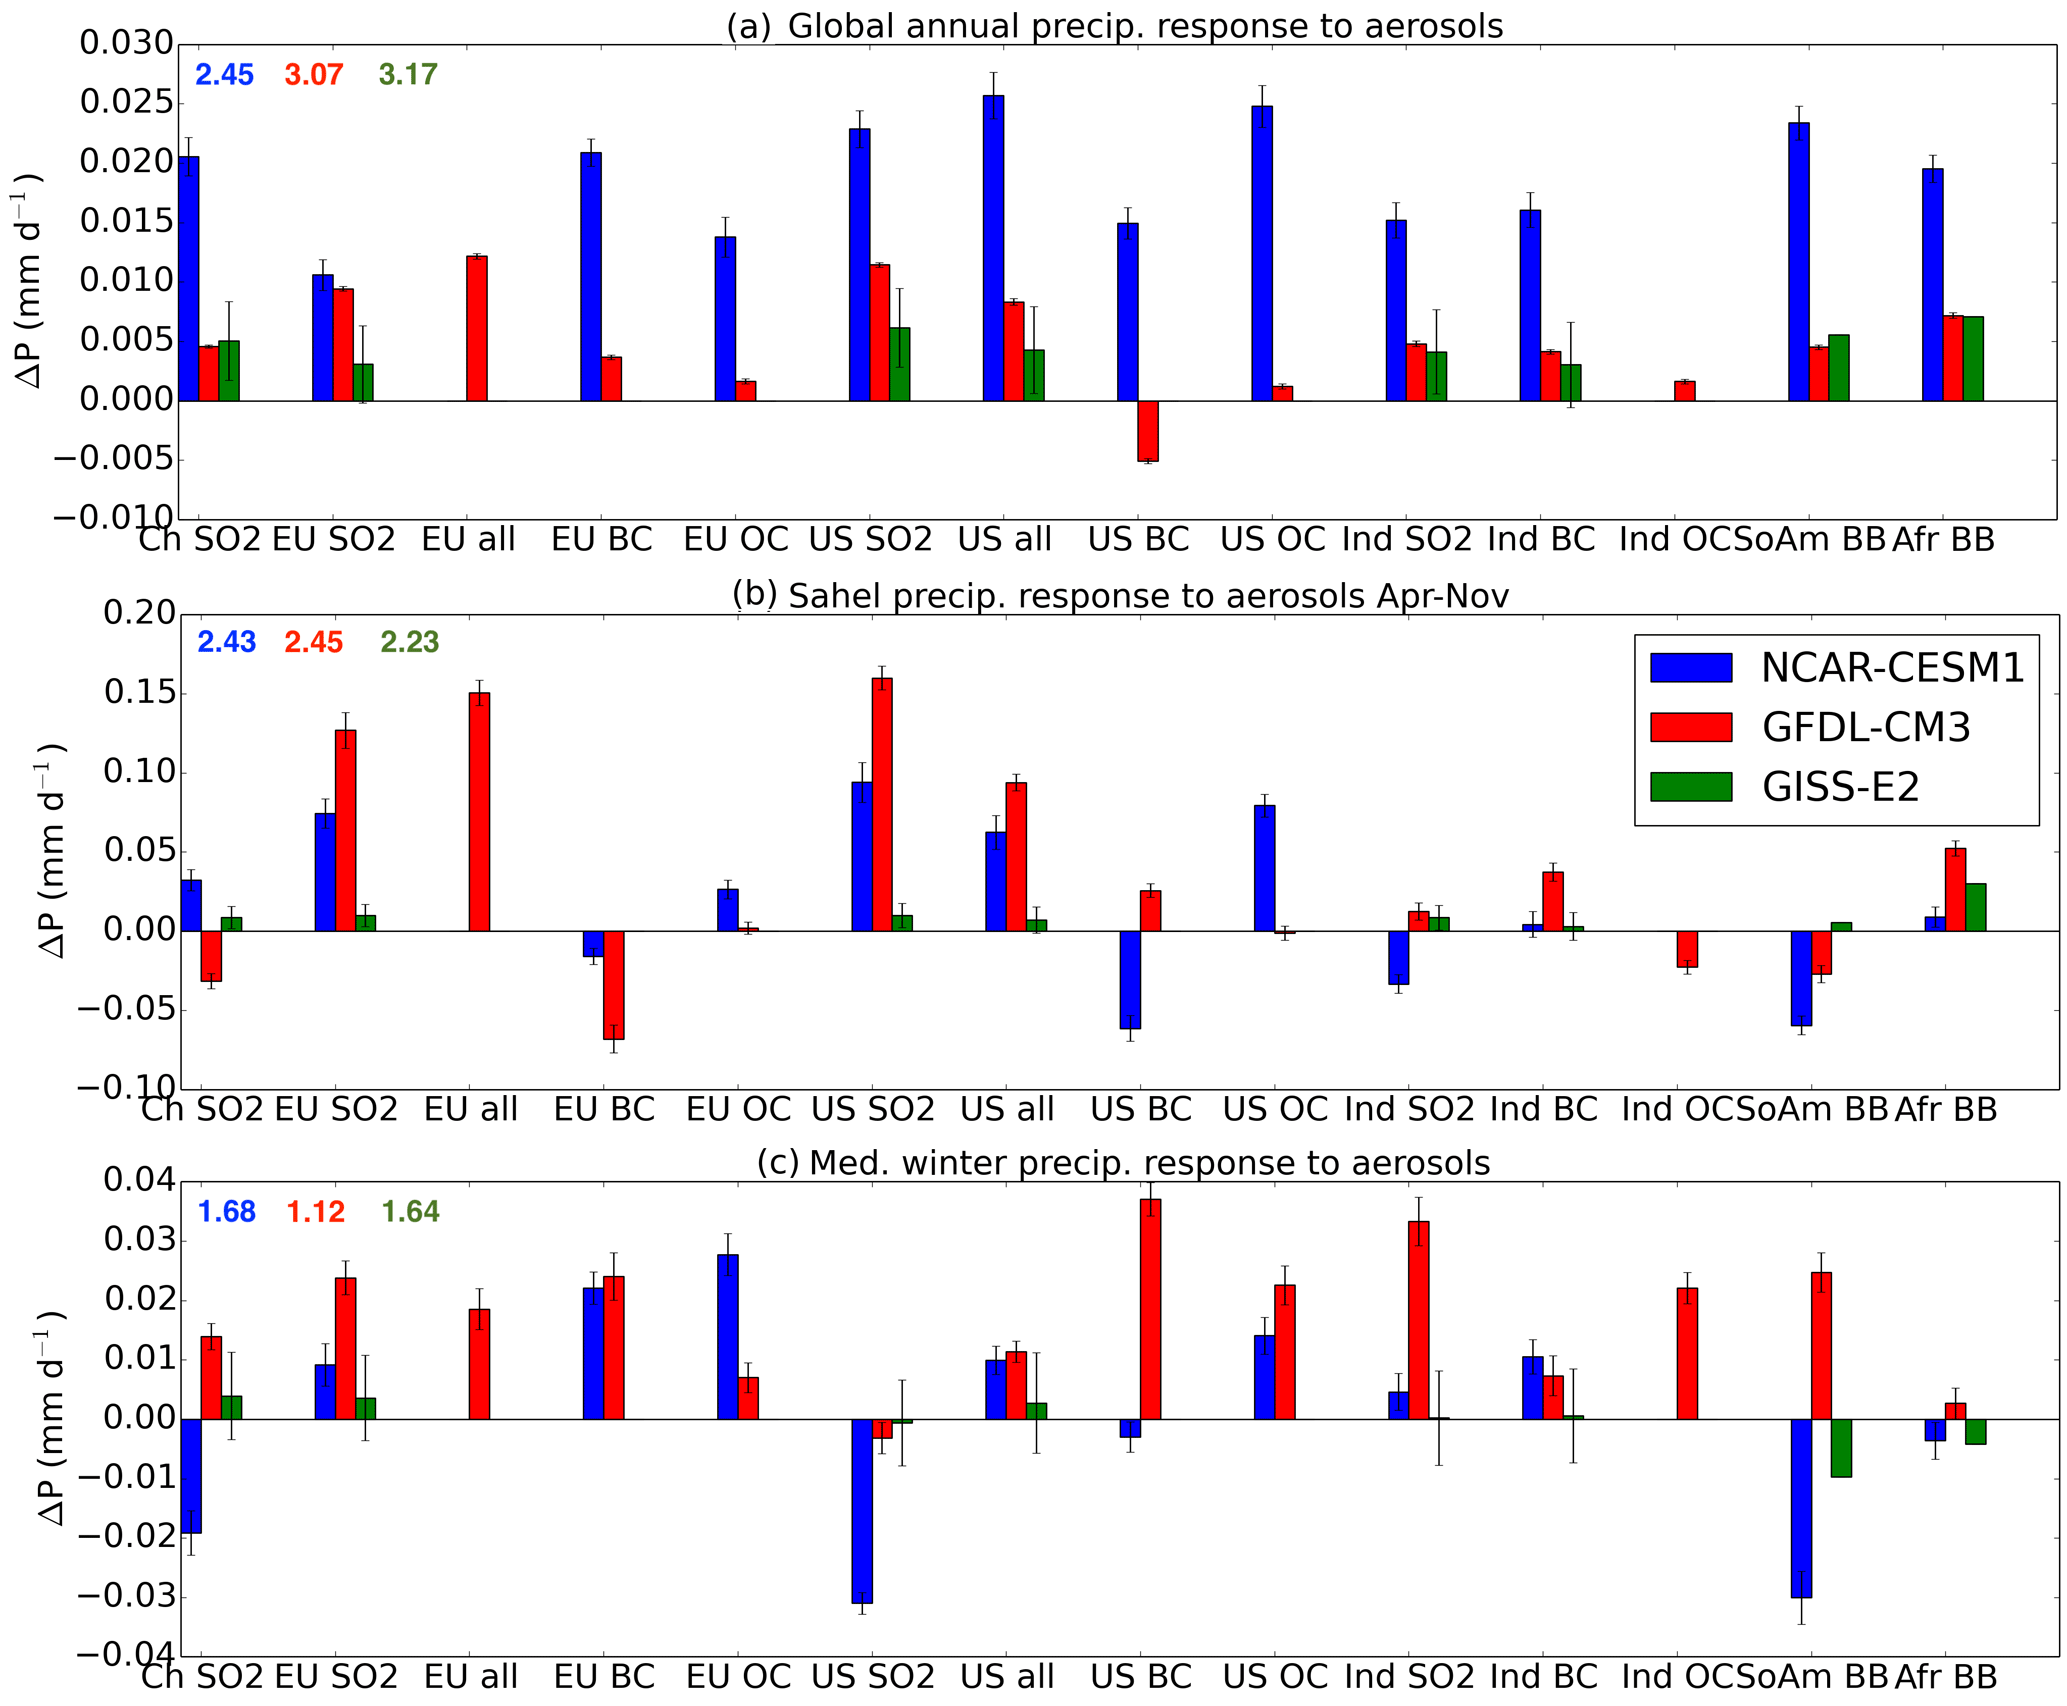
Figure 2Regional and global precipitation response to each individual aerosol emissions decrease (Table 1). (a) Global annual, (b) Sahel for June–September, (c) Mediterranean for October–March. Error bars represent ±1σ. Values in the upper left of each panel are control mean precipitation values for each region and time period for each model (green: GISS-E2, red: GFDL-CM3, blue: CESM1).
In Fig. 2, we present precipitation responses (perturbation minus control, representing aerosol decreases, as in Fig. 1) globally averaged and averaged over two regions (which are shown in Sect. 4), the Sahel and the Mediterranean. The numbers in the upper left of each panel of Fig. 2 represent the mean precipitation for the control run for each region and each time period. Figure 2 shows that the global precipitation responses (Fig. 2a) nearly always agree in the three models. In general, NCAR-CESM1 responds the strongest to aerosol decreases, with increases in global mean precipitation up to about 0.025 mm d−1 or about 1 % of the global mean in the control simulation. Global precipitation changes in GISS-E2 and GFDL-CM3 are similar in magnitude in many of the aerosol perturbation scenarios. A total of 33 out of 34 model simulations among the various regional emissions perturbations result in a global annual mean increase in precipitation, the one exception being US_BC in GFDL-CM3 (not statistically significant). In addition to heating the surface, BC removal results in cooling aloft in the free troposphere and an increase in shortwave radiation at the surface, both of which can drive convective updrafts and result in precipitation increases. This “fast response” of precipitation to BC reductions tends to dominate the total response to BC, as shown in the Precipitation Driver Response Model Intercomparison Project (PDRMIP) results (Samset et al., 2016; Liu et al., 2018). Despite opposite-signed aerosol ERF (Table 1) between BC and sulfate perturbation simulations among the models, global precipitation responses are often in agreement in sign (e.g., EU_BC and EU_SO2 in NCAR-CESM1 and GFDL-CM3). Because of the surface heating influence of BC compared to the cooling effects of sulfate, previous research has shown that BC and sulfate perturb precipitation in opposite directions (Wang, 2007; Ramanathan and Carmichael, 2008). Our results here, while still somewhat inconclusive, suggest that in some cases, BC emissions decreases may actually increase global and regional precipitation, similar to sulfate. The black carbon aerosol global mean ERF (Table 1) varies in sign and magnitude, indicating a strong sensitivity to different model configurations for black carbon and perhaps a role for internal climate variability. In many of the black carbon simulations, the global mean aerosol ERF values reported are not statistically significant. This result highlights the fact that the influence of BC on global precipitation is still largely uncertain (Pendergrass and Hartmann, 2012; Liu et al., 2018) with major knowledge gaps still remaining (Bond et al., 2013).
4.1 Sahel (20∘ W–40∘ E, 10–20∘ N)
In the Sahel, we find mostly increases in mean wet season (June through September) precipitation due to the removal of aerosol and precursor emissions for nearly all regional emission perturbation simulations and models. For example, in GFDL-CM3 and NCAR-CESM1, reducing US SO2 emissions (Fig. 1a, b), European SO2 emissions (Fig. 1d, e), Chinese SO2 emissions (Fig. 1g, h), and US SO2 + BC + OC (Fig. 1m, n) induces a similar precipitation increase over the Sahel. This indicates that decreasing aerosol and aerosol precursor emissions in places like the US, Europe, and China will increase rainfall over the Sahel by strengthening and shifting the northern edge of the ITCZ northward into the Sahel. This phenomenon is mostly not present in GISS-E2, which we partially attribute to the smaller aerosol forcing (ERF) and thus a smaller and insignificant (or nonexistent) interhemispheric temperature gradient (see Figs. 3 and 4 and associated discussion).
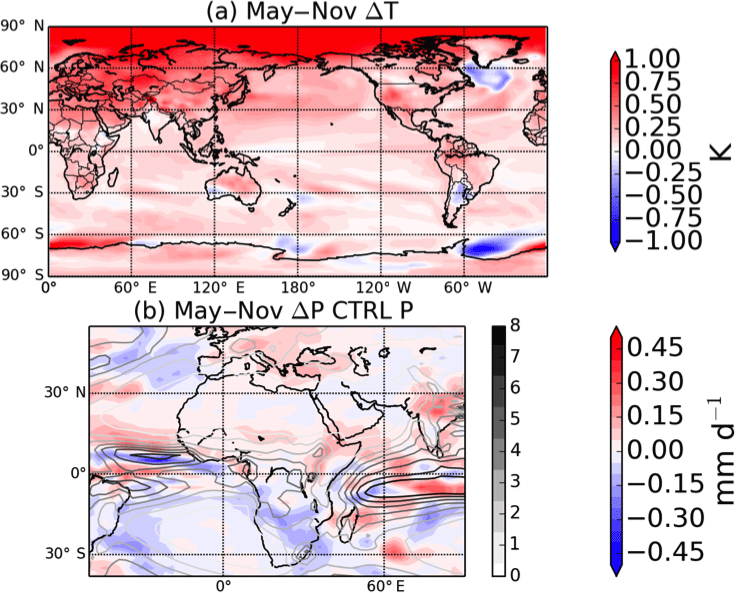
Figure 3Climate response in GFDL-CM3 to the removal of European sulfur dioxide emissions. (a) Change in May–November mean surface temperature over a 200-year simulation (b) Change in mean May–November precipitation (colors). Control precipitation values shown in gray.
Figure 2b shows the change in wet season Sahel rainfall for all models and all simulations. Error bars indicate ±1 SE of the mean. Out of the 34 model simulations conducted, only 9 show decreases in precipitation over the Sahel. Thus, we conclude that aerosol emissions decreases in regions around the world are likely to bring additional rainfall to the Sahel. Similarly, our results agree with findings that aerosol and precursor emissions increases in the mid-20th century may have contributed to the mid-20th century Sahel drought (Biasutti and Giannini, 2006). The largest responses in Sahel rainfall occur in NCAR-CESM1, particularly in the US_SO2, EU_SO2, and US_ALL simulations, in which increases in average wet season rainfall are as high as about 0.25 mm d−1 or 10 % compared to the control simulation seasonal mean. These precipitation increases point to potential remote impacts of decreasing pollution in major emitting regions like the US and Europe, where emission reductions as a result of air pollution regulation may help reduce the likelihood and severity of future droughts in the Sahel. The models agree in the sign of the Sahel precipitation impact in 7 of the 12 perturbation simulations (only including the simulations that at least two models conducted). Small error bars in many of the simulations conducted with NCAR-CESM1 and GFDL-CM3 indicate statistical significance. We identify below a physical mechanism that explains these increases (Haywood et al., 2015; Stephens et al., 2015) and show that it is consistent across multiple models and aerosol simulations.
Westervelt et al. (2017) and references therein argued that an anomalous warming in the Northern Hemisphere compared to the Southern Hemisphere due to the removal of SO2 emissions from the US produces a summertime (June–July–August) strengthening and a northward shift of the ITCZ, thereby delivering more wet season rainfall to the Sahel. We find a similar interhemispheric temperature gradient mechanism (defined as the difference between the entire Northern Hemisphere and Southern Hemisphere temperature response to aerosol removal) in the EU_SO2 simulation (Fig. 3). Removal of European sulfur dioxide causes an anomalous heating of the Northern Hemisphere (+0.34 K vs. 0.11 K in the Southern Hemisphere), including a large aerosol-induced warming response in the Arctic (Wang et al., 2018). The enhancement of the northern flank of the ITCZ and the accompanying northward shift is demonstrated in Fig. 3b, which compares the control precipitation climatology (grayscale lines) to the responses (red–blue scale) over the Sahel. Furthermore, using the precipitation centroid method of Frierson and Hwang (2012), we find a northern shift of the precipitation center of 0.1∘ latitude. Removal of either US or European aerosols results in strong anomalous warming of the Northern Hemisphere and thus precipitation enhancement in the Sahel.
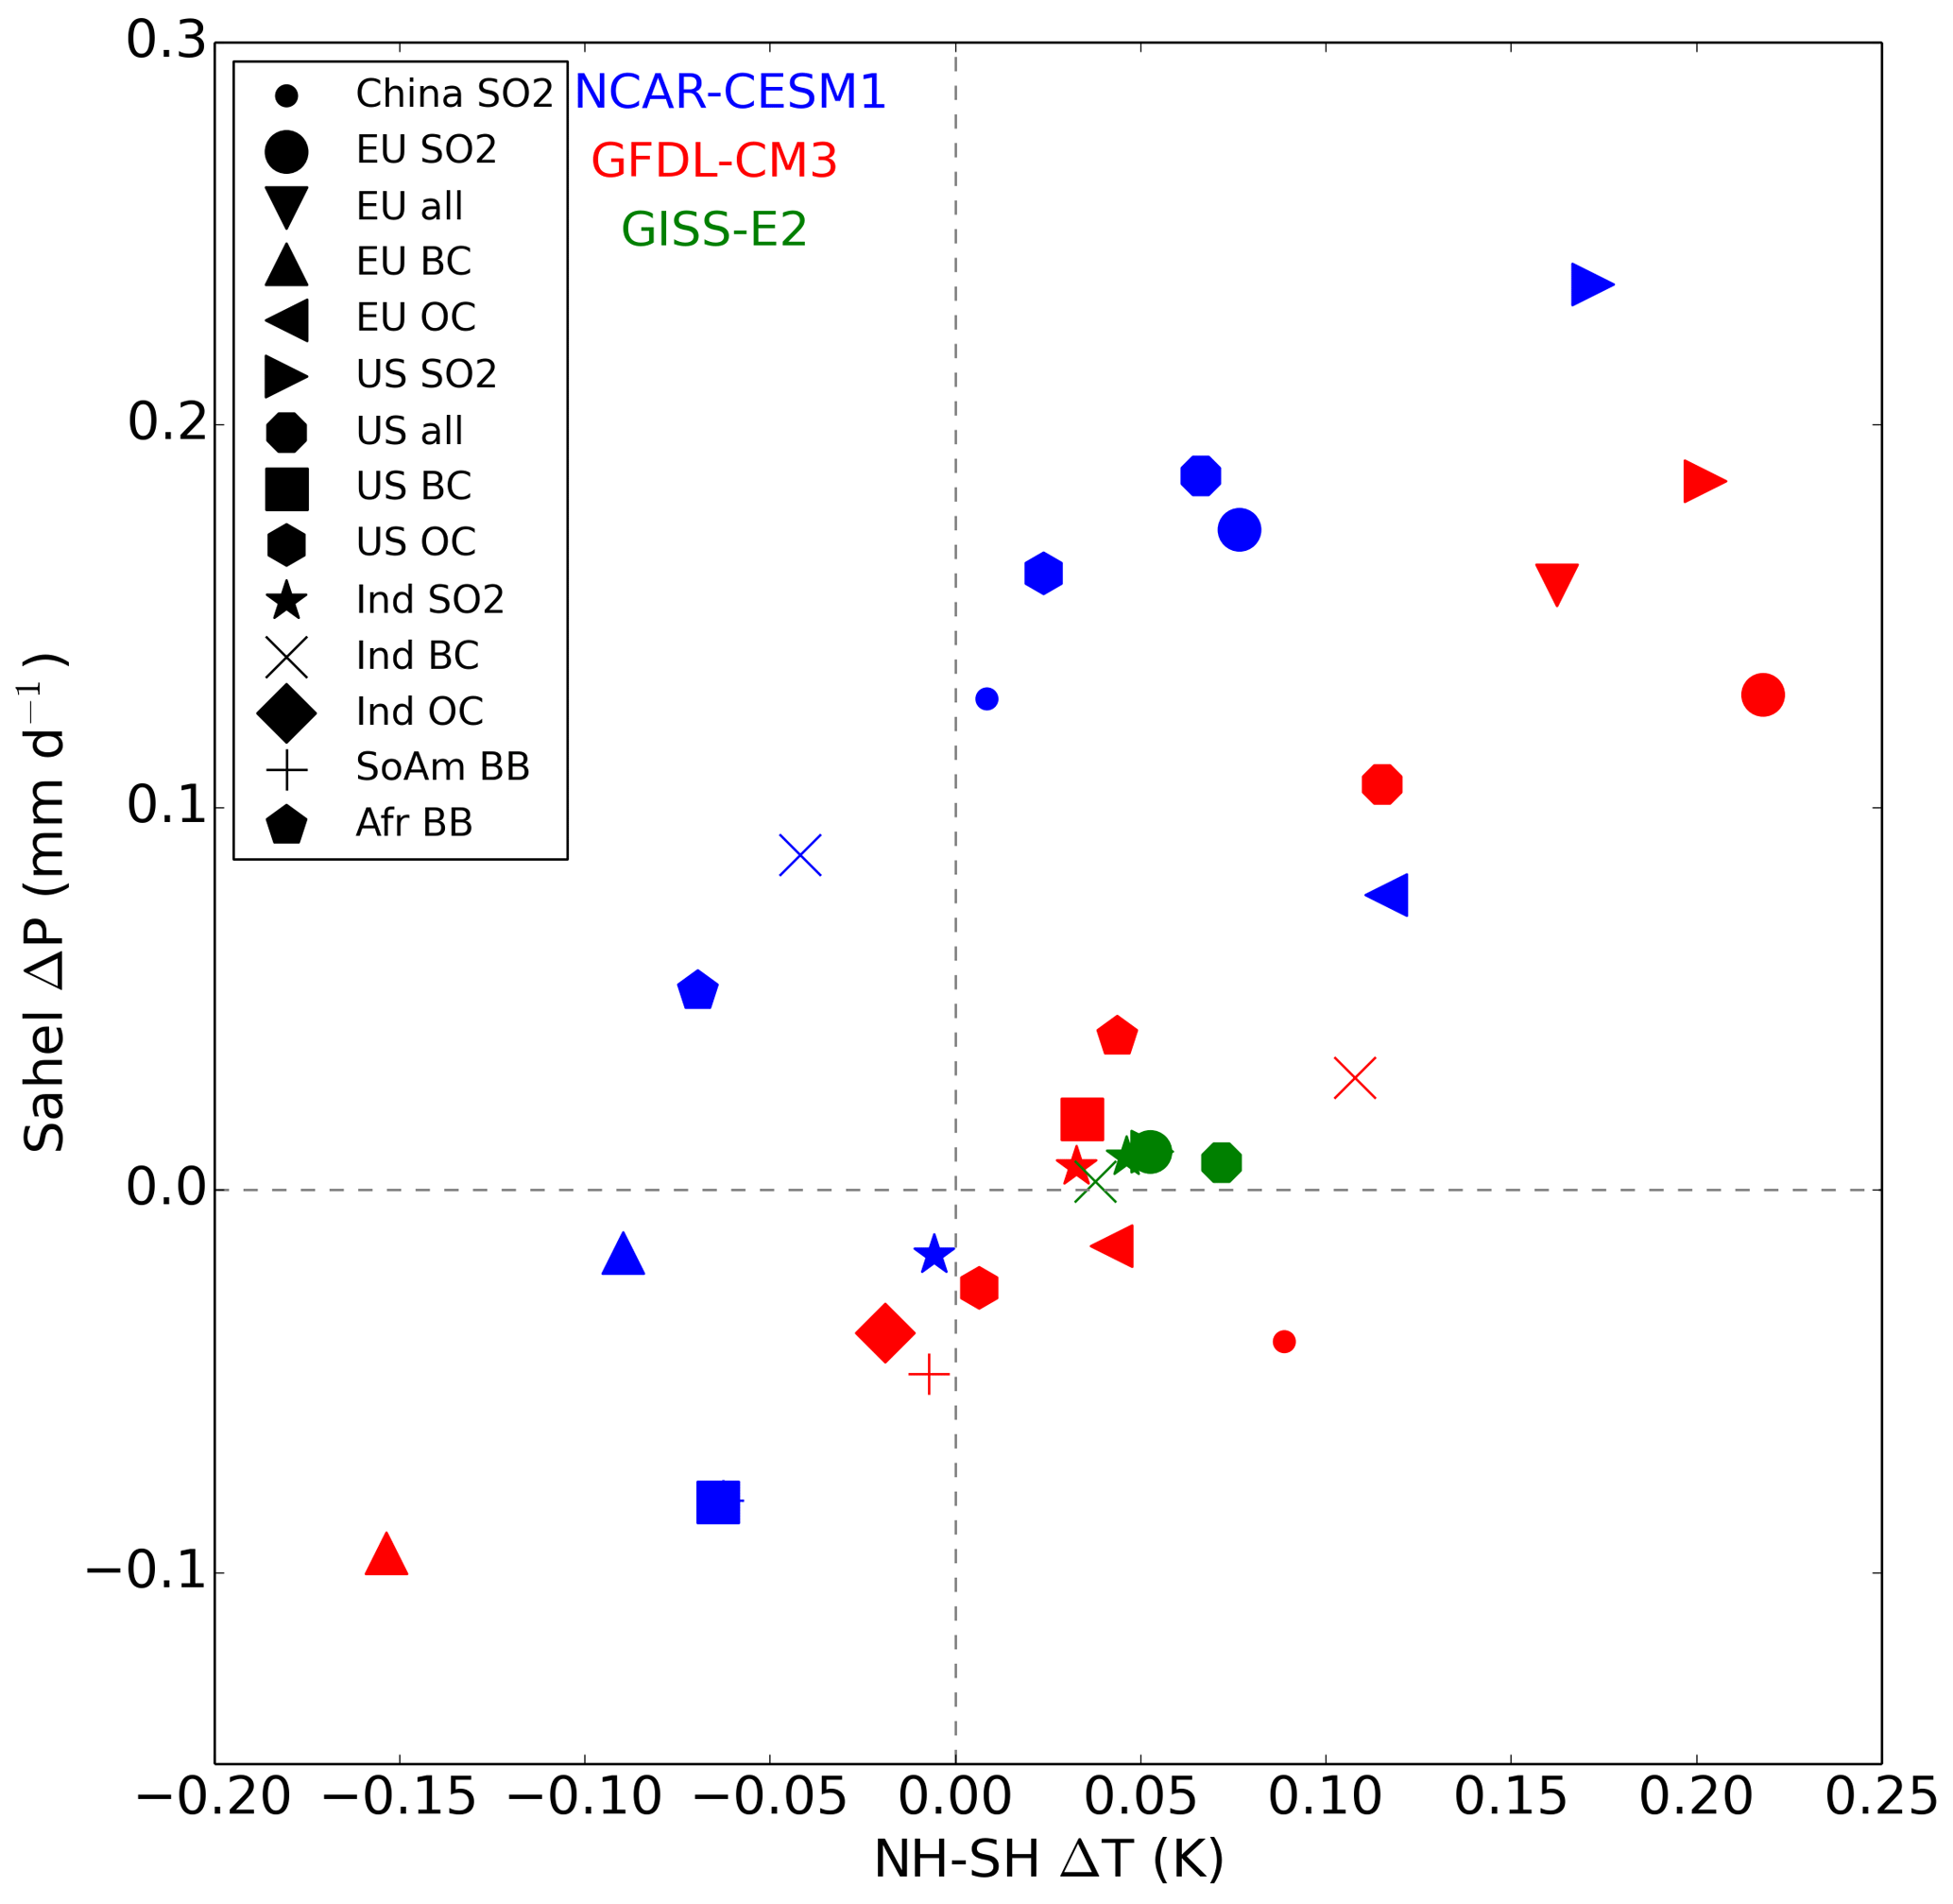
Figure 4Scatterplot of Sahel precipitation change (June–September mean) due to aerosol regional emissions perturbations (symbols) and change in the interhemispheric temperature gradient in GFDL-CM3 (red), NCAR-CESM1 (blue), and GISS-E2 (green).
In Fig. 4, we explore the robustness of this mechanism across our full set of regional aerosol emission perturbation simulations and find that the change in Sahel wet season precipitation correlates with the change in interhemispheric temperature gradient induced by removing regional aerosol emissions in the GFDL-CM3 model (r=0.89; Fig. 4, red symbols). In other words, when the change in the interhemispheric temperature gradient is strongly positive in a given aerosol perturbation simulation signifying anomalous warming of the Northern Hemisphere relative to the Southern Hemisphere, Sahel precipitation is enhanced. The notable exception to this is EU_BC, which causes a strong negative temperature gradient change due to the Northern Hemisphere cooling response from BC removal. When the gradient change is weak or even negative (e.g., EU_BC, upward triangle; IN_OC, diamond), precipitation in the Sahel slightly decreases due to aerosol removal. The strength of the linear correlation illustrated in Fig. 4 suggests that the mechanism proposed in Westervelt et al. (2017) for US_SO2 is robust for other regional aerosol emissions changes and is therefore the dominant factor in GFDL-CM3 in explaining how regional aerosol emissions from remote regions around the world impact rainfall in the Sahel.
We find a similarly strong correlation in NCAR-CESM1 (r=0.77; blue symbols, Fig. 4). This qualitative agreement between NCAR-CESM1 and GFDL-CM3 lends confidence to this mechanism of an anomalous Hadley cell circulation accompanied by a northward ITCZ shift that leads to Sahel rainfall increases when US and European aerosol emissions are reduced. In GISS-E2, there is no discernible interhemispheric temperature gradient in the response to Northern Hemisphere aerosol emissions removal (Westervelt et al., 2017) and, correspondingly, no statistically significant change in Sahel rainfall (Fig. 4, green symbols). Although GISS-E2 differs from GFDL-CM3 and NCAR-CESM1, the nonresponse in precipitation and the lack of a change in the interhemispheric temperature gradient is consistent with our identified physical mechanism. The overall r value combined across all three models is 0.70, indicating a robust relationship across the models.
4.2 Mediterranean (20∘ W–40∘ E, 10–20∘ N)
We show changes in wintertime (October through March) Mediterranean precipitation rates due to regional aerosol reductions in Fig. 2c. Aerosol decreases around the world mainly act to increase precipitation in the Mediterranean, with only 9 of the 34 model simulations resulting in precipitation decreases. The models agree on sign in 8 out of the 12 perturbation simulations in which at least two models were included. Locally, the European aerosol reduction simulations (EU_SO2, EU_all, EU_BC, and EU_OC) indicate enhanced precipitation in all models. In contrast, reductions of SO2 emissions in the US lead to precipitation decreases over Europe in all models, with a substantial decrease indicated by NCAR-CESM1. However, reductions of other aerosol types in the US generally result in increases in Mediterranean precipitation. Our results point to a statistically significant role for aerosol forcing in contributing to drying and wetting trends in the Mediterranean. The fairly consistent drying impact of regional BC emissions and opposing impacts of regional SO2 emissions may account for the results of a prior multi-model analysis that found strong drying impacts from global BC but weak impacts of global sulfate (Tang et al., 2018). Error bars are generally larger in the Mediterranean than the Sahel (Fig. 2b), but are still small enough to indicate statistical significance at the 95 % confidence level for most of the simulations in NCAR-CESM1 and GFDL-CM3. The precipitation changes here are smaller in absolute and relative magnitude compared to the Sahel, with maximum precipitation increases for an individual perturbation simulation of about 0.04 mm d−1 or 3.5 % compared to the control simulation in GFDL-CM3. Shorter averaging periods over the peak rainy season (e.g., December and January) result in slighter larger precipitation increases of up to 5 %.
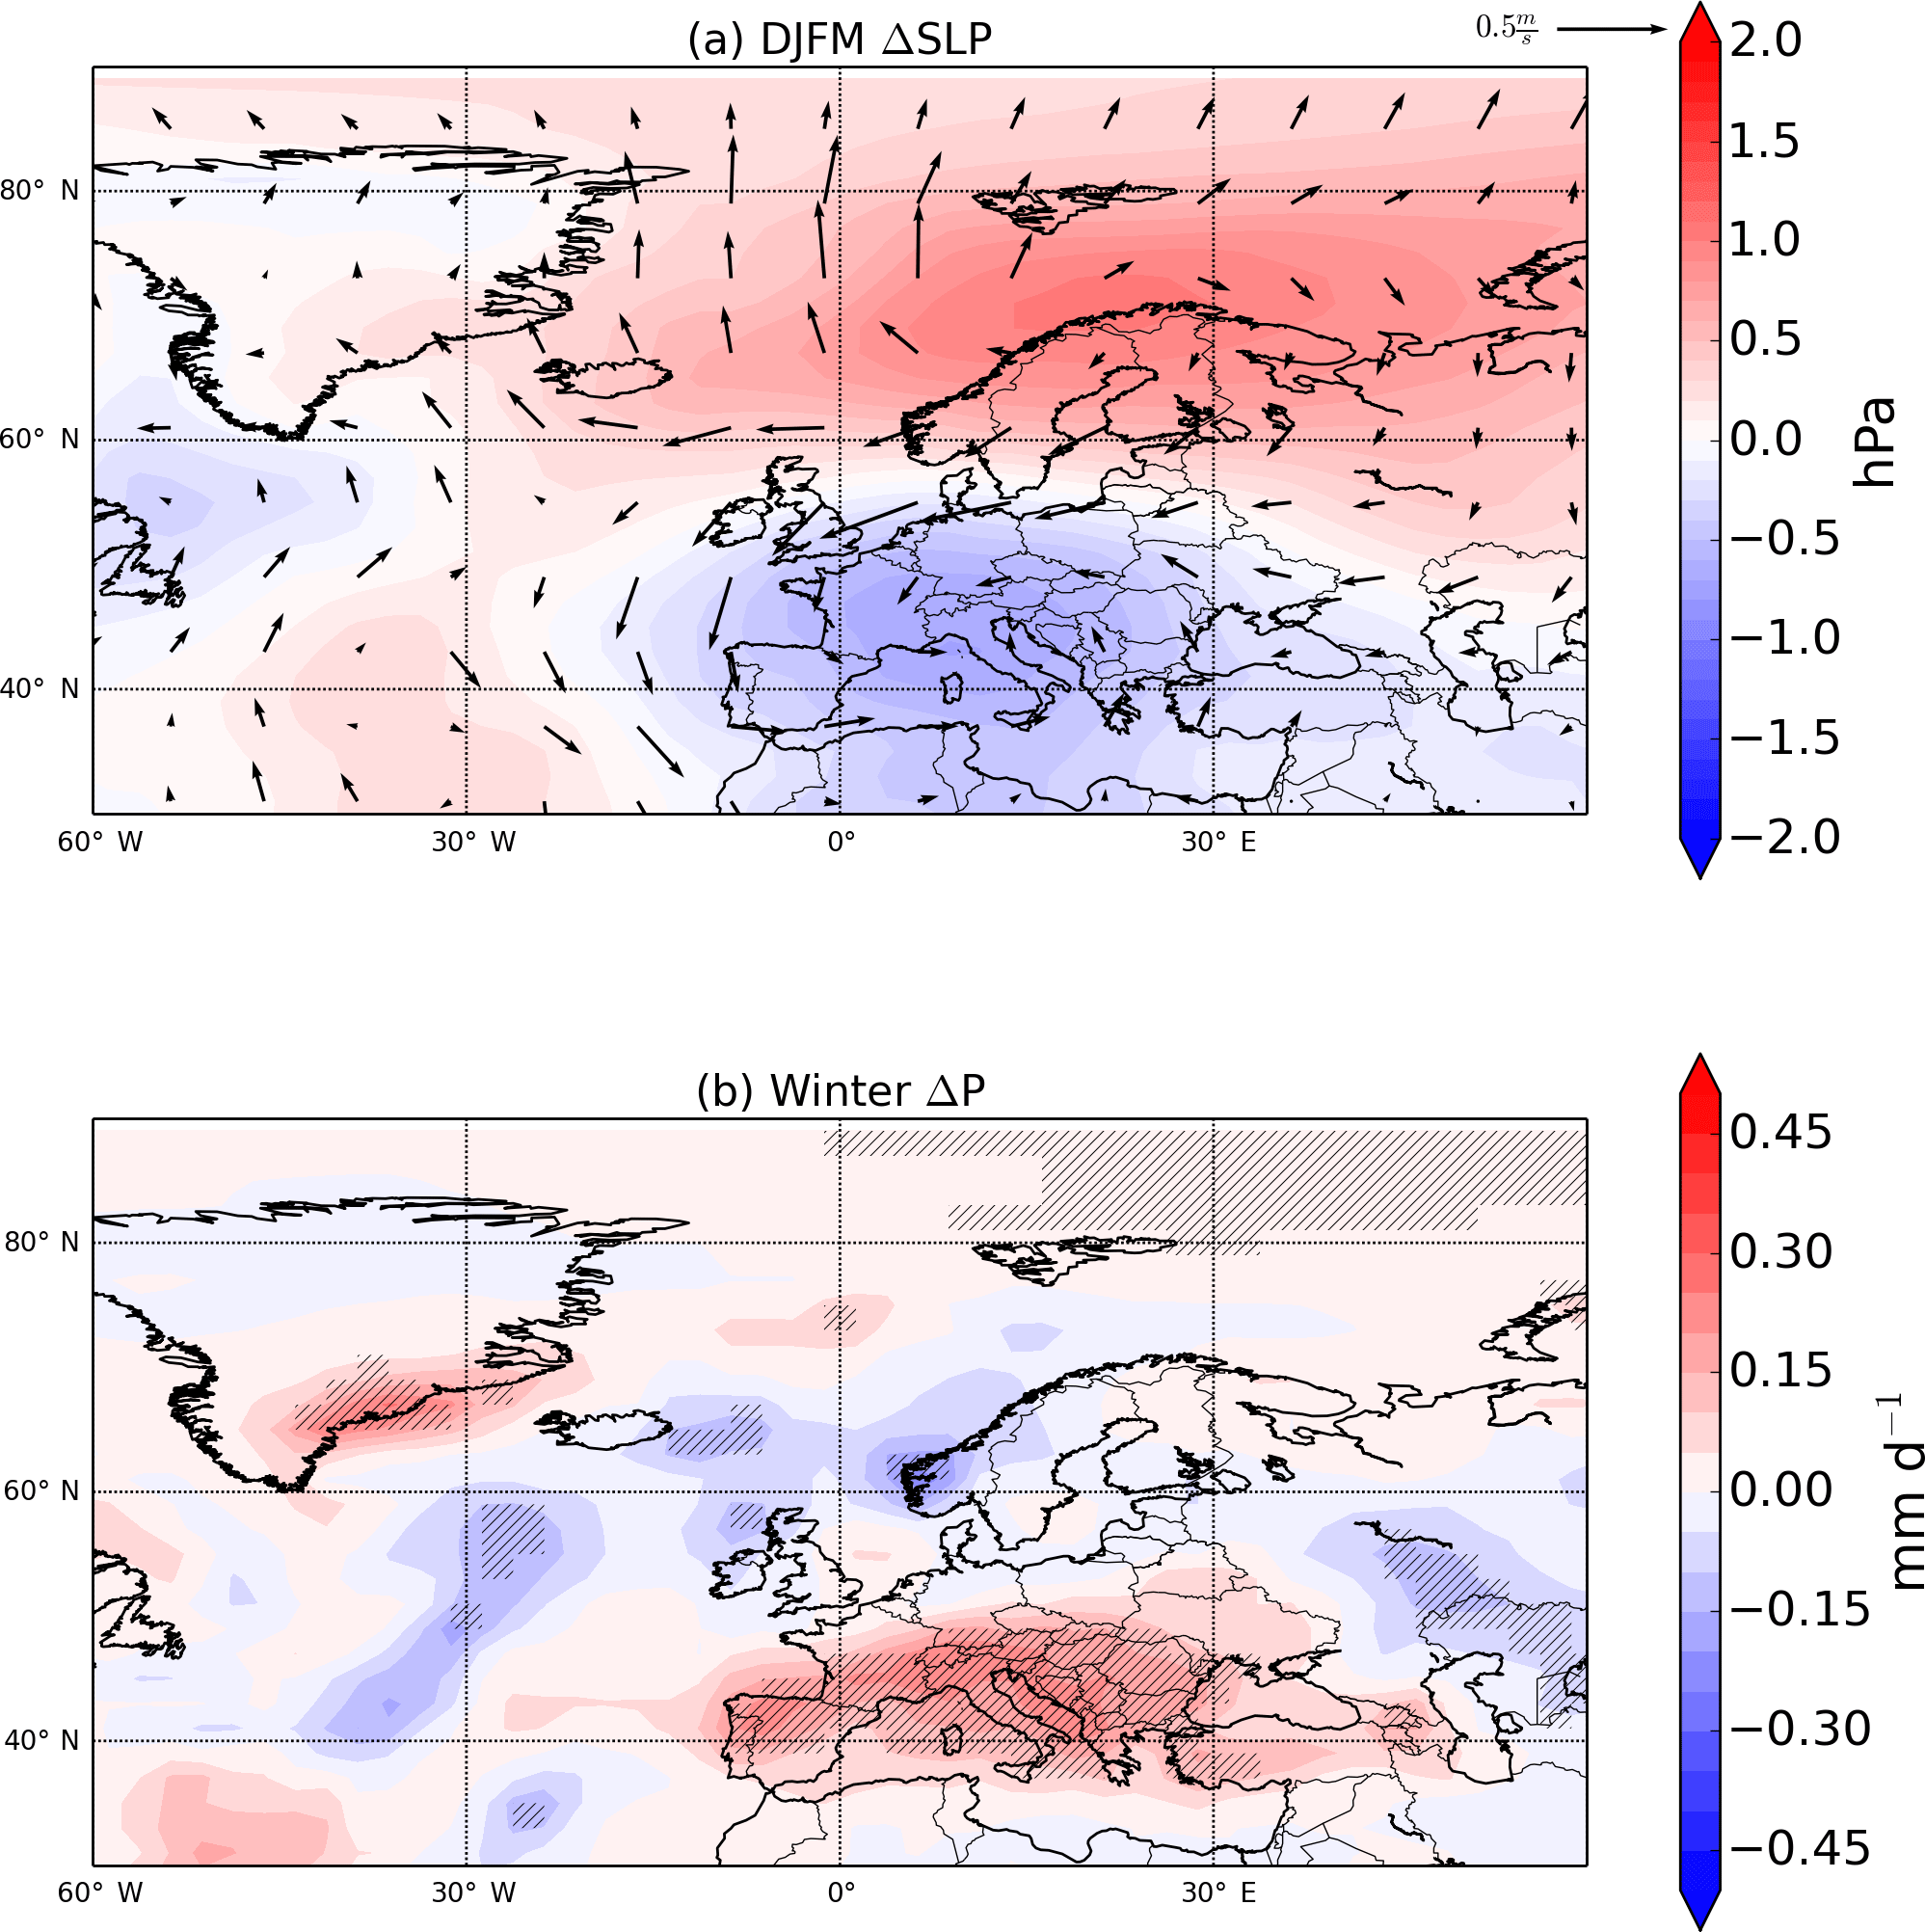
Figure 5Wintertime response in sea level pressure, surface winds (a), and precipitation (b) to an 80 % reduction of European SO2 emissions in GFDL-CM3. Hatching indicates statistical significance at the 95 % confidence level.
We also seek to understand the statistically significant precipitation enhancement in Europe and the Mediterranean that appears in several of our simulations, particularly in GFDL-CM3. Figure 5 shows the wintertime changes (December through March) in sea level pressure (SLP), near-surface winds (Fig. 5a), and precipitation (Fig. 5b) over Europe in GFDL-CM3. We find a strong, statistically significant north–south dipole pattern in SLP response to the removal of European SO2 emissions (EU_SO2, Fig. 5), European black carbon aerosol emissions (EU_BC, Fig. S4), European organic carbon emissions (EU_OC, Fig. S5), and all of the previous three types of European aerosol emissions combined (EU_ALL, Fig. S6). This results in a weakening of the prevailing westerlies and a southward shift of the storm track over the North Atlantic, leading to a drying in northern Europe and a statistically significant wetting in southern Europe (Figs. 5, S4–S6). This pattern resembles a shift towards the negative phase of the North Atlantic Oscillation (NAO), characterized by a weakened Iceland low and a weakened Azores high, which has been shown to bring drier conditions to northern Europe and wetter conditions to southern Europe and the Mediterranean (Hurrell, 1995; Visbeck et al., 2001). The mean climatological SLP pattern in the GFDL-CM3 control simulation (not shown) is centered further west than the anomalies shown in Fig. 5, suggesting that the effect of aerosols is also to shift the centers of action eastward. In NCAR-CESM1, we find that the removal of European aerosols results in an opposite north–south dipole response to GFDL-CM3 (Fig. S7) and little change in the centers of action. As a result, the precipitation response to European SO2 removal (EU_SO2) in the Mediterranean in NCAR-CESM1 is smaller than in GFDL-CM3, statistically insignificant, and not associated with weakened westerlies and a southward storm track shift. The precipitation response in GISS-E2 to decreases in European SO2 emissions is unique compared to the other two models, featuring neither a strong north–south dipole of SLP changes nor a statistically significant Mediterranean precipitation response (Fig. S8). As evidenced by the different circulation responses in the North Atlantic among the models, the impact that aerosols may have on the North Atlantic circulation is not robust across models. However, North Atlantic SLP and precipitation responses within GFDL-CM3 are statistically significant and consistent across several different aerosol perturbation simulations. Our results in GFDL-CM3 are consistent with findings in CAM3 (an older version of the atmospheric component of NCAR-CESM1) that show a positive NAO-like response to increasing aerosols (Allen and Sherwood, 2011) and results from the PDRMIP models that showed a northward shift of the storm track over the North Atlantic and drying over the Mediterranean in response to BC (Tang et al., 2018). There is little contribution from ENSO to the precipitation response to aerosol removal in all simulations in all models (Sect. 5, Fig. 6) over the Mediterranean, suggesting that ENSO teleconnections cannot explain the modeled precipitation changes over this region.
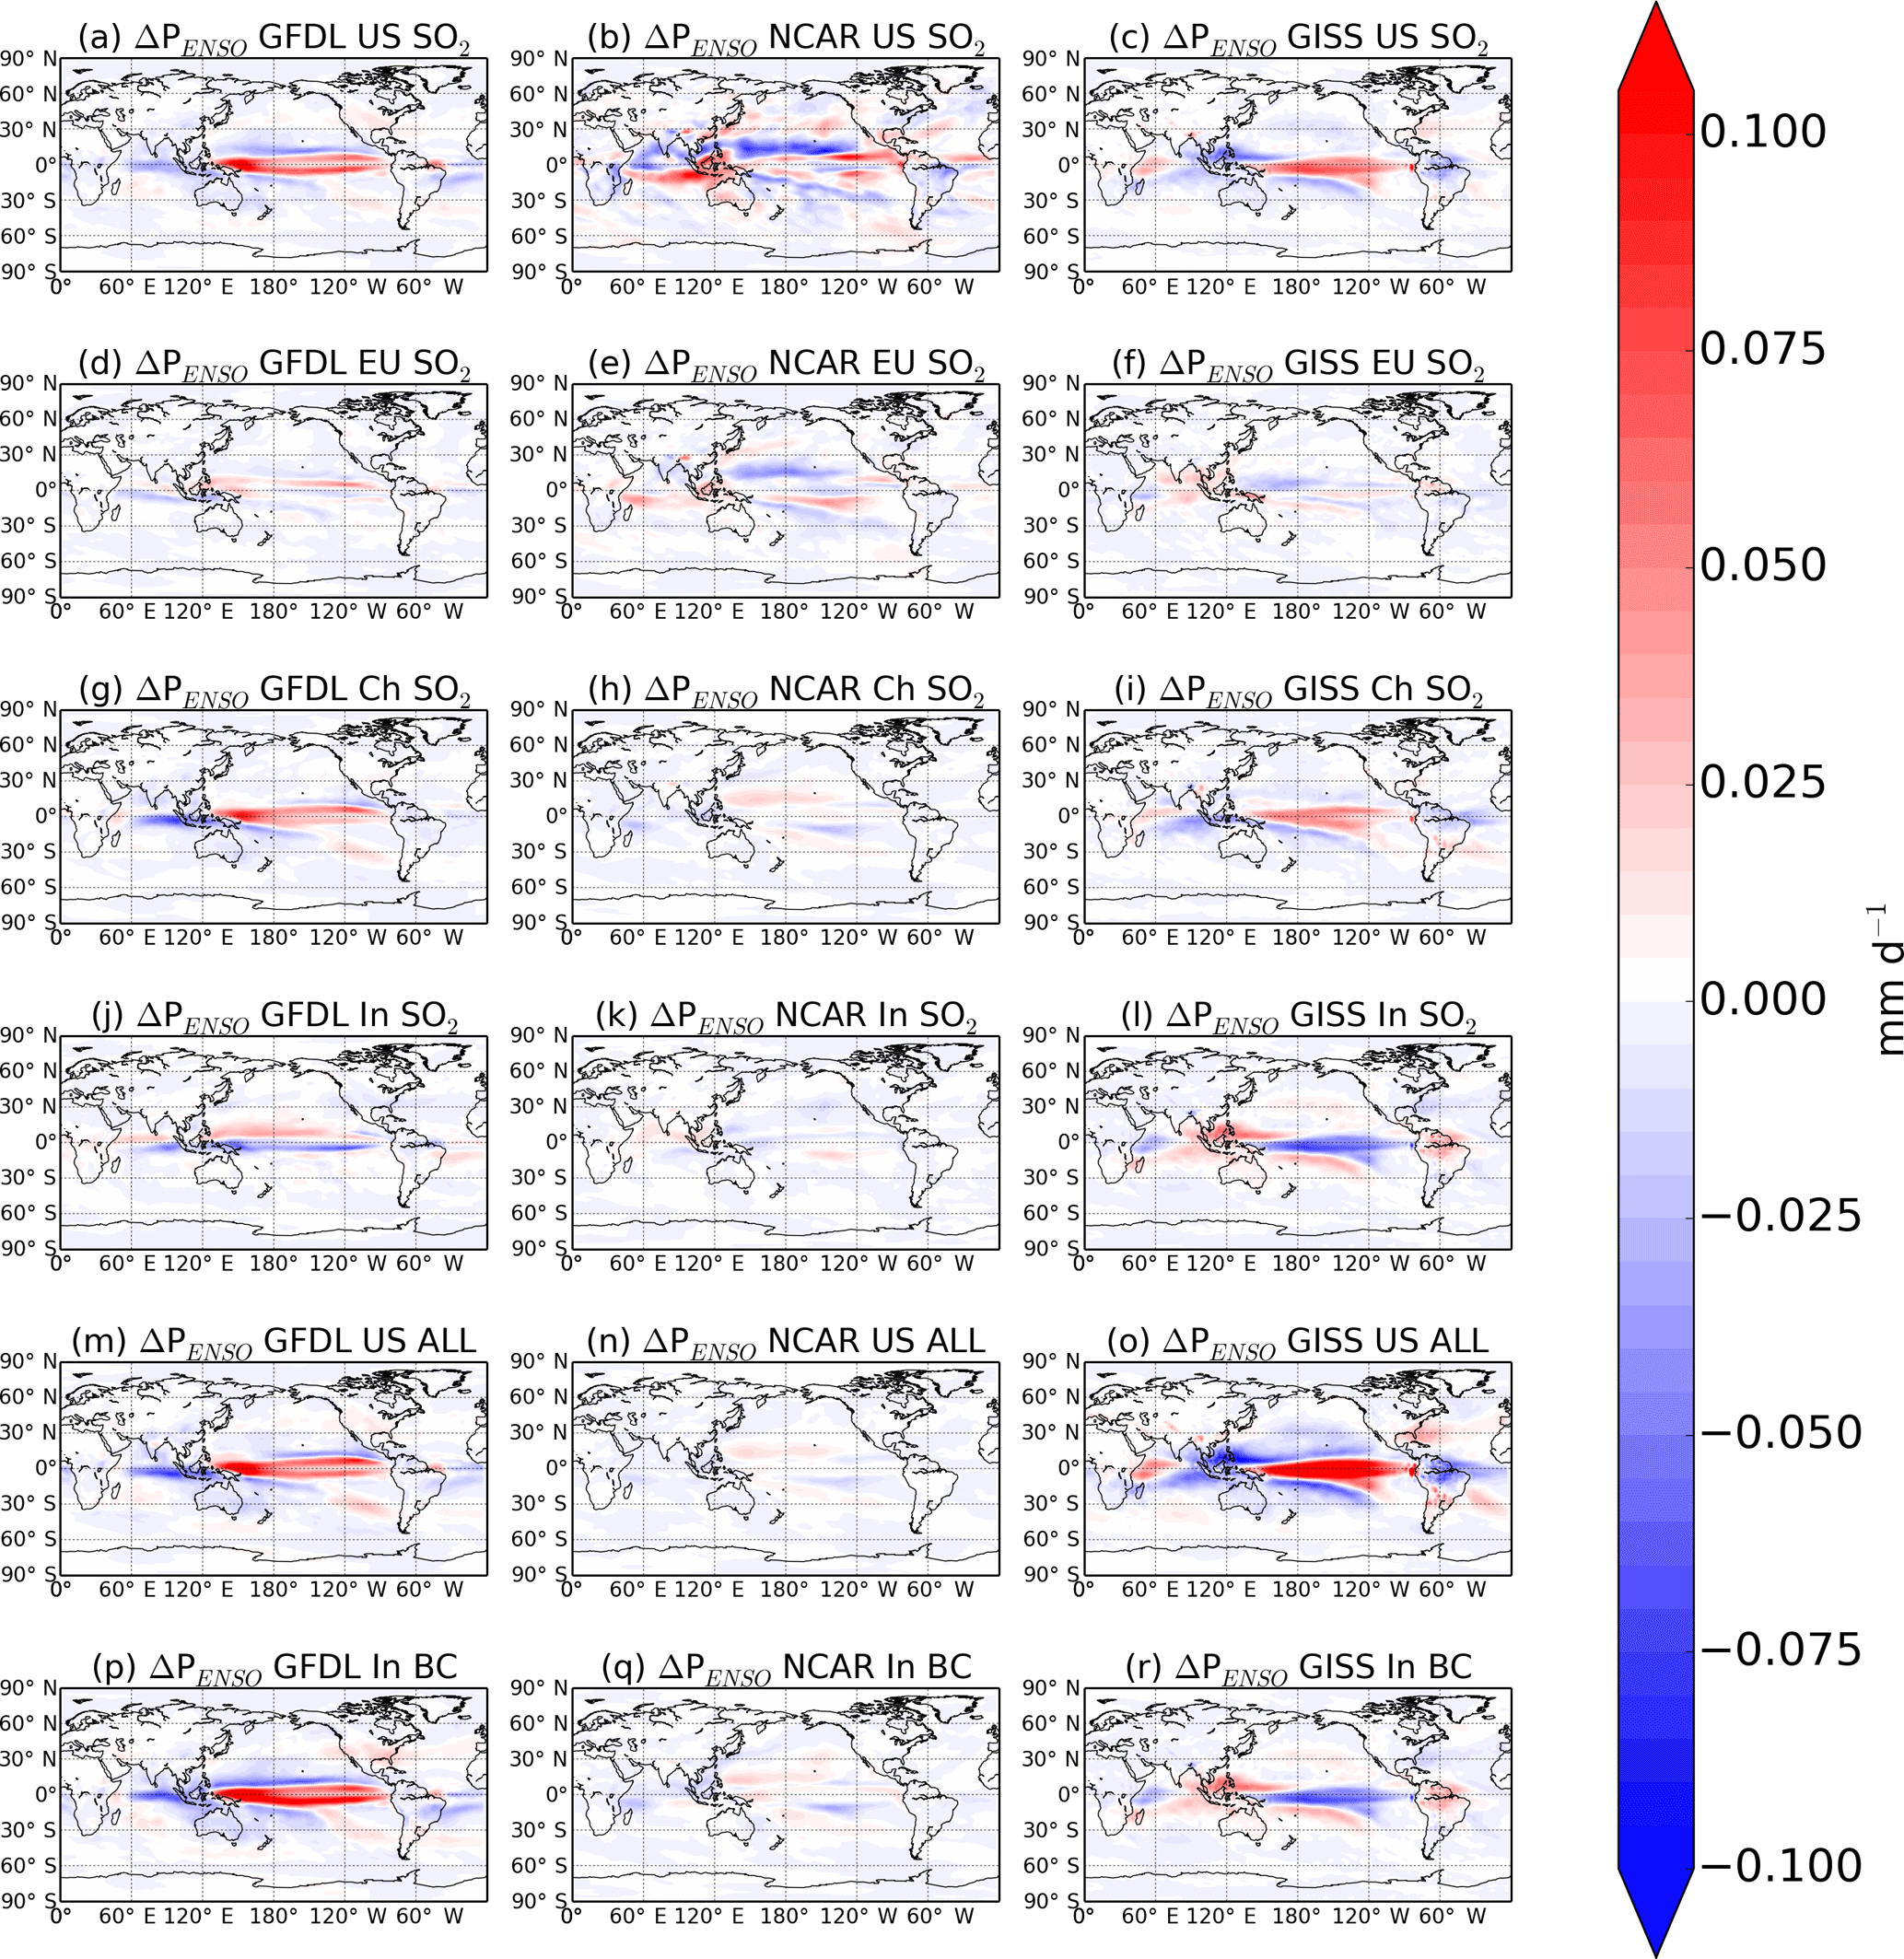
Figure 6200-year annual mean ENSO component of the precipitation response to aerosol emissions decreases in each of the three models (GFDL-CM3, first column; NCAR-CESM1, second column; GISS-E2, third column) for several different regional emissions decreases (simulations indicated in figure titles; see Table 1). See text for methodology.
4.3 Other regions
Reducing regional aerosol emissions also tends to cause statistically significant precipitation responses locally (i.e., in the emissions region). For example, all three models show increases in precipitation due to decreasing SO2 over China (Fig. 1g–i). These local impacts may be caused by microphysical factors, in particular enhanced autoconversion rates due to decreasing aerosols, causing further increases in rainfall locally. Local impacts are evident in the US_ALL, US_SO2, EU_SO2, and IN_SO2 simulations in all three models. These local precipitation responses tend to be weakest and statistically insignificant in GISS-E2, which is consistent with this model's omission of cloud lifetime effects. India BC decreases lead to either essentially no change or a small decrease in precipitation in India unlike SO2, although these are not statistically significant and therefore cannot be distinguished from internal climate variability. In cases in which regional aerosols were perturbed both individually and altogether (for example, US_ALL, US_SO2, US_OC, and US_BC), we find that the summation of the individual perturbations usually results in a larger precipitation response, both regionally and globally, compared to the combined perturbation (e.g., US_ALL), indicating nonlinearity among the individual responses (see Figs. 1 and S1).
Figure S3 shows regional precipitation responses to all aerosol reductions scenarios in all models for three additional regions: India (65–90∘ E, 8–35∘ N), the eastern United States (95–70∘ W, 23–50∘ N), and eastern China (100–130∘ E, 15–50∘ N). In the eastern US and eastern China, the precipitation responses to changes in local aerosol emissions dwarf those from remote regions. The precipitation responses to regional aerosol emissions reductions in the eastern US and China are robust, however, with 28 of 34 and 23 of 34 simulations showing an increase in annual precipitation, respectively. Monsoon precipitation in India changes by up to 3 %–5 % in GFDL-CM3 and NCAR-CESM1 in response to particular regional emissions reductions, but the sign of the change (increase or decrease) is inconsistent between models and simulations. Aerosol impacts on monsoon precipitation have been widely studied (Bollasina et al., 2011, 2014; Lau and Kim, 2006; Li et al., 2015; Meehl et al., 2008; Menon et al., 2002; Song et al., 2014), and deeper analysis from our simulations is left for future work.
Figure 1 points to an ENSO-like (El Niño–Southern Oscillation) response in the tropical Pacific. In NCAR-CESM1 and GISS-E2, there is a strong east–west dipole response in the tropical Pacific, with drying to the west and wetting to the east. These responses are some of the largest in any region and are statistically significant in NCAR-CESM1. There are also significant impacts in the tropical Pacific in GFDL-CM3, especially in CH_SO2 (Fig. 6g) and US_ALL (Fig. 6m), though the precipitation response is generally opposite in sign compared to NCAR-CESM1 and GISS-E2, with a wetting in the western tropical Pacific in GFDL-CM3 as opposed to a drying in the other two models.
We therefore extend our precipitation analysis by investigating the impact that aerosols may have on precipitation through changes in the El Niño–Southern Oscillation (ENSO). To estimate the ENSO component of the precipitation response to regional aerosol emissions decreases, we first perform a linear regression of the monthly mean precipitation fields onto a monthly ENSO index at each grid point in the control simulation of each model. We use a large-scale Indo-Pacific zonal sea level pressure (SLP) gradient index representing Walker circulation variations, which are closely linked to ENSO (Vecchi et al., 2006). The Indo-Pacific SLP gradient is defined as the difference between regional average SLP in the Indian Ocean and west Pacific (80–160∘ E, 5∘ S–5∘ N) and the central and east Pacific (160–80∘W, 5∘ S–5∘ N). The index is computed for every simulation (control and perturbation) and differences in indices are calculated between each perturbation simulation and the control simulation. The ENSO component of the precipitation response to aerosol emissions reductions, ΔPENSO, is then computed as
where rP:ENSO is the regression value (slope) between precipitation and the Indo-Pacific zonal SLP gradient index in the control simulation (one value per grid point) and ΔENSO is the difference of the index between the perturbation and the control simulation.
The ENSO component of the precipitation response to aerosol emissions reductions is shown in Fig. 6, with the same layout as Fig. 1 except with a smaller scale range (by a factor of 5). In each model, we find substantial responses mostly in the tropical Pacific and Atlantic, with changes as high as 0.1 mm d−1 or 20 % of the total precipitation response (compare with Fig. 1). With the exception of the IN_SO2 simulation in all models and the IN_BC simulation in GISS-E2, the tropical precipitation patterns in every simulation and their teleconnections in different parts of the world tend to resemble the positive phase of ENSO (El Niño). Though most of the large responses are in the tropics, there is some evidence of ENSO teleconnections, for example over the Amazon region in Brazil, for which precipitation decreases (drying) typically occur in each simulation and each model associated with the positive phase of ENSO. The ENSO component of the precipitation response is also apparent over the Indian monsoon region, manifested mostly as a drying, consistent with the positive phase of ENSO. Agreement between models is strongest for GFDL-CM3 and GISS-E2, which show similar ΔPENSO patterns for each of the different perturbation simulations in Fig. 6. All three models agree on a strong response in the US_SO2 simulation; however, there is a weaker response in NCAR-CESM1 for the rest of the perturbation simulations compared to the other two models. Since the models each show ENSO-like responses in the tropical Pacific, albeit with varying degrees of statistical significance and consistency, we conclude that no matter the emissions region or aerosol type, precipitation changes may occur via the modulation of ENSO in the tropical Pacific as a result of aerosol decreases, and these changes mostly resemble the positive phase (El Niño).
We conduct a series of 14 aerosol emissions perturbation simulations (160–240 years each) in which we perturb emissions of sulfur dioxide and/or carbonaceous aerosol within six world regions relative to a long present-day control simulation in three coupled chemistry–climate models: NOAA Geophysical Fluid Dynamics Laboratory Coupled Model 3 (GFDL-CM3), NCAR Community Earth System Model (CESM1), and NASA Goddard Institute for Space Studies ModelE2 (GISS-E2). We find local increases in precipitation near the source region for each individual aerosol perturbation (e.g., increases in Chinese precipitation for the CH_SO2 simulation), with statistical significance mostly limited to two models: NCAR-CESM1 and GFDL-CM3. We find strong tropical precipitation responses in all three models and in essentially all aerosol removal simulations. In NCAR-CESM1 and GFDL-CM3, a northward shift in the tropical North Atlantic ITCZ is associated with increased Sahel precipitation in several of the simulations in which aerosols are removed. Globally averaged, small increases in precipitation occur in nearly all (33 out of 34 simulations across the three models) aerosol emission removal simulations. Regional emissions removal of black carbon (BC) and sulfur dioxide alone both increase global mean precipitation in some cases, despite opposite-signed ERF, highlighting the uncertainties remaining in BC aerosol impacts on precipitation.
Precipitation response is weakest and largely lacks statistical significance in GISS-E2, partially attributed to the lack of a cloud lifetime effect and thus a weaker aerosol indirect effect, which was recently found to dominate tropical precipitation response to aerosols (Chung and Soden, 2017). Our results further support this conclusion, as we find the weakest radiative forcing and precipitation response in GISS-E2. Using both climate model simulations and satellite observations of a major volcanic eruption, Malavelle et al. (2017) found that aerosol-induced changes in cloud liquid water path (the cloud lifetime effect) were undetectable, suggesting that the cloud lifetime effect may be less important than the cloud albedo effect for climate models. Without sensitivity simulations that isolate the cloud lifetime component of the precipitation response to regional aerosol emissions removal, however, it is difficult to determine conclusively whether cloud microphysical or large-scale dynamical mechanisms dominate the modeled precipitation response.
We estimate the aerosol effective radiative forcing (ERF) in each perturbation simulation in each model using a series of atmosphere-only simulations with sea surface temperatures fixed to present-day modeled climatological means. The global mean ERF values are positive in all model simulations with the exception of black carbon simulations (EU_BC, US_BC), which are not statistically significant and generally fall in the range of 0 to 0.3 W m−2. ERF is largest in NCAR-CESM1, followed by GFDL-CM3 and GISS-E2. In both GISS-E2 and GFDL-CM3, global precipitation response correlates strongly to moderately (r>0.5) with global mean ERF, although NCAR-CESM1 shows a weaker correlation (r=0.3).
We further investigate the regional aerosol impact on remote precipitation and show a strong linear relationship between the change in interhemispheric temperature gradient and changes in Sahel rainfall across all of the different aerosol emission perturbation simulations. Changes in the interhemispheric temperature gradient produce an anomalous Hadley cell circulation and an accompanying northward ITCZ shift, with implications for precipitation over the Sahel. This linear relationship holds across multiple models, suggesting that regional aerosol reductions impact precipitation via the same physical mechanism, which we interpret to be a large-scale dynamical response, across different models and different aerosol perturbations. Higher-latitude regional emissions reductions (e.g., US, Europe) lead to greater change in the interhemispheric temperature gradient and thus correspondingly larger changes in Sahel rainfall than lower-latitude aerosol emissions perturbations (e.g., China, India, Africa, South America). Air pollution controls in Europe and the US may help reduce the likelihood and severity of future droughts in the Sahel and by altering the interhemispheric temperature gradient can influence precipitation in regions far removed from the emission region.
We find increases in Mediterranean wintertime precipitation in two of three models in response to most aerosol removal perturbations, implying that increases in aerosols throughout the mid-20th century could have played a role in the observed decreasing precipitation trends. In GFDL-CM3, this precipitation response can be largely explained by an aerosol-induced weakening of the prevailing westerlies and southward shift in the storm track over the Atlantic. Despite the distinction between sulfate (and organic carbon) and black carbon as scattering (cooling) versus absorbing (warming) species, respectively, we find that European precipitation, sea level pressure, and wind speed respond similarly to the removal of each of these species emissions over Europe, implying a role for cloud microphysical effects in this local climate response. This mechanism, however, is not confirmed by either GISS-E2 or NCAR-CESM1 and is therefore not robust and requires future investigation. Previous work relating aerosol forcing to North Atlantic circulation (Chiacchio et al., 2011; Fischer-Bruns et al., 2009; Allen and Sherwood, 2012) has been limited to single models and results have been inconclusive across studies. The impact of aerosols on the North Atlantic and Mediterranean climate (and the NAO) thus remains unclear and may warrant additional work with a larger model ensemble, with highly time-resolved diagnostics needed to probe the driving mechanisms more deeply and to assess robustness in a more rigorous manner.
Based on our analysis, we conclude that the El Niño–Southern Oscillation (ENSO) plays an important role in modulating the impact of regional aerosol removal on precipitation. Kim et al. (2015) found observational evidence from satellite aerosol retrievals and MERRA reanalysis data supporting a role for aerosol-driven ENSO amplification in rainfall increases over the Indian summer monsoon region by correlating elevated aerosol levels over India with Niño3.4 SST index and precipitation rates. We perform a linear regression analysis to determine the contribution of the ENSO component of the precipitation responses to the total response to regional aerosol emissions. We find the ENSO component can be as large as 20 %, especially over the tropical Pacific, with teleconnections to South Asian monsoon precipitation and Amazon wet season rainfall. Regional aerosol emissions reductions tend to cause a shift to the positive ENSO phase (El Niño as opposed to La Niña), with a few exceptions. Model agreement on the ENSO component of the precipitation response is best for the US_SO2 simulation and best between GISS-E2 and GFDL-CM3. More broadly, our findings suggest a possible anthropogenic influence on this mode of climate variability, which may complicate efforts to separate variability arising naturally from that forced by anthropogenic drivers.
Aerosol–precipitation interactions remain one of the most uncertain aspects of future climate change, especially on the regional scale (Rosenfeld et al., 2008; Michibata et al., 2016). To reduce the uncertainty of how future regional aerosol decreases will impact regional precipitation, a thorough analysis with multiple models, including several regions and aerosol types, is needed. Our results show that robust precipitation responses to regional aerosol emissions changes do occur, indicating promise for future work. One caveat of our study is that in each of the models, aerosols do not exert a microphysical effect on deep convective clouds; however, they can alter precipitation associated with deep convection through the aerosol direct effect. Overall, our findings suggest that, despite large variations between different models, there are some robust precipitation responses to aerosol emissions that warrant future investigation with additional models to pursue even more robust estimates, perhaps through model intercomparison projects such as the upcoming AerChemMIP (Aerosol Chemistry Model Intercomparison Project) (Collins et al., 2017). Other precipitation responses show little consistency across the models, raising questions as to whether the model representation is insufficient to detect a role for aerosol emissions or whether those responses are swamped by climate variability relative to any aerosol influence. A possible avenue of further study may be combining different regions into a single perturbation simulation, resulting in a larger climate response and the ability to test for additivity or linearity among the simulations. Our analysis can serve as a benchmark for future efforts with fully coupled chemistry and interactive emissions within climate models that consider emissions perturbations from a broad sampling of regions and aerosol species.
The code for the atmospheric component of the GFDL-CM3 model is available at https://www.gfdl.noaa.gov/am3/ (last access: 15 August 2018). The NCAR-CESM1 model code is available at http://www.cesm.ucar.edu/models/cesm1.0/ (last access: 16 August 2018). The GISS-E2 model code is available at https://simplex.giss.nasa.gov/snapshots/ (last access: 16 August 2018).
Model data have been made available through the Figshare repository. NCAR-CESM1 data are available at https://figshare.com/articles/CESM1_precip/5738568 and https://figshare.com/articles/ERF/5732397. GISS-E2 data are available at https://figshare.com/articles/GISS_data/5738565/1, and GFDL-CM3 is available at https://figshare.com/articles/GFDL_precip_data/5738562, (Westervelt, 2018). Model data are also available on the high-performance computing clusters for each of the modeling centers. Contact the corresponding author for any additional data requests.
The supplement related to this article is available online at: https://doi.org/10.5194/acp-18-12461-2018-supplement.
DMW performed all analysis and wrote the article. DMW, AJC, AMF, JFL, and DTS designed the study. NRM, GF, and GC provided computational support. MP and LWH provided technical guidance. All authors edited the paper.
The authors declare that they have no conflict of interest.
Funding for this study was provided by NSF EaSM-3 grant AGS 14-19398. The
authors declare no conflicts of interest, and the views, opinions, and findings
presented in this paper are solely those of the authors and do not reflect
the views of the funding agency. The NCAR-CESM work is supported by the
National Science Foundation and the Office of Science (BER) of the US
Department of Energy. NCAR is sponsored by the National Science Foundation.
GISS-E2-R simulations used resources provided by the NASA High-End Computing
(HEC) Program through the NASA Center for Climate Simulation (NCCS) at
Goddard Space Flight Center.
Edited by: Qiang Zhang
Reviewed by: two anonymous referees
Ackerley, D., Booth, B. B. B., Knight, S. H. E., Highwood, E. J., Frame, D. J., Allen, M. R., Rowell, D. P., Ackerley, D., Booth, B. B. B., Knight, S. H. E., Highwood, E. J., Frame, D. J., Allen, M. R., and Rowell, D. P.: Sensitivity of Twentieth-Century Sahel Rainfall to Sulfate Aerosol and CO2 Forcing, J. Climate, 24, 4999–5014, https://doi.org/10.1175/JCLI-D-11-00019.1, 2011.
Albrecht, B. A.: Aerosols, Cloud Microphysics, and Fractional Cloudiness, Science, 245, 1227–1230, https://doi.org/10.1126/science.245.4923.1227, 1989.
Allen, M. R. and Ingram, W. J.: Constraints on future changes in climate and the hydrologic cycle, Nature, 419, 224–232, 2002.
Allen, R. J.: A 21st century northward tropical precipitation shift caused by future anthropogenic aerosol reductions, J. Geophys. Res.-Atmos., 120, 9087–9102, https://doi.org/10.1002/2015JD023623, 2015.
Allen, R. J. and Ajoku, O.: Future aerosol reductions and widening of the northern tropical rain belt, J. Geophys Res.-Atmos., 121, 6765–6786, https://doi.org/10.1002/2016JD024803, 2016.
Allen, R. J. and Sherwood, S. C.: The impact of natural versus anthropogenic aerosols on atmospheric circulation in the Community Atmosphere Model, Clim. Dynam., 36, 1959–1978, https://doi.org/10.1007/s00382-010-0898-8, 2011.
Andrews, T., Forster, P. M., Boucher, O., Bellouin, N., and Jones, A.: Precipitation, radiative forcing and global temperature change, Geophys. Res. Lett., 37, L14701, https://doi.org/10.1029/2010GL043991, 2010.
Biasutti, M. and Giannini, A.: Robust Sahel drying in response to late 20th century forcings, Geophys. Res. Lett., 33, L11706, https://doi.org/10.1029/2006GL026067, 2006.
Bollasina, M. A., Ming, Y., Ramaswamy, V., Webster, P. J., Peiqun, Z., Yang, S., Kousky, V. E., Ramanathan, V., Chung, C. E., Ramanathan, V., Lau, K.-M., Kim, K.-M., Lau, K.-M., Kim, K.-M., Mitchell, J. F. B., Johns, T. C., Meehl, G. A., Arblaster, J. M., Collins, W. D., Wang, C., Kim, D., Ekman, A. M. L., Barth, M. C., Rasch, P. J., Vecchi, G. A., Soden, B. J., Held, I. M., Soden, B. J., Vecchi, G. A., Ueda, H., Iwai, A., Kuwako, K., Hori, M. E., Goswami, B. N., Venugopal, V., Sengupta, D., Madhusoodanan, M. S., Xavier, P. K., Wang, B., Ding, Q., Zhang, L., Zhou, T., Ming, Y., Ramaswamy, V., Ming, Y., Ramaswamy, V., Seager, R., Naik, N., Vecchi, G. A., Zhang, M., Song, H., Chen, C.-T., Ramaswamy, V., Mitchell, T. D., Jones, P. D., Rajeevan, M., Bhate, J., Kale, J. D., Lal, B., Chen, M., Xie, P., Janowiak, J. E., Arkin, P. A., Allan, R., Ansell, T., Woodward, W., Gray, H., and Donner, L. J.: Anthropogenic aerosols and the weakening of the South Asian summer monsoon., Science, 334, 502–505, https://doi.org/10.1126/science.1204994, 2011.
Bollasina, M. A., Ming, Y., Ramaswamy, V., Schwarzkopf, M. D., and Naik, V.: Contribution of local and remote anthropogenic aerosols to the twentieth century weakening of the South Asian Monsoon, Geophys. Res. Lett., 41, 680–687, https://doi.org/10.1002/2013GL058183, 2014.
Bond, T. C., Doherty, S. J., Fahey, D. W., Forster, P. M., Berntsen, T., DeAngelo, B. J., Flanner, M. G., Ghan, S., Kärcher, B., Koch, D., Kinne, S., Kondo, Y., Quinn, P. K., Sarofim, M. C., Schultz, M. G., Schulz, M., Venkataraman, C., Zhang, H., Zhang, S., Bellouin, N., Guttikunda, S. K., Hopke, P. K., Jacobson, M. Z., Kaiser, J. W., Klimont, Z., Lohmann, U., Schwarz, J. P., Shindell, D., Storelvmo, T., Warren, S. G., and Zender, C. S.: Bounding the role of black carbon in the climate system: A scientific assessment, J. Geophys. Res.-Atmos., 118, 5380–5552, https://doi.org/10.1002/jgrd.50171, 2013.
Booth, B. B. B., Dunstone, N. J., Halloran, P. R., Andrews, T., and Bellouin, N.: Aerosols implicated as a prime driver of twentieth-century North Atlantic climate variability, Nature, 484, 228–232, https://doi.org/10.1038/nature10946, 2012.
Chang, C.-Y., Chiang, J. C. H., Wehner, M. F., Friedman, A. R., Ruedy, R., Chang, C.-Y., Chiang, J. C. H., Wehner, M. F., Friedman, A. R., and Ruedy, R.: Sulfate Aerosol Control of Tropical Atlantic Climate over the Twentieth Century, J. Climate, 24, 2540–2555, https://doi.org/10.1175/2010JCLI4065.1, 2011.
Chiacchio, M., Ewen, T., Wild, M., Chin, M., and Diehl, T.: Decadal variability of aerosol optical depth in Europe and its relationship to the temporal shift of the North Atlantic Oscillation in the realm of dimming and brightening, J. Geophys. Res., 116, D02108, https://doi.org/10.1029/2010JD014471, 2011.
Chung, E.-S. and Soden, B. J.: Hemispheric climate shifts driven by anthropogenic aerosol-cloud interactions, Nat. Geosci., 10, 566–571, https://doi.org/10.1038/ngeo2988, 2017.
Collins, W. J., Lamarque, J.-F., Schulz, M., Boucher, O., Eyring, V., Hegglin, M. I., Maycock, A., Myhre, G., Prather, M., Shindell, D., and Smith, S. J.: AerChemMIP: quantifying the effects of chemistry and aerosols in CMIP6, Geosci. Model Dev., 10, 585–607, https://doi.org/10.5194/gmd-10-585-2017, 2017.
Conley, A. J., Westervelt, D. M., Lamarque, J.-F., Fiore, A. M., Shindell, D., Correa, G., Faluvegi, G., and Horowitz, L. W.: Multi-model surface temperature responses to removal of U.S. sulfur dioxide emissions, J. Geophys. Res.-Atmos., 123, 2773–2796, https://doi.org/10.1002/2017JD027411, 2018.
Donner, L. J., Wyman, B. L., Hemler, R. S., Horowitz, L. W., Ming, Y., Zhao, M., Golaz, J.-C., Ginoux, P., Lin, S.-J., Schwarzkopf, M. D., Austin, J., Alaka, G., Cooke, W. F., Delworth, T. L., Freidenreich, S. M., Gordon, C. T., Griffies, S. M., Held, I. M., Hurlin, W. J., Klein, S. a., Knutson, T. R., Langenhorst, A. R., Lee, H.-C., Lin, Y., Magi, B. I., Malyshev, S. L., Milly, P. C. D., Naik, V., Nath, M. J., Pincus, R., Ploshay, J. J., Ramaswamy, V., Seman, C. J., Shevliakova, E., Sirutis, J. J., Stern, W. F., Stouffer, R. J., Wilson, R. J., Winton, M., Wittenberg, A. T., and Zeng, F.: The Dynamical Core, Physical Parameterizations, and Basic Simulation Characteristics of the Atmospheric Component AM3 of the GFDL Global Coupled Model CM3, J. Climate, 24, 3484–3519, https://doi.org/10.1175/2011JCLI3955.1, 2011.
Dünkeloh, A. and Jacobeit, J.: Circulation dynamics of Mediterranean precipitation variability 1948-98, Int. J. Climatol., 23, 1843–1866, https://doi.org/10.1002/joc.973, 2003.
Fischer-Bruns, I., Banse, D. F., and Feichter, J.: Future impact of anthropogenic sulfate aerosol on North Atlantic climate, Clim. Dynam., 511–524, https://doi.org/10.1007/s00382-008-0458-7, 2009.
Fontes, T., Li, P., Barros, N., and Zhao, P.: Trends of PM2.5 concentrations in China: A long term approach, J. Environ. Manage., 196, 719–732, https://doi.org/10.1016/J.JENVMAN.2017.03.074, 2017.
Forster, P. M., Richardson, T., Maycock, A. C., Smith, C. J., Samset, B. H., Myhre, G., Andrews, T., Pincus, R., and Schulz, M.: Recommendations for diagnosing effective radiative forcing from climate models for CMIP6, J. Geophys. Res.-Atmos., 121, 12460–12475, https://doi.org/10.1002/2016JD025320, 2016.
Frieler, K., Meinshausen, M., Schneider von Deimling, T., Andrews, T., and Forster, P.: Changes in global-mean precipitation in response to warming, greenhouse gas forcing and black carbon, Geophys. Res. Lett., 38, L04702, https://doi.org/10.1029/2010GL045953, 2011.
Frierson, D. M. W. and Hwang, Y.-T.: Extratropical influence on ITCZ shifts in slab ocean simulations of global warming, J. Climate, 25, 720–733, 2012.
Giorgi., F.: Variability and trends of sub-continental scale surface climate in the twentieth century. Part I: observations, Clim. Dynam., 18, 675–691, https://doi.org/10.1007/s00382-001-0204-x, 2002.
Haywood, J. M., Jones, A., Bellouin, N., and Stephenson, D: Asymmetric forcing from stratospheric aerosols impacts Sahelian rainfall, Nat. Clim. Change, 3, 660–665, 2013.
Haywood, J. M., Jones, A., Dunstone, N., Milton, S., Vellinga, M., Bodas-Salcedo, A., Hawcroft, M., Kravitz, B., Cole, J., Watanabe, S., and Stephens, G.: The impact of equilibrating hemispheric albedos on tropical performance in the HadGEM2-ES coupled climate model, Geophys. Res. Lett., 43, 395–403, https://doi.org/10.1002/2015GL066903, 2016.
Held, I. M., Delworth, T. L., Lu, J., Findell, K. L., and Knutson, T. R.: Simulation of Sahel drought in the 20th and 21st centuries, P. Natl. Acad. Sci. USA, 102, 17891–17896, https://doi.org/10.1073/pnas.0509057102, 2005.
Hurrell, J. W.: Decadal trends in the north atlantic oscillation: regional temperatures and precipitation., Science, 269, 676–679, https://doi.org/10.1126/science.269.5224.676, 1995.
Hwang, Y.-T., Frierson, D. M. W., and Kang, S. M.: Anthropogenic sulfate aerosol and the southward shift of tropical precipitation in the late 20th century, Geophys. Res. Lett., 40, 2845–2850, https://doi.org/10.1002/grl.50502, 2013.
Kasoar, M., Voulgarakis, A., Lamarque, J.-F., Shindell, D. T., Bellouin, N., Collins, W. J., Faluvegi, G., and Tsigaridis, K.: Regional and global temperature response to anthropogenic SO2 emissions from China in three climate models, Atmos. Chem. Phys., 16, 9785–9804, https://doi.org/10.5194/acp-16-9785-2016, 2016.
Klimont, Z., Smith, S. J., and Cofala, J.: The last decade of global anthropogenic sulfur dioxide: 2000–2011 emissions, Environ. Res. Lett., 8, 14003, https://doi.org/10.1088/1748-9326/8/1/014003, 2013.
Kim, M. K., Lau, W. K. M., Kim, K. M. Sang, J., Kim, Y.-H., and Lee, W.-S: Amplification of ENSO effects on Indian summer monsoon by absorbing aerosols, Clim. Dynam., 46, 2657, https://doi.org/10.1007/s00382-015-2722-y, 2016.
Krichak, S. O. and Alpert, P.: Signatures of the NAO in the atmospheric circulation during wet winter months over the Mediterranean region, Theor. Appl. Climatol., 82, 27–39, https://doi.org/10.1007/s00704-004-0119-7, 2005.
Lau, K.-M. and Kim, K.-M.: Observational relationships between aerosol and Asian monsoon rainfall, and circulation, Geophys. Res. Lett., 33, L21810, https://doi.org/10.1029/2006GL027546, 2006.
Leibensperger, E. M., Mickley, L. J., Jacob, D. J., Chen, W.-T., Seinfeld, J. H., Nenes, A., Adams, P. J., Streets, D. G., Kumar, N., and Rind, D.: Climatic effects of 1950–2050 changes in US anthropogenic aerosols – Part 2: Climate response, Atmos. Chem. Phys., 12, 3349–3362, https://doi.org/10.5194/acp-12-3349-2012, 2012.
Li, C., McLinden, C., Fioletov, V., Krotkov, N., Carn, S., Joiner, J., Streets, D., He, H., Ren, X., Li, Z., and Dickerson, R. R.: India Is Overtaking China as the World's Largest Emitter of Anthropogenic Sulfur Dioxide, Sci. Rep., 7, 14304, https://doi.org/10.1038/s41598-017-14639-8, 2017.
Li, X., Ting, M., Li, C., Henderson, N., Li, X., Ting, M., Li, C., and Henderson, N.: Mechanisms of Asian Summer Monsoon Changes in Response to Anthropogenic Forcing in CMIP5 Models, J. Climate, 28, 4107–4125, https://doi.org/10.1175/JCLI-D-14-00559.1, 2015.
Liu, L., Shawki, D., Voulgarakis, A., Kasoar, M., Samset, B. H., Myhre, G., Forster, P. M., Hodnebrog, Ø., Sillmann, J., Aalbergsjø, S. G., Boucher, O., Faluvegi, G., Iversen, T., Kirkevåg, A., Lamarque, J., Olivié, D., Richardson, T., Shindell, D., and Takemura, T.: A PDRMIP Multimodel Study on the Impacts of Regional Aerosol Forcings on Global and Regional Precipitation, J. Climate, 31, 4429–4447, https://doi.org/10.1175/JCLI-D-17-0439.1, 2018.
Lu, Z., Zhang, Q., and Streets, D. G.: Sulfur dioxide and primary carbonaceous aerosol emissions in China and India, 1996–2010, Atmos. Chem. Phys., 11, 9839–9864, https://doi.org/10.5194/acp-11-9839-2011, 2011.
Meehl, G. A., Arblaster, J. M., Collins, W. D., Meehl, G. A., Arblaster, J. M., and Collins, W. D.: Effects of Black Carbon Aerosols on the Indian Monsoon, J. Climate, 21, 2869–2882, https://doi.org/10.1175/2007JCLI1777.1, 2008.
Menon, S., Hansen, J., Nazarenko, L., and Luo, Y.: Climate effects of black carbon aerosols in China and India, Science, 297, 2250–2253, https://doi.org/10.1126/science.1075159, 2002.
Michibata, T., Suzuki, K., Sato, Y., and Takemura, T.: The source of discrepancies in aerosol-cloud-precipitation interactions between GCM and A-Train retrievals, Atmos. Chem. Phys., 16, 15413–15424, https://doi.org/10.5194/acp-16-15413-2016, 2016.
Ming, Y., Ramaswamy, V., and Persad, G.: Two opposing effects of absorbing aerosols on global-mean precipitation, Geophys. Res. Lett., 37, L13701, https://doi.org/10.1029/2010GL042895, 2010.
Myhre, G., Shindell, D., Bréon, F.-M., Collins, W., Fuglestvedt, J., Huang, J., Koch, D., Lamarque, J.-F., Lee, D., Mendoza, B., Nakajima, T., Robock, A., Stephens, G., Takemura, T., and Zhang, H.: Anthropogenic and Natural Radiative Forcing, in: Climate Change 2013, The Physical Science Basis, Contribution of Working Group I to the Fifth Assessment Report of the Intergovernmental Panel on Climate Change, edited by: Stocker, T. F., Qin, D., Plattner, G.-K., Tignor, M., Allen, S. K., Boschung, J., Nauels, A., Xia, Y., Bex, V., and Midgley, P. M., Cambridge University Press, Cambridge, United Kingdom and New York, NY, USA, 2013.
Neale R. B., Gettelman, A., Park, S., Chen, C.-C., Lauritzen, P. H., Williams, D. L, and Taylor, M. A: Description of the NCAR Community Atmosphere Model (CAM 5.0), NCAR Technical Note TN-486+STR, Natl. Center for Atmospheric Research, 2012.
Petters, M. D. and Kreidenweis, S. M.: A single parameter representation of hygroscopic growth and cloud condensation nucleus activity, Atmos. Chem. Phys., 7, 1961–1971, https://doi.org/10.5194/acp-7-1961-2007, 2007.
Pendergrass, A. G. and Hartmann, D. L.: Global-mean precipitation and black carbon in AR4 simulations, Geophys. Res. Lett., 39, L01703, https://doi.org/10.1029/2011GL050067, 2012.
Ramanathan, V., Crutzen, P. J., Kiehl, J. T., and Rosenfeld, D.: Aerosols, climate, and the hydrological cycle, Science, 294, 2119–2124, https://doi.org/10.1126/science.1064034, 2001.
Ramanathan, V. and Carmichael, G.: Global and regional climate changes due to black carbon, Nature, 1, 221–227, 2008.
Rao, S., Klimont, Z., Smith, S. J., Van Dingenen, R., Dentener, F., Bouwman, L., Riahi, K., Amann, M., Bodirsky, B. L., van Vuuren, D. P., Aleluia Reis, L., Calvin, K., Drouet, L., Fricko, O., Fujimori, S., Gernaat, D., Havlik, P., Harmsen, M., Hasegawa, T., Heyes, C., Hilaire, J., Luderer, G., Masui, T., Stehfest, E., Strefler, J., van der Sluis, S., and Tavoni, M.: Future air pollution in the Shared Socio-economic Pathways, Glob. Environ. Chang., 42, 346–358, https://doi.org/10.1016/J.GLOENVCHA.2016.05.012, 2017.
Ridley, H. E., Asmerom, Y., Baldini, J. U. L., Breitenbach, S. F. M., Aquino, V. V., Prufer, K. M., Culleton, B. J., Polyak, V., Lechleitner, F. A., Kennett, D. J., Zhang, M., Marwan, N., Macpherson, C. G., Baldini, L. M., Xiao, T., Peterkin, J. L., Awe, J., and Haug, G. H.: Aerosol forcing of the position of the intertropical convergence zone since ad 1550, Nat. Geosci., 8, 195–200, https://doi.org/10.1038/ngeo2353, 2015.
Rosenfeld, D., Lohmann, U., Raga, G. B., O'Dowd, C. D., Kulmala, M., Fuzzi, S., Reissell, A., and Andreae, M. O.: Flood or drought: how do aerosols affect precipitation?, Science, 321, 1309–1313, https://doi.org/10.1126/science.1160606, 2008.
Rotstayn, L. D., Lohmann, U., Rotstayn, L. D., and Lohmann, U.: Tropical Rainfall Trends and the Indirect Aerosol Effect, J. Climate, 15, 2103–2116, https://doi.org/10.1175/1520-0442(2002)015<2103:TRTATI>2.0.CO;2, 2002.
Samset, B. H., Myhre, G., Forster, P. M., Hodnebrog, Ø., Andrews, T., Faluvegi, G., Fläschner, D., Kasoar, M., Kharin, V., Kirkevåg, A., Lamarque, J.-F., Olivié, D., Richardson, T., Shindell, D., Shine, K. P., Takemura, T., and Voulgarakis, A.: Fast and slow precipitation responses to individual climate forcers: A PDRMIP multimodel study, Geophys. Res. Lett., 43, 2782–2791, https://doi.org/10.1002/2016GL068064, 2016.
Schmidt, G. A., Kelley, M., Nazarenko, L., Ruedy, R., Russell, G. L., Aleinov, I., Bauer, M., Bauer, S. E., Bhat, M. K., Bleck, R., Canuto, V., Chen, Y.-H., Cheng, Y., Clune, T. L., Del Genio, A., de Fainchtein, R., Faluvegi, G., Hansen, J. E., Healy, R. J., Kiang, N. Y., Koch, D., Lacis, A. A., LeGrande, A. N., Lerner, J., Lo, K. K., Matthews, E. E., Menon, S., Miller, R. L., Oinas, V., Oloso, A. O., Perlwitz, J. P., Puma, M. J., Putman, W. M., Rind, D., Romanou, A., Sato, M., Shindell, D. T., Sun, S., Syed, R. A., Tausnev, N., Tsigaridis, K., Unger, N., Voulgarakis, A., Yao, M.-S., and Zhang, J.: Configuration and assessment of the GISS ModelE2 contributions to the CMIP5 archive, J. Adv. Model. Earth Syst., 6, 141–184, https://doi.org/10.1002/2013MS000265, 2014.
Shindell, D. T., Voulgarakis, A., Faluvegi, G., and Milly, G.: Precipitation response to regional radiative forcing, Atmos. Chem. Phys., 12, 6969–6982, https://doi.org/10.5194/acp-12-6969-2012, 2012.
Smith, S. J. and Bond, T. C.: Two hundred fifty years of aerosols and climate: the end of the age of aerosols, Atmos. Chem. Phys., 14, 537–549, https://doi.org/10.5194/acp-14-537-2014, 2014.
Smith, S. J., van Aardenne, J., Klimont, Z., Andres, R. J., Volke, A., and Delgado Arias, S.: Anthropogenic sulfur dioxide emissions: 1850–2005, Atmos. Chem. Phys., 11, 1101–1116, https://doi.org/10.5194/acp-11-1101-2011, 2011.
Stephens, G. L., O'Brien, D. M., Webster, P. J., Pilewski, P., Kato, S., and Li, J.: The albedo of Earth, Rev. Geophys., 53, 141–163, https://doi.org/10.1002/2014RG000449, 2015.
Stevens, B. and Feingold, G.: Untangling aerosol effects on clouds and precipitation in a buffered system, Nature, 461, 607–613, https://doi.org/10.1038/nature08281, 2009.
Song, F., Zhou, T., and Qian, Y.: Responses of East Asian summer monsoon to natural and anthropogenic forcings in the 17 latest CMIP5 models, Geophys. Res. Lett., 41, 596–603, https://doi.org/10.1002/2013GL058705, 2014.
Stevens, B. and Feingold, G.: Untangling aerosol effects on clouds and precipitation in a buffered system., Nature, 461, 607–613, https://doi.org/10.1038/nature08281, 2009.
Tang, T., Shindell, D., Samset, B. H., Boucher, O., Forster, P. M., Hodnebrog, Ø., Myhre, G., Sillmann, J., Voulgarakis, A., Andrews, T., Faluvegi, G., Fläschner, D., Iversen, T., Kasoar, M., Kharin, V., Kirkevåg, A., Lamarque, J.-F., Olivié, D., Richardson, T., Stjern, C. W., and Takemura, T.: Dynamical response of Mediterranean precipitation to greenhouse gases and aerosols, Atmos. Chem. Phys., 18, 8439–8452, https://doi.org/10.5194/acp-18-8439-2018, 2018.
Tørseth, K., Aas, W., Breivik, K., Fjæraa, A. M., Fiebig, M., Hjellbrekke, A. G., Lund Myhre, C., Solberg, S., and Yttri, K. E.: Introduction to the European Monitoring and Evaluation Programme (EMEP) and observed atmospheric composition change during 1972–2009, Atmos. Chem. Phys., 12, 5447–5481, https://doi.org/10.5194/acp-12-5447-2012, 2012.
Visbeck, M. H., Hurrell, J. W., Polvani, L., and Cullen, H. M.: The North Atlantic Oscillation: past, present, and future., P. Natl. Acad. Sci. USA, 98, 12876–12877, https://doi.org/10.1073/pnas.231391598, 2001.
van Vuuren, D. P., Edmonds, J., Kainuma, M., Riahi, K., Thomson, A., Hibbard, K., Hurtt, G. C., Kram, T., Krey, V., Lamarque, J.-F., Masui, T., Meinshausen, M., Nakicenovic, N., Smith, S. J., and Rose, S. K.: The representative concentration pathways: an overview, Clim. Change, 109, 5–31, https://doi.org/10.1007/s10584-011-0148-z, 2011.
Vecchi, G. A., Soden, B. J., Wittenberg, A. T., Held, I. M., Leetman, A., and Harrison, M. J.: Weakening of tropical Pacific atmospheric circulation due to anthropogenic forcing, Nature, 44, 73–76, 2006.
Wang, C.: Impact of direct radiative forcing of black carbon aerosols on tropical convective precipitation, Geophys. Res. Lett., 34, L05709, https://doi.org/10.1029/2006GL028416, 2007.
Wang, Y., Jiang, J. H., Su, H., Choi, Y.-S., Huang, L., Guo, J., and Yung, Y. L.: Elucidating the role of anthropogenic aerosols in Arctic Sea ice variations, J. Climate, 31, 99–114, https://doi.org/10.1175/JCLI-D-17-0287.1, 2018.
Wang, Y., Jiang, J. H., Su, H., Choi, Y.-S., Huang, L., Guo, J., and Yung, Y. L.: Elucidating the role of anthropogenic aerosols in Arctic Sea icevariations, J. Climate, 31, 99–114, https://doi.org/10.1175/JCLI-D-17-0287.1, 2018.
Westervelt, D. M., Conley, A. J., Fiore, A. M., Lamarque, J.-F., Shindell, D., Previdi, M., Faluvegi, G., Correa, G., and Horowitz, L. W.: Multimodel precipitation responses to removal of U.S. sulfur dioxide emissions, J. Geophys. Res.-Atmos., 122, 5024–5038, https://doi.org/10.1002/2017JD026756, 2017.
Westervelt, D. M.: Lamont-Doherty Earth Observatory, “NCAR-CESM1 Effective Radiative Forcing Data”, available at: https://figshare.com/articles/ERF/5732397, (last access: 16 August 2018), 2018.
Westervelt, D. M.: Lamont-Doherty Earth Observatory, “GISS-E2 precipitation data”, available at: https://figshare.com/articles/GISS_data/5738565/1, (last access: 16 August 2018), 2018.
Westervelt, D. M.: Lamont-Doherty Earth Observatory, “GFDL-CM3 precipitation data”, available at: https://figshare.com/articles/GFDL_precip_data/5738562, (last access: 16 August 2018), 2018.
Xoplaki, E., González-Rouco, J. F., Luterbacher, J., and Wanner, H.: Wet season Mediterranean precipitation variability: influence of large-scale dynamics and trends, Clim. Dynam, 23, 63–78, https://doi.org/10.1007/s00382-004-0422-0, 2004.
- Abstract
- Introduction
- Models and simulations
- Global precipitation responses to regional aerosol emissions reductions
- Connecting regional emissions to regional responses
- The role of ENSO in the precipitation response to regional aerosol emissions reductions
- Summary and conclusions
- Code availability
- Data availability
- Author contributions
- Competing interests
- Acknowledgements
- References
- Supplement