the Creative Commons Attribution 4.0 License.
the Creative Commons Attribution 4.0 License.
 | 23 Aug 2018
Source contributions to sulfur and nitrogen deposition – an HTAP II multi-model study on hemispheric transport
Jiani Tan
Frank Dentener
Jian Sun
Louisa Emmons
Simone Tilmes
Johannes Flemming
Toshihiko Takemura
Huisheng Bian
Qingzhao Zhu
Cheng-En Yang
Terry Keating
With the rising anthropogenic emissions from human activities, elevated concentrations of air pollutants have been detected in the hemispheric air flows in recent years, aggravating the regional air pollution and deposition issues. However, the regional contributions of hemispheric air flows to deposition have been given little attention in the literature. In this light, we assess the impact of hemispheric transport on sulfur (S) and nitrogen (N) deposition for six world regions: North America (NA), Europe (EU), South Asia (SA), East Asia (EA), Middle East (ME) and Russia (RU) in 2010, by using the multi-model ensemble results from the 2nd phase of the Task Force Hemispheric Transport of Air Pollution (HTAP II) with 20 % emission perturbation experiments. About 27 %–58 %, 26 %–46 % and 12 %–23 % of local S, NOx and NH3 emissions and oxidation products are transported and removed by deposition outside of the source regions annually, with seasonal variation of 5 % more in winter and 5 % less in summer. The 20 % emission reduction in the source regions could affect 1 %–10 % of deposition in foreign continental regions and 1 %–14 % in foreign coastal regions and the open ocean. Significant influences are found from NA to the North Atlantic Ocean (2 %–14 %), and from EA to the North Pacific Ocean (4 %–10 %) and to western NA (4 %–6 %) (20 % emission reduction). The impact on deposition caused by short-distance transport between neighboring regions (i.e., from EU to RU) occurs throughout the whole year (slightly stronger in winter), while the long-range transport (i.e., from EA to NA) mainly takes place in spring and fall, which is consistent with the seasonality found for hemispheric transport of air pollutants. Deposition in the emission-intensive regions such as US, SA and EA is dominated (∼80 %) by own-region emissions, while deposition in the low-emission-intensity regions such as RU is almost equally affected by foreign exported emissions (40 %–60 %) and own-region emissions. We also find that deposition of the coastal regions or the near-coastal open ocean is twice more sensitive to hemispheric transport than the non-coastal continental regions, especially for regions in the downwind direction of emission sources (i.e., west coast of NA). This study highlights the significant impacts of hemispheric transport of air pollution on the deposition in coastal regions, the open ocean and low-emission-intensity regions. Further research is proposed to improve the ecosystem and human health, with regards to the enhanced hemispheric air flows.
- Article
(3629 KB) -
Supplement
(783 KB) - BibTeX
- EndNote


The increasing consumption of energy by human activities has largely increased the deposition of nitrogen (N) over the terrestrial and marine ecosystem (Kim et al., 2011; Galloway et al., 2008; Duce et al., 2008). The impact is estimated to continue increasing in the near future (Bleeker et al., 2011; Lamarque et al., 2013, 2005; Kanakidou et al., 2016; Paulot et al., 2013; Bian et al., 2017). The NOx emissions have increased by about 10 Tg(N) from 2001 to 2010, due to the large increase in Asian regions (Tan et al., 2018), while recent studies have reported the year 2011 as the turning point for NOx emissions from China (Li et al., 2017; Liu et al., 2016). On the other hand, the global sulfur (S) emissions have declined by about 5 Tg(S) from 2000 to 2010 (Tan et al., 2018). The global amounts of SO2 emissions from fossil fuels have been decreasing since 1980, owing to the significant decline of emissions from Europe (EU) and the US (Chin et al., 2014). The SO2 emission in China experiences increases from 2000 to 2005 due to energy consumption and decreases after 2006 thanks to the implementation of flue-gas desulfurization systems on power plants. Deposition supplies the ecosystem with nutrients, but too much deposition could cause various adverse impacts on the environment, including acidification and eutrophication of both forest and water (Bouwman et al., 2002; Bergstrom and Jansson, 2006; Dentener et al., 2006; Phoenix et al., 2006), soil acidification which slows down crop production (Guo et al., 2010; Janssens et al., 2010) and even destroying plant biodiversity (Bobbink et al., 2010; Clark and Tilman, 2008). The prevention and control of exceeding deposition have become growing worldwide concerns.
Hemispheric transport of air pollutants is found to aggravate regional air pollution issues (Wild and Akimoto, 2001; Sudo and Akimoto, 2007; Fu et al., 2012; Fiore et al., 2009), as well as enlarge the local deposition burden (Glotfelty et al., 2014; Sanderson et al., 2008). The mass of aerosols arriving at the coasts of North American (NA) is comparable to that emitted domestically (Yu et al., 2012). Air pollution from Asia contributes to the PM2.5 concentration in the western US by 1.5 µg m−3 (Tao et al., 2016), the O3 concentration by 3–10 ppbv (Zhang et al., 2009, 2008; Yienger et al., 2000; Reidmiller et al., 2009; Jacob et al., 1999; Brown-Steiner and Hess, 2011) and the peroxyacyl nitrate (PAN) concentration by 26 ppbv (Berntsen et al., 1999) in spring. The long-range transport of air pollution from NA is estimated to contribute 3–5 ppb (7 %–11 %) to the O3 concentration in the EU annually (Auvray and Bey, 2005; Guerova et al., 2006; Derwent et al., 2004; Li et al., 2002) and the increment can reach 25–28 ppbv during particular events (Guerova et al., 2006). European outflow affects the surface O3 concentration in western China by 2–6 ppbv in spring and summer (Li et al., 2014) and North Africa by 5–20 ppbv in summer (Duncan et al., 2008; Duncan and Bey, 2004). The study by Yu et al. (2013) found that the long-range transport contribute 6 %–16 % and 22 %–40 % to aerosol optional depth and direct radiative forcing in four regions including NA, EU, East Asia (EA) and South Asia (SA). Recent studies have reported an increasing trend in the hemispheric transport of air pollution from Asia to NA from mid-1980s to late-2000s. The Asian plume has contributed ∼10 ppbv (30 %) to the O3 concentration over western NA from mid-1980s to mid-2000s (Jaffe et al., 2003; Parrish et al., 2004), with an annal increase of 0.34–0.50 ppbv O3 (Parrish et al., 2009). A more recent study showed that the contribution is about 5–7 ppbv in 2006 with a 1–2 ppb increase from 2000 to 2006 (Zhang et al., 2008). The trend agreed well with the rapid growth of Asian emissions (Richter et al., 2005; Lu et al., 2010; Verstraeten et al., 2015; Zhang et al., 2007; van der A et al., 2006, 2008).
Compared to the impact of hemispheric transport on air pollution, the impact on deposition has not been fully studied. Arndt and Carmichael (1995) developed a source–receptor (S–R) relationship for S deposition among the Asian regions in early 1990s. Zhang et al. (2012) found that foreign anthropogenic emissions contribute to 6 % and 8 % of the oxidized nitrogen (NOy) and reduced nitrogen (NHx) deposition in the contiguous US, respectively. A systematic study by Sanderson et al. (2008) shed light on the impact of long-range transport on NOy deposition at a global scale. The study used the model ensemble results from the 1st phase of the Task Force Hemispheric Transport of Air Pollution (HTAP I) to calculate the S–R relationship for NOy deposition in 2001 among four regions: EU, NA, SA and EA. Results showed that about 12 %–24 % of the NOx emissions were transported and deposited out of the source regions. About 3 %–10 % of the emissions were deposited on the other three regions than the source region and affects their deposition by about 1 %–3 %. However, these studies focused on the emission-intensive regions, where the foreign disturbance could be relatively small compared to huge own-region emissions. The foreign impact on the low-emission-intensity regions was not evaluated in the same detail. Furthermore, both the magnitude and spatial distribution of S and N emissions and deposition have been changed considerably during the last 10 years (2001–2010) (Tan et al., 2018). It is necessary to update the S–R relationship for more recent years with regards to these changes.
To explore these questions, this study assesses the impact of hemispheric transport of S, NOx and NH3 emissions and oxidation products on S and N deposition, with multi-model ensemble results from the 2nd phase of HTAP (HTAP II). Additional to the four regions used in Sanderson's study for HTAP I (NA, EU, SA and EA), we include two more regions: Middle East (ME) and Russia, Belarus, and Ukraine (RU) in this study. These two regions are featured with low S and N emissions relative to their areal extent, but located close to the high-emission regions such as EU, SA and EA. We calculate the amount of deposition brought by hemispheric transport by comparing model results between the base case and the 20 % emission perturbation cases. The experimental design is described in Sect. 2. In Sect. 3, we explore the following questions:
-
What fractions (percentages) of the S or N emissions are transported and deposited outside of the source regions? What are the fractions of emissions that finally deposit on the other five regions and the open ocean? What is the seasonality of the exported fractions?
-
As receptor regions, how much deposition is brought by hemispheric transport? What is the impact on local deposition? Is there any seasonality for this impact?
-
For each region, what are the contributions of hemispheric transport and own-region emissions on local deposition? In line with the analysis for other pollutants, to this purpose we evaluate the so-called response to extra-regional emission reduction (RERER) metric. We discuss the impacts of hemispheric transport on the coastal regions specifically. The inter-model variations are also illustrated.
Section 4 is a summary of the findings in this study and some suggestions for future study.
2.1 HTAP II and experiment setup
The HTAP was created in 2004 under the Convention on Long-range Transboundary Air Pollution (CLRTAP). It involves efforts from international scientists aiming at understanding the hemispheric transport of air pollutants and its impact on regional and global air quality, public health and near-term climate change. Until now, two phases of HTAP experiments have been conducted successfully. HTAP I involved more than 20 models from international modeling groups, with 2001 as the base year for modeling studies. A comprehensive report of the major findings of HTAP I was released in 2010 and could be downloaded from http://www.htap.org/ (last access: 6 April 2018). The HTAP II was launched in 2012, with 2010 as the base simulation year. HTAP II required all models to use the same prescribed anthropogenic emissions instead of using the best estimates of emissions by each modeling group as HTAP I. This facilitates an inter-model comparison between models. In addition, HTAP II had a refined definition for the boundaries of regions, which enabled an update in the S–R relationships among regions.
This study uses the ensemble of 11 global models from HTAP II (including CAM-Chem, CHASER_re1, CHASER_t106, EMEP_rv48, GEMMACH, GEOS5, GEOSCHEMAJOINT, OsloCTM3v.2, GOCARTv5, SPRINTARS and C-IFS_v2). A detailed description of the experimental setup can be found in Galmarini et al. (2017). The S deposition includes SO2 deposition and deposition. The N deposition is categorized by NOy deposition and NHx deposition. The NOy deposition is a sum of all oxidized N except N2O, including the deposition of NO2, HNO3, , PAN and other organic nitrates other than PAN (Orgn). The NHx deposition includes NH3 deposition and deposition. To form the multi-model ensemble, we regrid all models to a uniformed horizontal resolution of . We use the multi-model mean (MMM) of all models to present the ensemble results, a procedure which has been proven previously to have a better agreement with observations than single model result (Dentener et al., 2006; Tan et al., 2018). The MMM values of the compositions of S or N deposition are calculated separately and then combined to compute the total S or N deposition. More details can be found in Tan et al. (2018).
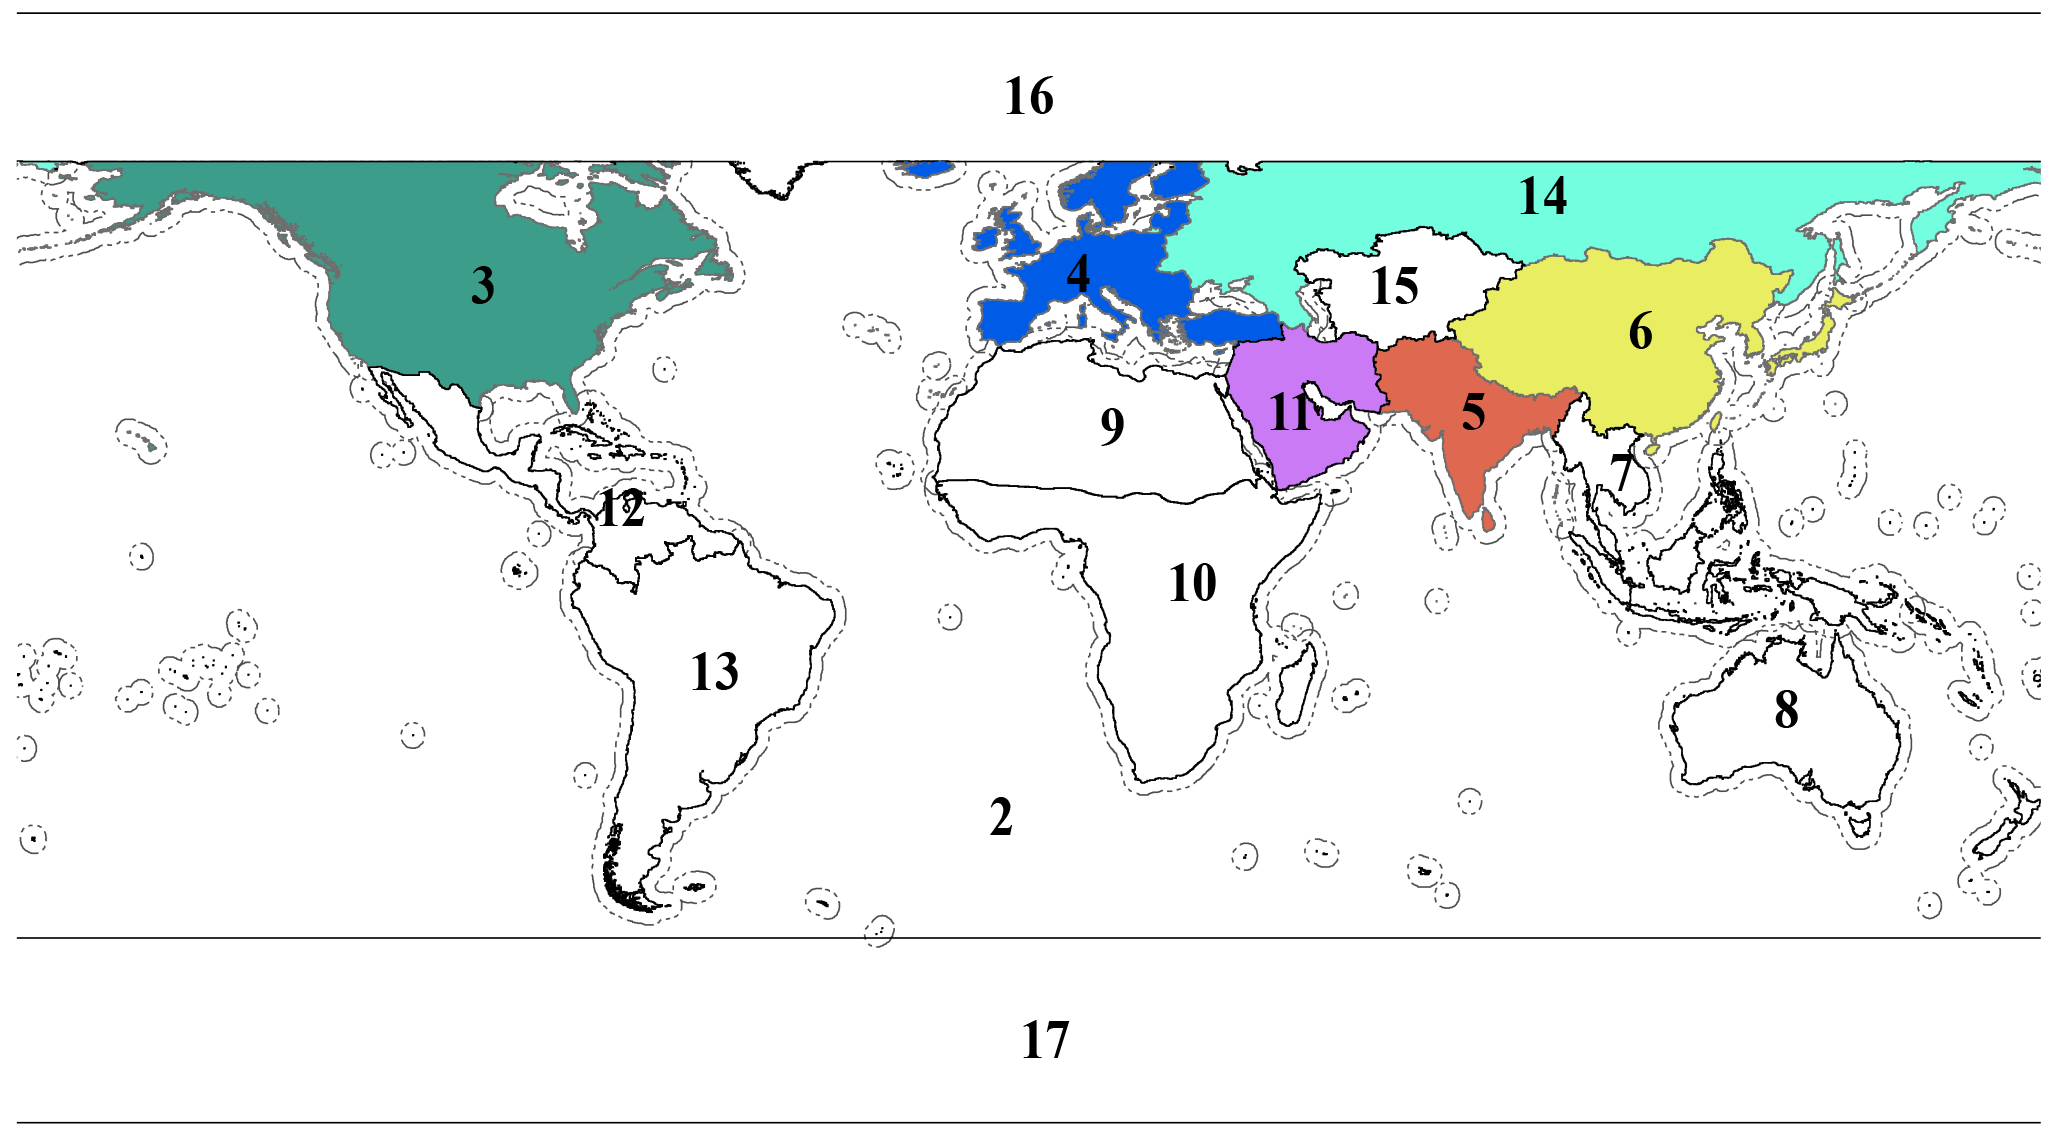
Figure 1Boundaries of regions and coastal areas (dashed). Six regions with perturbation experiments: 3 – North America (NA), 4 – Europe (EU), 5 – South Asia (SA), 6 – East Asia (EA), 11 – Middle East (ME) and 14 – Russia, Belarus, and Ukraine (RU). Others: 1 – Global, 2 – Ocean, 7 – Southeast Asia, 8 – Australia, 9 – North Africa, 10 – Sub-Saharan Africa, 12 – Mexico, Central America, the Caribbean, the Guyanas, Venezuela, and Columbia (Central America), 13 – South America, 15 – Central Asia, 16 – Arctic and 17 – Antarctic.
2.2 Simulation scenarios
The base simulation uses anthropogenic emissions in 2010 (Janssens-Maenhout et al., 2015), which is called “base case” in this study. The MMM performance on wet deposition has been evaluated with observations from the National Atmospheric Deposition Program (NADP) (http://nadp.sws.uiuc.edu/, last access: 6 April 2018) for the NA region, European Monitoring and Evaluation Programme (EMEP) Chemical Coordinating Centre (CCC) reports (http://www.nilu.no/projects/ccc/reports.html, last access: 6 April 2018) for the EU region and the Acid Deposition Monitoring Network in East Asia (EANET; http://www.eanet.asia/, last access: 6 April 2018) for the EA region in the previous study of Tan et al. (2018). The following are some brief results of the evaluation. Modeled sum of gas-phase SO2 wet deposition and aerosol wet deposition is evaluated with observed wet deposition. About 76 % of the stations of all networks are predicted within ±50 % of observation. Negative model biases (−20 %) are found at some East Asian stations. Modeled sum of gas-phase HNO3 wet deposition and aerosol wet deposition is compared with observed wet deposition. About 83 % of the stations of all networks are predicted within ±50 % of observation. The European and Southeast Asian stations with high observed wet deposition are somewhat underestimated. Modeled sum of gas-phase NH3 wet deposition and aerosol wet deposition is compared with observed deposition. About 81 % of modeled wet deposition at stations of all networks are predicted within ±50 % of observation. A general underestimation is found in modeled wet deposition, especially at East Asian stations. In terms of dry deposition, due to the lack of directly measured data, we compare the modeled dry deposition with inferential data from the Clean Air Status and Trends Network (CASTNET) over US. The CASTNET data are calculated with observed aerosol concentration and modeled dry deposition velocity, therefore it might have high uncertainties. Comparison shows that the modeled dry deposition is generally higher than the CASTNET inferential data by a factor of 1–2. This is a common feature of many global and regional models (WMO, 2017). According to the analysis, the model bias for dry deposition mainly comes from the model over-prediction of air pollutant concentration (Tan et al., 2018). The CASTNET sites are generally located in remote regions with relatively lower air pollutant concentrations than urban regions, but the models fail to represent this characteristic with coarse spatial resolution (Tan et al., 2018).
HTAP II defines the boundaries of 17 regions as shown in Fig. 1. The emission perturbation experiments are conducted separately for six regions (regions with color in Fig. 1) with high priority: NA, EU, SA, EA, ME and RU. In the perturbation experiments, the anthropogenic emissions (including NOx, SO2, NH3, VOC, CO and PM) of a specific region are reduced by 20 % from the amounts in the base case simulation, while the emissions in other regions are kept constant. In addition, a global perturbation experiment referred to as “GLO” is conducted with 20 % reduction of global anthropogenic emissions. We estimate the impact of hemispheric transport on deposition by comparing the model results under perturbation experiments with those under the base case simulation. In order to validate the quality of model outputs, we check the mass balance between emissions and deposition at the global scale. The mass balance check for the base case simulation is shown in Tan et al. (2018), therefore we show the mass balance check for perturbation experiments in this study. We compare the global total amounts of changes in deposition (Δ Depo) with changes in emissions (Δ Emis) for all perturbation cases (Table S1). Model results are excluded if their global Δ Depo values fall outside the range of ±20 % of their global Δ Emis. According to our results, the amounts of Δ Depo are all within the scopes for all perturbation cases except the NHx deposition under the EA case. The Δ Depo of NHx deposition under EA case is not available due to lack of modeled wet deposition under 20 % emission perturbation in EA.
Table 1Source–receptor relationship of S, NOy and NHx deposition (%) for regions (including continental coastal and non-coastal regions). The values in the parentheses are for coastal regions as a subset of the total.
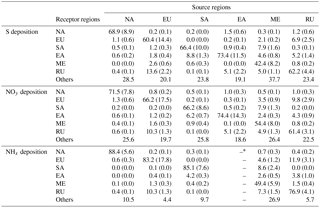
* Lack of wet deposition under EA emission perturbation experiment from all models.
3.1 Export of S and N emissions from source regions
This section studies the export of S and N emissions and oxidation products from the source regions. Table 1 shows the S–R relationship of S and N deposition among the six regions. The numbers are the sensitivity (SENr→s) of deposition in the receptor or source regions to emission changes in the source regions (Sanderson et al., 2008). The metric is calculated as Δ Depo in the receptor or source regions divided by Δ Emis in the source regions following Eq. (1).
where s is the source region and r is the receptor region. Δ Depo (r∕s) is the deposition change in the receptor or source regions and Δ Emis (s) is the emission change in the source regions. The metric indicates the percentages of emissions of the source regions that are deposited locally or exported to foreign regions.
The numbers outside of the parenthesis in Table 1 are for coastal and non-coastal regions together, and the numbers in the parenthesis are specifically for coastal regions (defined in Fig. 1). “Others” means other regions of the world other than the six regions (white color in Fig. 1). The NA region has 69 % of its S emissions deposited within itself, including 9 % deposited on its coastal region. The remaining 31 % is exported to the other regions, mostly to the “Others” and less than 3 % is deposited on the other five regions (EU, SA, EA, ME and RU). A relatively large fraction (14 %) of European S emissions are exported to the RU region. Other major pathways of export of S emissions and reaction products are from SA to EA (9 %), from EA to RU (5 %), and from RU to EU (7 %) and EA (5 %). ME has considerable high percentages of S emissions exported to its nearby regions such as SA (8 %), EA (5 %) and RU (5 %). The S–R relationship of NOy deposition is similar to that of S deposition, except that EU and ME have 66 % and 54 % of NOx emissions deposited within the source region, which are 6 % and 12 % higher than those of S emissions, likely due to somewhat longer lifetimes of S emissions compared to NOx emissions and the high emission altitude of S emissions. In terms of NHx deposition, about 20 % more NH3 emissions are deposited within the source regions (except ME) compared with S and NOx emissions, due to its short lifetime in the atmosphere.
The seasonal variations in the export of S and N emissions from source regions are shown in Fig. S1. In terms of S emissions, there are 5 %–10 % seasonal differences around the annual average export fractions for all regions except SA. SA exports almost half of its S emissions in spring, which is twice the number in summer (20 %) and fall (25 %), related to the specific dry period and monsoon circulation. The seasonal export fractions of NOx and NH3 emissions are similar to that of S emissions in the pattern, but generally lower in values in all seasons. Generally, the source regions export the highest percentage of their emissions in winter and spring and lowest in summer. More proficient oxidation chemistry in summer results in more soluble components, and local weather systems, especially the episodes of precipitation have a large influence on this seasonality. For most continental regions, the wet deposition accounts for 50 %–70 % of total deposition (Tan et al., 2018; Vet et al., 2014; Dentener et al., 2006). Therefore, local precipitation plays an important role in the removal process of local pollution. On the other hand, for regions with low local precipitation like ME, the percentage of emissions removed within own region would be lower than the other regions. In addition, the strong westerly winds in winter and spring favor the hemispheric transport in the mid-latitudes of the Northern Hemisphere. While the rapid vertical convections in summer slowdown the zonal transport of air flows and accelerates the local removal process.
A comparison is conducted with previous studies. Bey et al. (2001) estimated that 70 % of the emitted NOx from Asia is lost within its boundary by HNO3 deposition in spring. The estimations in our study are 70 % for EA and 61 % for SA, close to Bey's result. Li et al. (2004) reported that about 20 % of anthropogenic NOx emitted by NA is deposited out of its boundary (about 1000 km offshore). Stohl et al. (2002) calculated that 9 %–22 % of surface NOx emissions are exported out of the boundary of NA. Our estimation is about 30 %, higher than Li's and Stohl's results. The HTAP I study by Sanderson et al. (2008) developed a S–R relationship for NOy deposition among NA, EU, SA and EA. The results showed that about 12 %–24 % of the emitted NOx is deposited out of the source regions. This study of HTAP II finds a higher percentage of export (26 %–34 %). It should be noted that the estimations of different studies are not fully comparable since they are influenced by several factors: (1) definition of the boundaries of the source and receptor regions. For instance, Li et al. (2004) defined the boundary of NA by a squared domain: 25–55∘ N, 65–130∘ W, while we use the continental boundaries defined by HTAP II. There are also changes in the boundaries of regions from HTAP I to HTAP II. For instance, Mexico and Central America are included in NA in HTAP I, but they are defined as a separate region in HTAP II (region 12 in Fig. 1). The boundary of EU is also changed in HTAP II. (2) Design of the perturbation simulations. The perturbation simulations in HTAP I only change the NOx emissions, but HTAP II simulations also reduce the other anthropogenic emissions, including SO2 and PM. The joint effects of controlling multiple species may result in more reduction in NOy deposition, but it is hard to estimate the influence in this study.
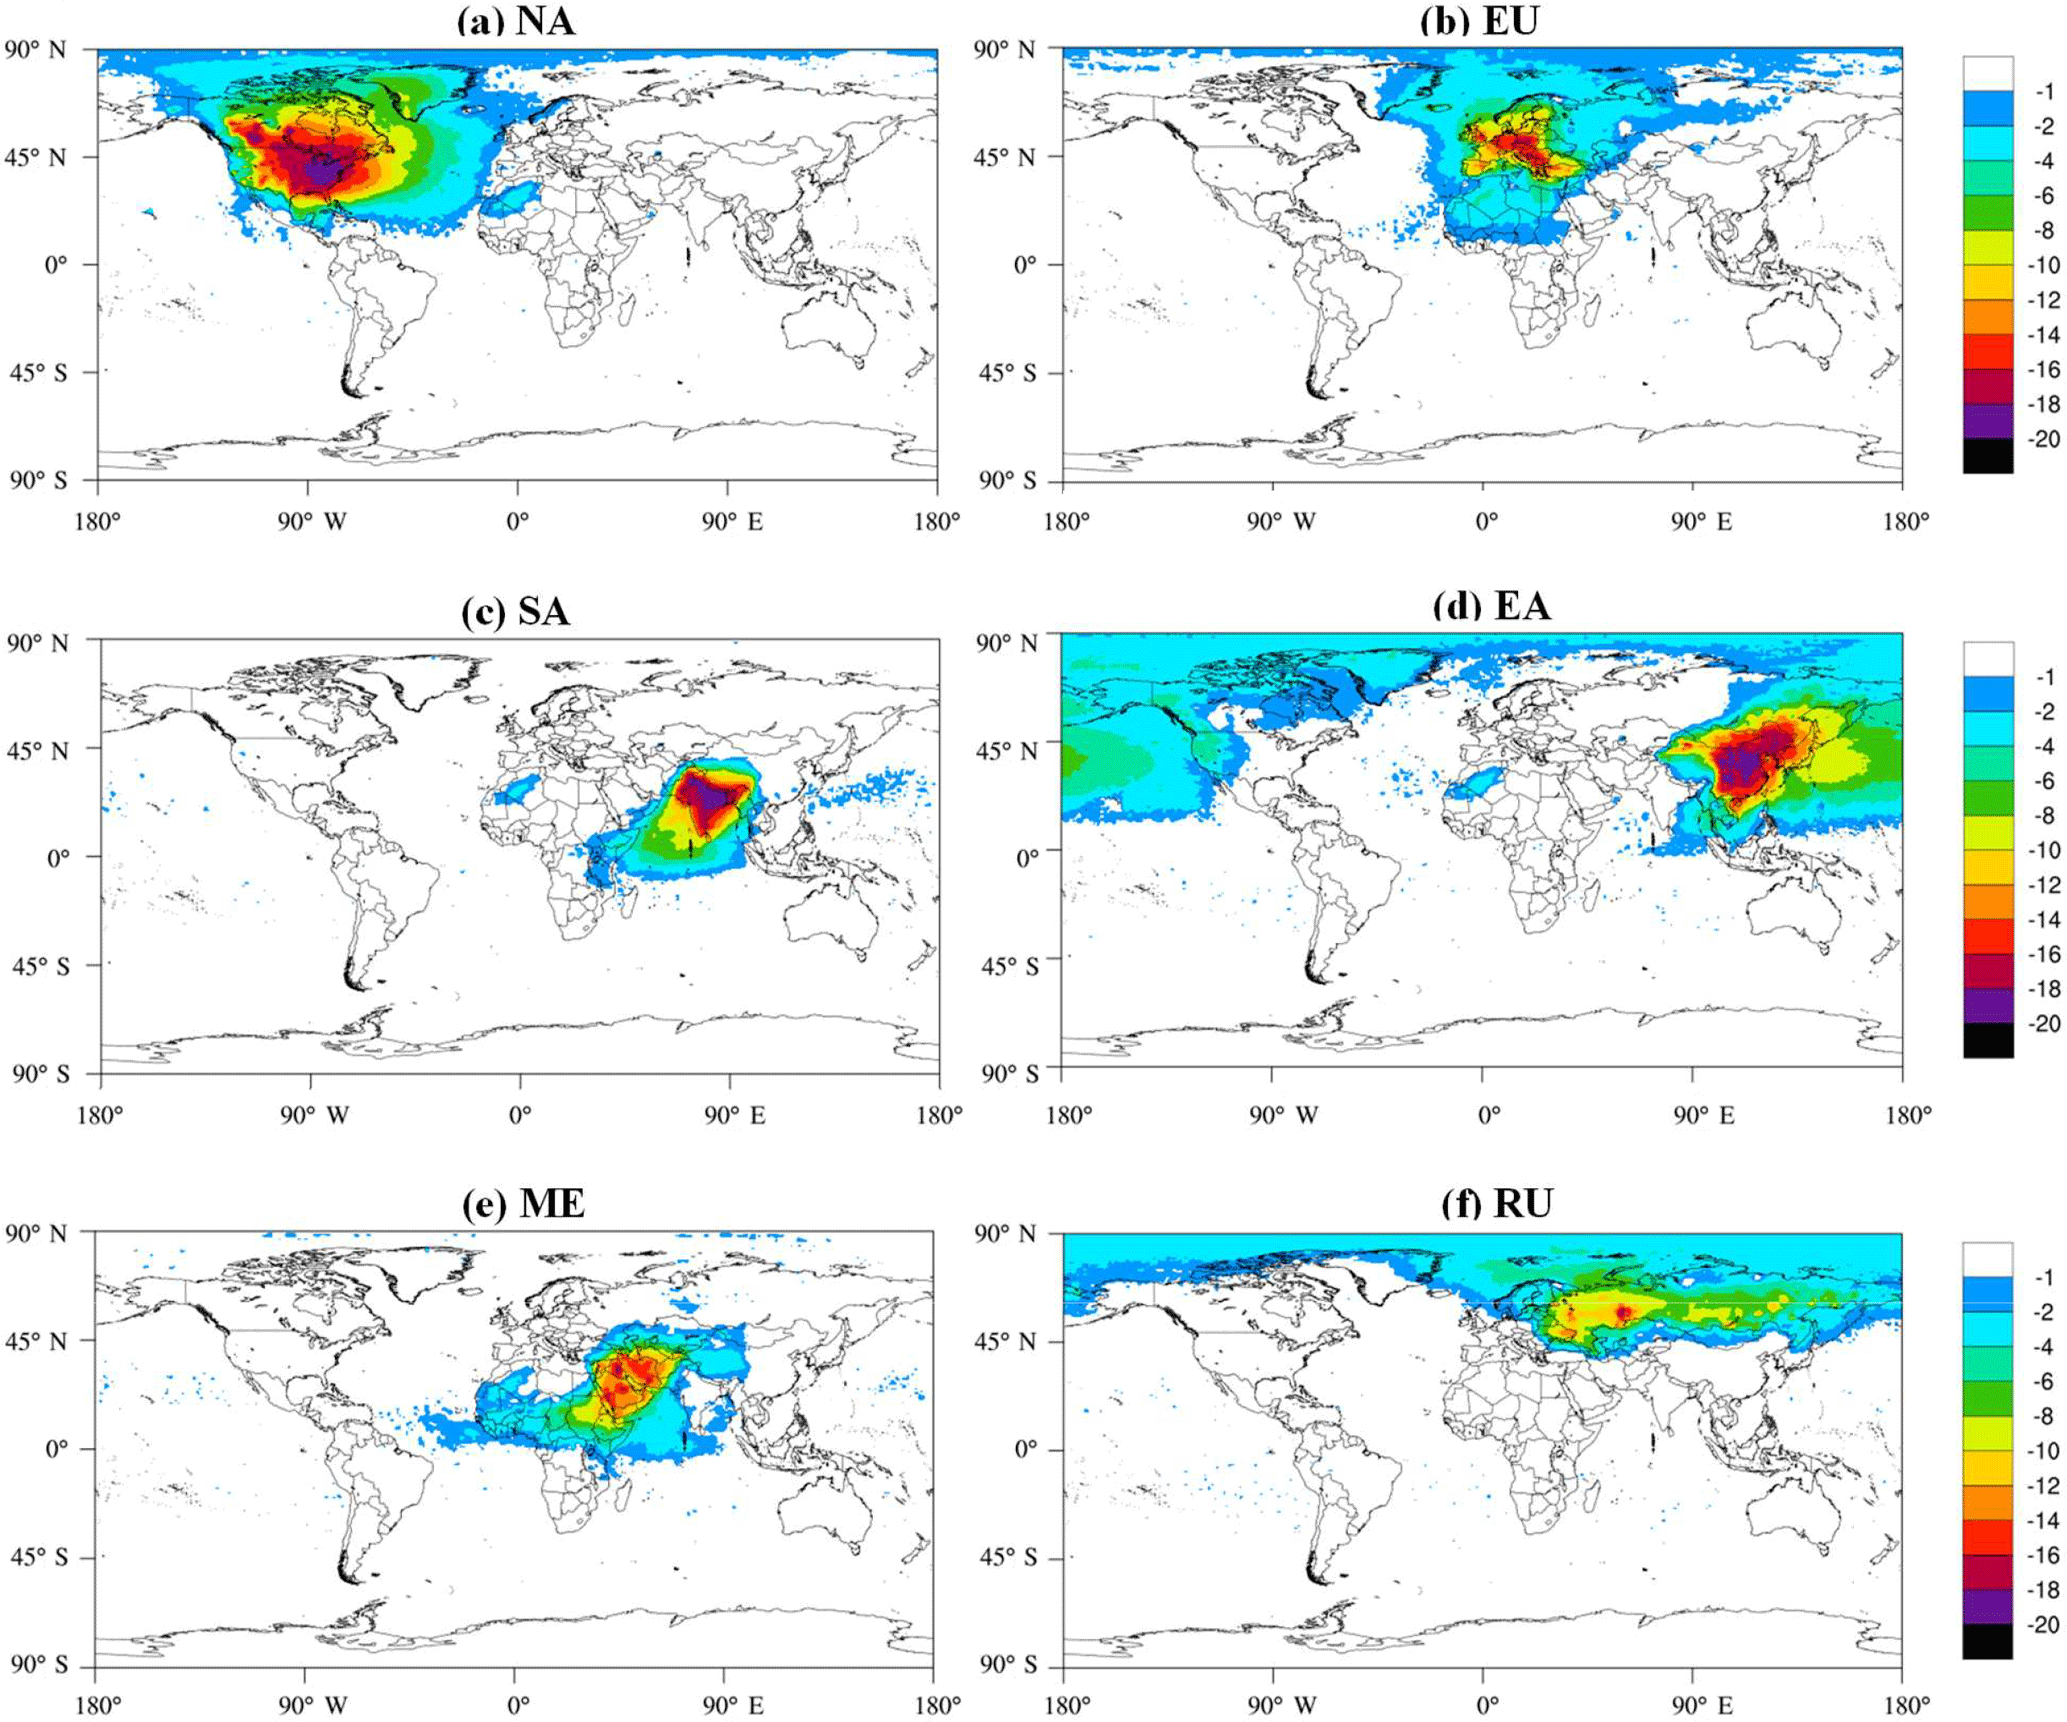
Figure 2The response of S deposition to 20 % emission reduction in the source regions. The values are the percentage changes (%) in deposition calculated as (changes in deposition with 20 % emission reduction) ∕ (base case deposition) × 100 %. The unit is % per grid box.
3.2 Impact of hemispheric transport on deposition
This section investigates the impact of hemispheric transport on deposition in the receptor regions. Figure 2 shows the annual response of S deposition to 20 % emission reduction in the source regions calculated as Eq. (2).
where Δ Depo (perturbation) is the Δ Depo between perturbation case and base case. Depo (base) is the deposition under base case. The negative values mean that the deposition decreases with reduction in emissions. Table S2 summarizes the regional median deposition fluxes under base case and emission perturbation cases. Figure 2a shows the global response of S deposition to 20 % emission reduction in NA. The largest deposition change is found in the source region (NA), with a 4 %–20 % decrease in S deposition in the non-coastal region and 14 %–16 % decrease around the east coast. The impact on the North Atlantic Ocean declines gradually from the near-coastal region (12 %–14 %) to the open ocean (2 %–12 %) and Eurasia (<1 %). Figure 2b shows the global response of S deposition to 20 % emission reduction in EU. Although the impact on continental non-coastal regions is also high (6 %–18 %), the impact on the coastal regions is generally less than 6 %, much lower than NA's impact on its east coast (14 %–16 %). The deposition in North Africa, central Asia and western RU is affected by 2 %–6 %. The 20 % emission reduction in SA (Fig. 2c) shows large influences over its southwest coast and the Arabian Sea (4 %–12 %). The SA's outflow affects the deposition in southeastern ME and eastern Sub-Saharan Africa by 1 %–4 % and western EA and Southeast Asia (mainly Bangladesh) by 2 %–6 %. Figure 2d shows the impact on S deposition from 20 % emission reduction in EA. On one hand, the impact is strong on the east coast of China (12 %–16 %) and decreases gradually over the North Pacific Ocean (4 %–10 %). Although the majority of S emissions are deposited on the North Pacific Ocean, the influence on western NA can still reach 4 %–6 %. On the other hand, the impacts on Southeast Asia and SA are much lower (2 %–5 % and <1 %), due to the block of air flows by the Himalaya mountains (Fig. S4). The 20 % emission reduction in ME mainly affects the S deposition in Africa by 2 %–10 % and western EA by 2 %–4 %. Figure 2f shows the change of S deposition with 20 % emission reduction in RU. The regions of impact are mainly located at high latitudes of the Northern Hemisphere, including northern EU (2 %–6 %) and western Arctic Circle (1 %–4 %). The Russian flow enters the Arctic in the lower troposphere in the winter season (Stohl, 2006).
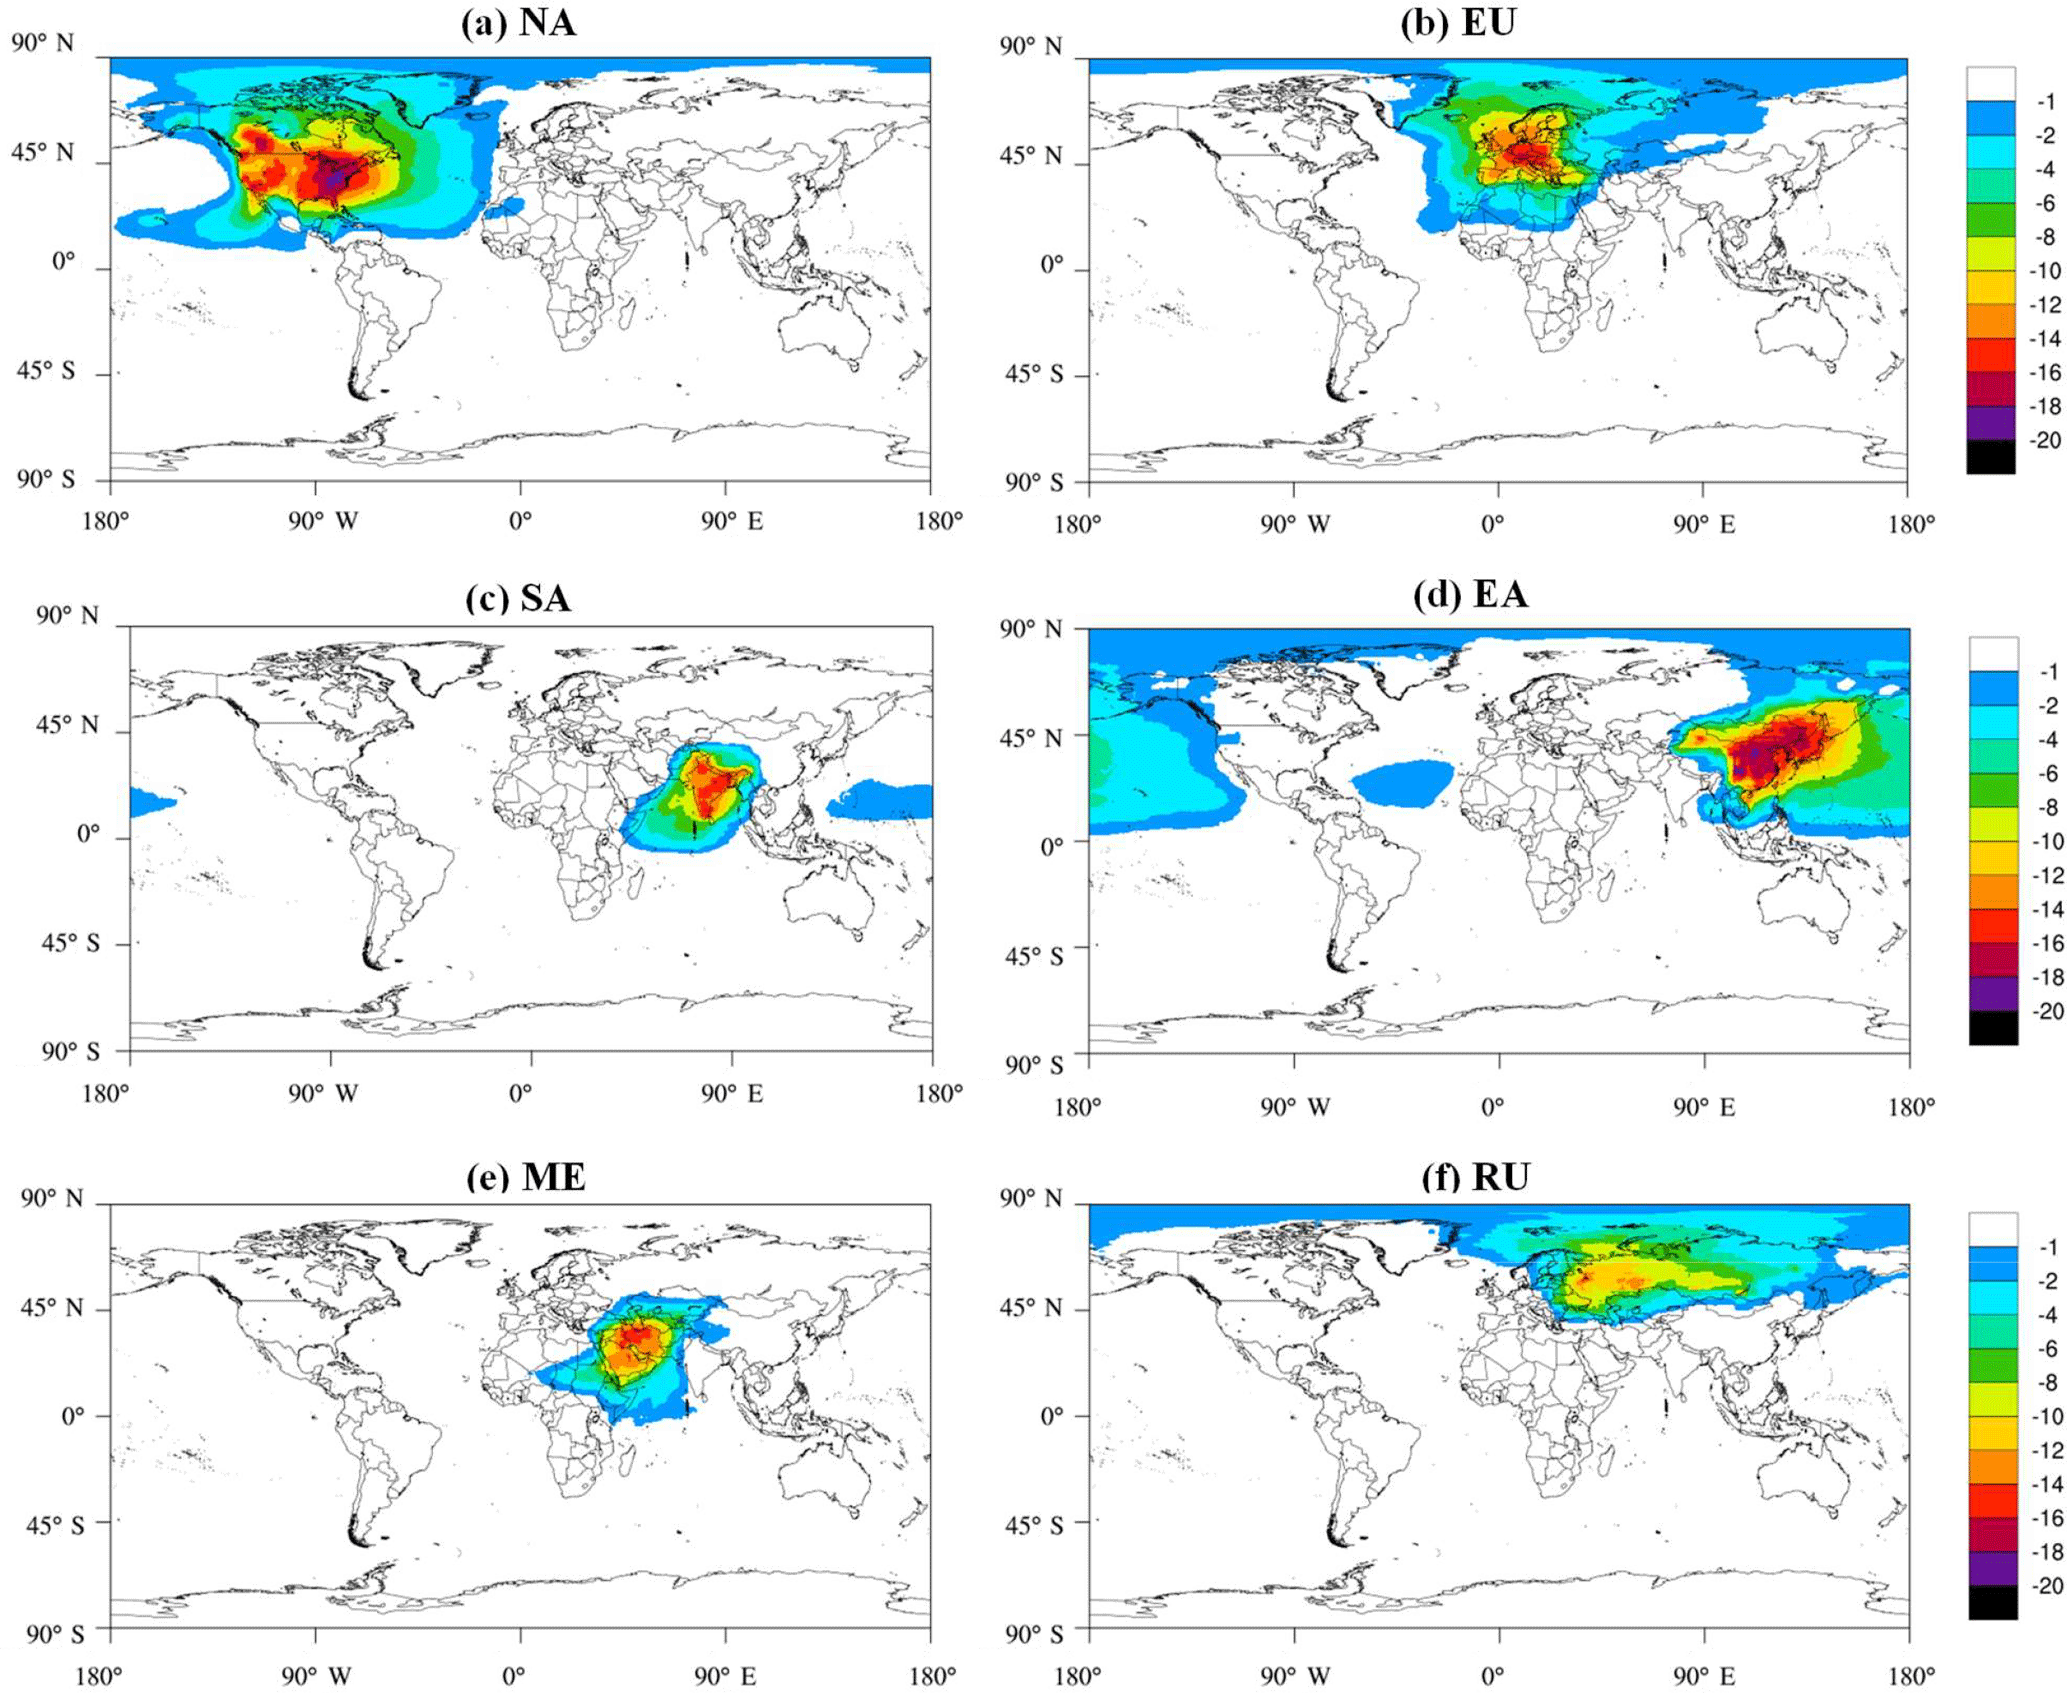
Figure 3 shows the impacts of reducing NOx emissions on NOy deposition. The overall impact is qualitatively similar to that of S emissions in the spatial pattern, with some differences in the values. Some regions receive lower impact on NOy deposition than S deposition. For instance, SA's impact on eastern Africa is about 1 %–4 % on S deposition, but is <1 % on NOy deposition. ME's impact on the western Africa and Gulf of Guinea is about 2 %–4 % on S deposition, but is <1 % on NOy deposition. These smaller sensitivities reflect differences in lifetimes, and the lower formation of aerosol under warm conditions in tropical regions. Under the NA perturbation case (Fig. 3a), 8 %–12 % changes of NOy deposition are found on the west coast of California, due to high NOx emissions in California from mobile sources, which is not seen in S deposition. The impacts of emission reduction in EU and EA on their coastal regions are generally 2 %–4 % higher for NOy deposition than S deposition (Fig. 3b and d). The impact on NHx deposition is similar to that on NOy deposition (Fig. S2). It should be noted that this is the result of 20 % emission reduction in the source regions, therefore the actual impact (100 % emission reduction) could be 5 times higher when assuming a linear relationship between 20 % and 100 % emission reduction on deposition.
We quantify the amount of deposition carried by hemispheric transport and study its seasonality. Figure 4 shows the monthly changes in S deposition for 20 % emission reductions in the source regions. The values are meridional sum with a west–east resolution of 0.1∘, and display well the locations of the source regions. The negative values indicate the amounts of pollutants transported from the source regions to the receptor regions. According to Fig. 4a, NA has about kg (S) month−1 per 0.1∘ longitude of its S emissions transported and deposited over the North Atlantic Ocean (15–75∘ W) throughout the whole year. We also find about kg (S) month−1 per 0.1∘ longitude decrease in S deposition at about 90 and 120∘ E in spring and fall, which gives evidence to NA's influence on Eurasia via the transatlantic flow, although this amount accounts for less than 1 % of local S deposition (white in Eurasia in Fig. 2a). Figure 4b shows that about kg (S) month−1 per 0.1∘ longitude of EU's emissions are transported and deposited at 30–60∘ E in RU throughout the whole year and at 100–120∘ E in EA in spring and fall. According to Fig. 4c, SA exports its S emissions to 30–60∘ E in ME and eastern Africa in early spring and to 90–180∘ E in EA and the North Pacific Ocean from late spring until fall. In particular, the influence on EA can reach kg (S) month−1 per 0.1∘ longitude in mid-spring. According to Fig. 4d, EA's S emissions are widely transported and deposited over the North Pacific Ocean throughout the whole year. The Asian outflow arrives at the west coast of NA (∼130∘ W) in all seasons except summer, but only reaches far in western NA (∼90∘ W) in spring and brings about 1×10⁴ kg (S) month−1 per 0.1∘ longitude of S deposition. The export to SA is only found during the Asia winter monsoon. Figure 5 shows the monthly changes in NOy deposition with perturbation experiments. Compared to S deposition, the change in NOy deposition by hemispheric transport is generally smaller. For instance, the NA's impact on Eurasia is kg (S) month−1 per 0.1∘ longitude for S deposition, but is less than 0.5×10⁴ kg (N) month−1 per 0.1∘ longitude for NOy deposition. The SA's impact on EA (90–120∘ E) can reach kg (S) month−1 per 0.1∘ longitude for S deposition, but the amount is 4 times lower for NOy deposition. This result is in accordance with the S–R results in Sect. 3.1 that more S emissions are transported out of the source regions than N emissions, probably due to longer chemical lifetimes and higher emission altitudes. Patterns similar to NOy deposition are found in the monthly changes in NHx deposition (Fig. S3).
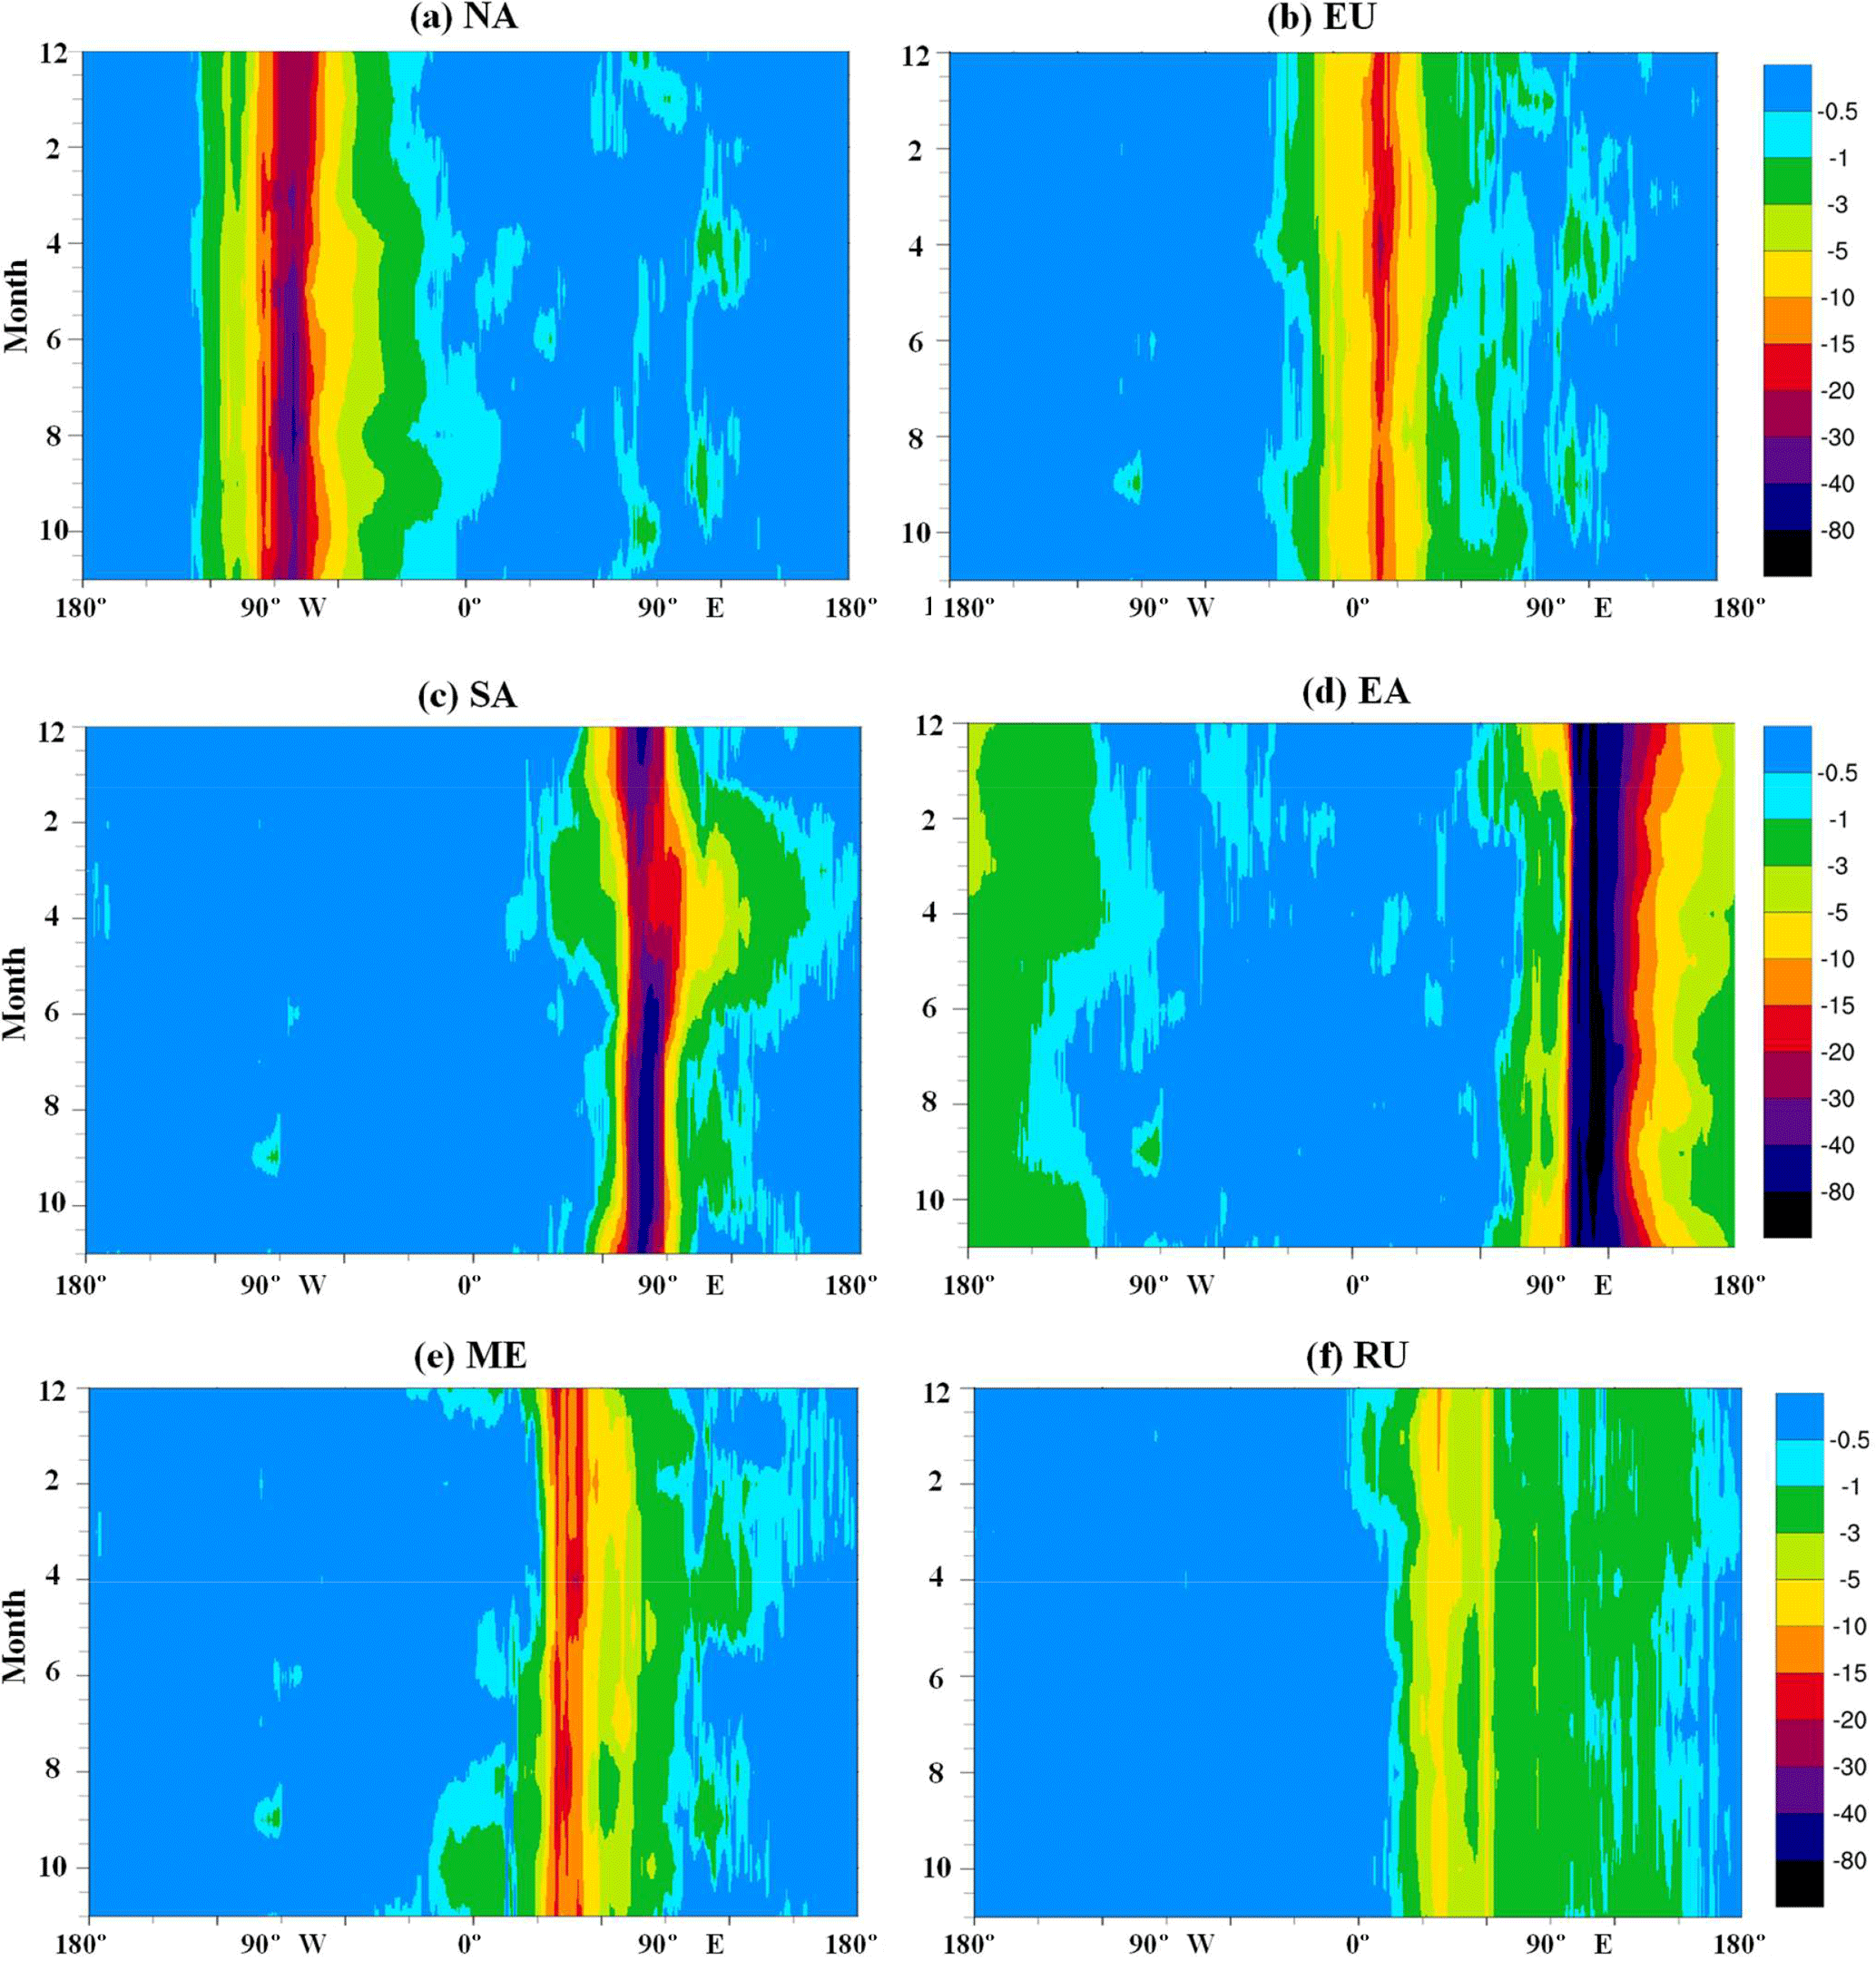
Figure 4The monthly changes in S deposition with 20 % emission reduction in the source regions. The x axis values are meridional total values versus time (y axis) with a west–east resolution of 0.1∘. The unit is ×104 kg (S) month−1 per 0.1∘ longitude. Negative values indicate decline in deposition with reduction in emissions.
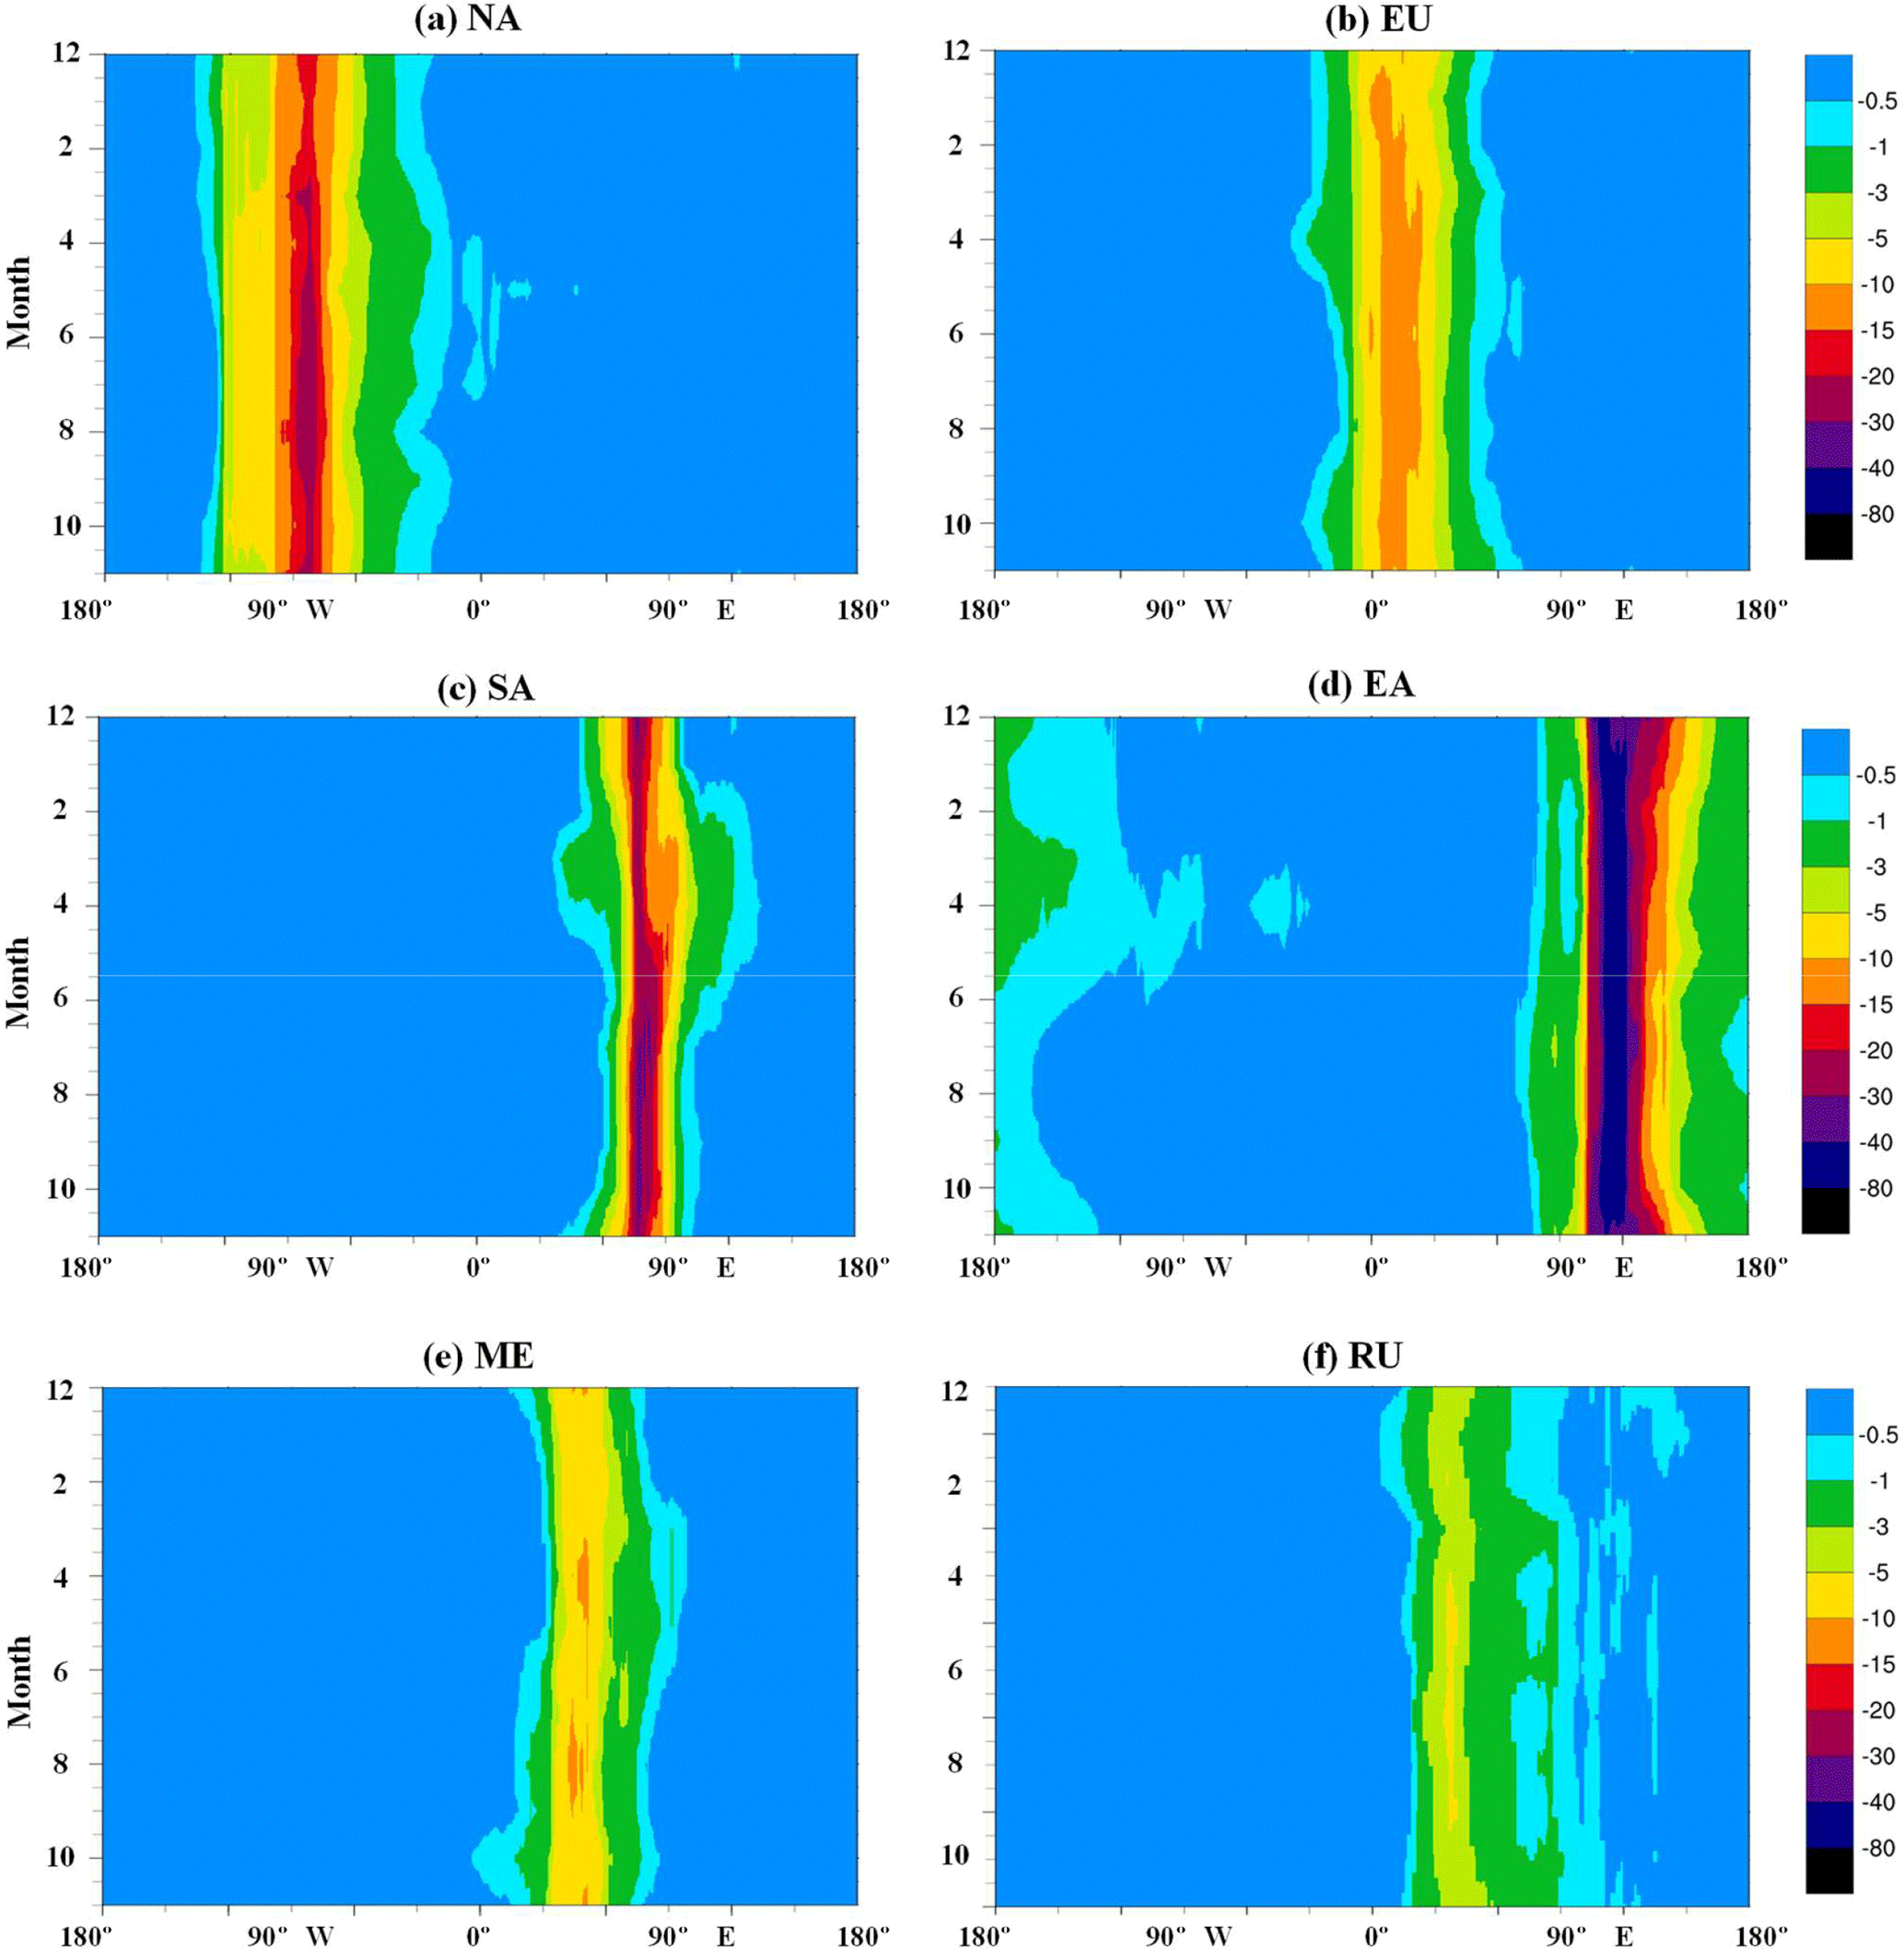
Figure 5Same as Fig. 4 but for NOy deposition. The unit is ×104 kg (N) month−1 per 0.1∘ longitude.
The deposition changes due to transport between neighboring regions are found throughout the whole year and are slightly stronger in winter, such as between EU and RU (∼30∘ E; Fig. 4b and f) and from EA to the North Pacific Ocean (∼130∘ E; Fig. 4d). This is consistent with the seasonality we found for the export of emissions from source regions in Sect. 3.1. In addition, most source regions reduce more S and NOx emissions in winter than the other seasons (Table S3), thus more emissions are exported abroad in this season. On the contrary, the deposition change by transport over long distance mainly occurs in spring and fall, especially the hemispheric transport from NA to EU, from EU to EA and from EA to NA. The seasonality of long-range transport for NA, EU and EA well fits the characteristic of westerlies, which is the prevailing winds in the mid-latitude of the Northern Hemisphere. This agrees with the seasonality of the transpacific, transatlantic and trans-Eurasia flows of air pollutants that spring is the most efficient season for long-range transport in the mid-latitudes (Holzer et al., 2005; Liu et al., 2005, 2003; Liang et al., 2004; Brown-Steiner and Hess, 2011; Li et al., 2014; Auvray and Bey, 2005; Wild et al., 2004). Although the westerlies are also strong in winter, the concentrations of air pollutants in the air flows are lower than spring. The formations of secondary species like PAN are suppressed by slow oxidation in the cold environment (Berntsen et al., 1999; Deolal et al., 2013; Moxim et al., 1996), which plays an important role as a reservoir for NOx in the long-range transport of air plumes (Lin et al., 2010; Hudman et al., 2004).
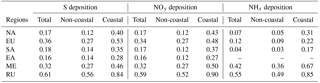
Table 2Extra-regional emission reduction (RERER) values of S, NOy and NHx deposition for continent, non-coastal and coastal regions. The RERER values are calculated by dividing the Δ Depo due to foreign emission reduction by Δ Depo due to global (foreign + own region) emission control. The total column gives the RERER for coastal and non-coastal together.
3.3 Own region and foreign contributions to deposition
This section compares the contributions of hemispheric transport and own-region emission control on local deposition. A metric called RERER is calculated by dividing the Δ Depo due to foreign emission reduction by Δ Depo due to global (foreign + own region) emission control following Eq. (3).
where i is the region of focus. Δ Depoi (foreign) is the Δ Depo in region i due to 20 % foreign emission reduction. It is calculated by subtracting the Δ Depo due to 20 % own-region emission control from Δ Depo due to 20 % global emission reduction. Δ Depoi (global) is the Δ Depo in region i due to 20 % global emission reduction. This metric indicates the importance of foreign or local emissions on local deposition. A low RERER value (close to 0) indicates a predominant effect of own-region emissions on local deposition, while a high RERER value (close to 1) means strong impacts from hemispheric transport.
Table 2 shows the RERER values for total (include both non-coastal and coastal regions), non-coastal and coastal regions. For both non-coastal and coastal regions, the own-region impact includes control of both its coastal and non-coastal regions, and the foreign impact comes from emission reduction of both foreign coastal and foreign non-coastal regions. As we expected, NA (0.07, 0.17 and 0.17), SA (0.04, 0.17 and 0.18) and EA (0.16 and 0.16) regions have relatively low RERER values, due to large local emissions compared to the foreign contributions. EU (0.12, 0.34 and 0.36) and ME (0.32, 0.32 and 0.42) have relatively higher RERER values. RU is the only region with all RERER values (0.55, 0.59 and 0.61) higher than 0.5, which means its deposition is almost equally sensitive to the foreign exported air pollution and own-region control. The RERER values of NOy deposition are of similar magnitudes to those of S deposition, while the RERER values of NHx deposition are 0.1 lower than those two, probably due to the lack of data for the EA perturbation case, so that the contributions from EA are not included.
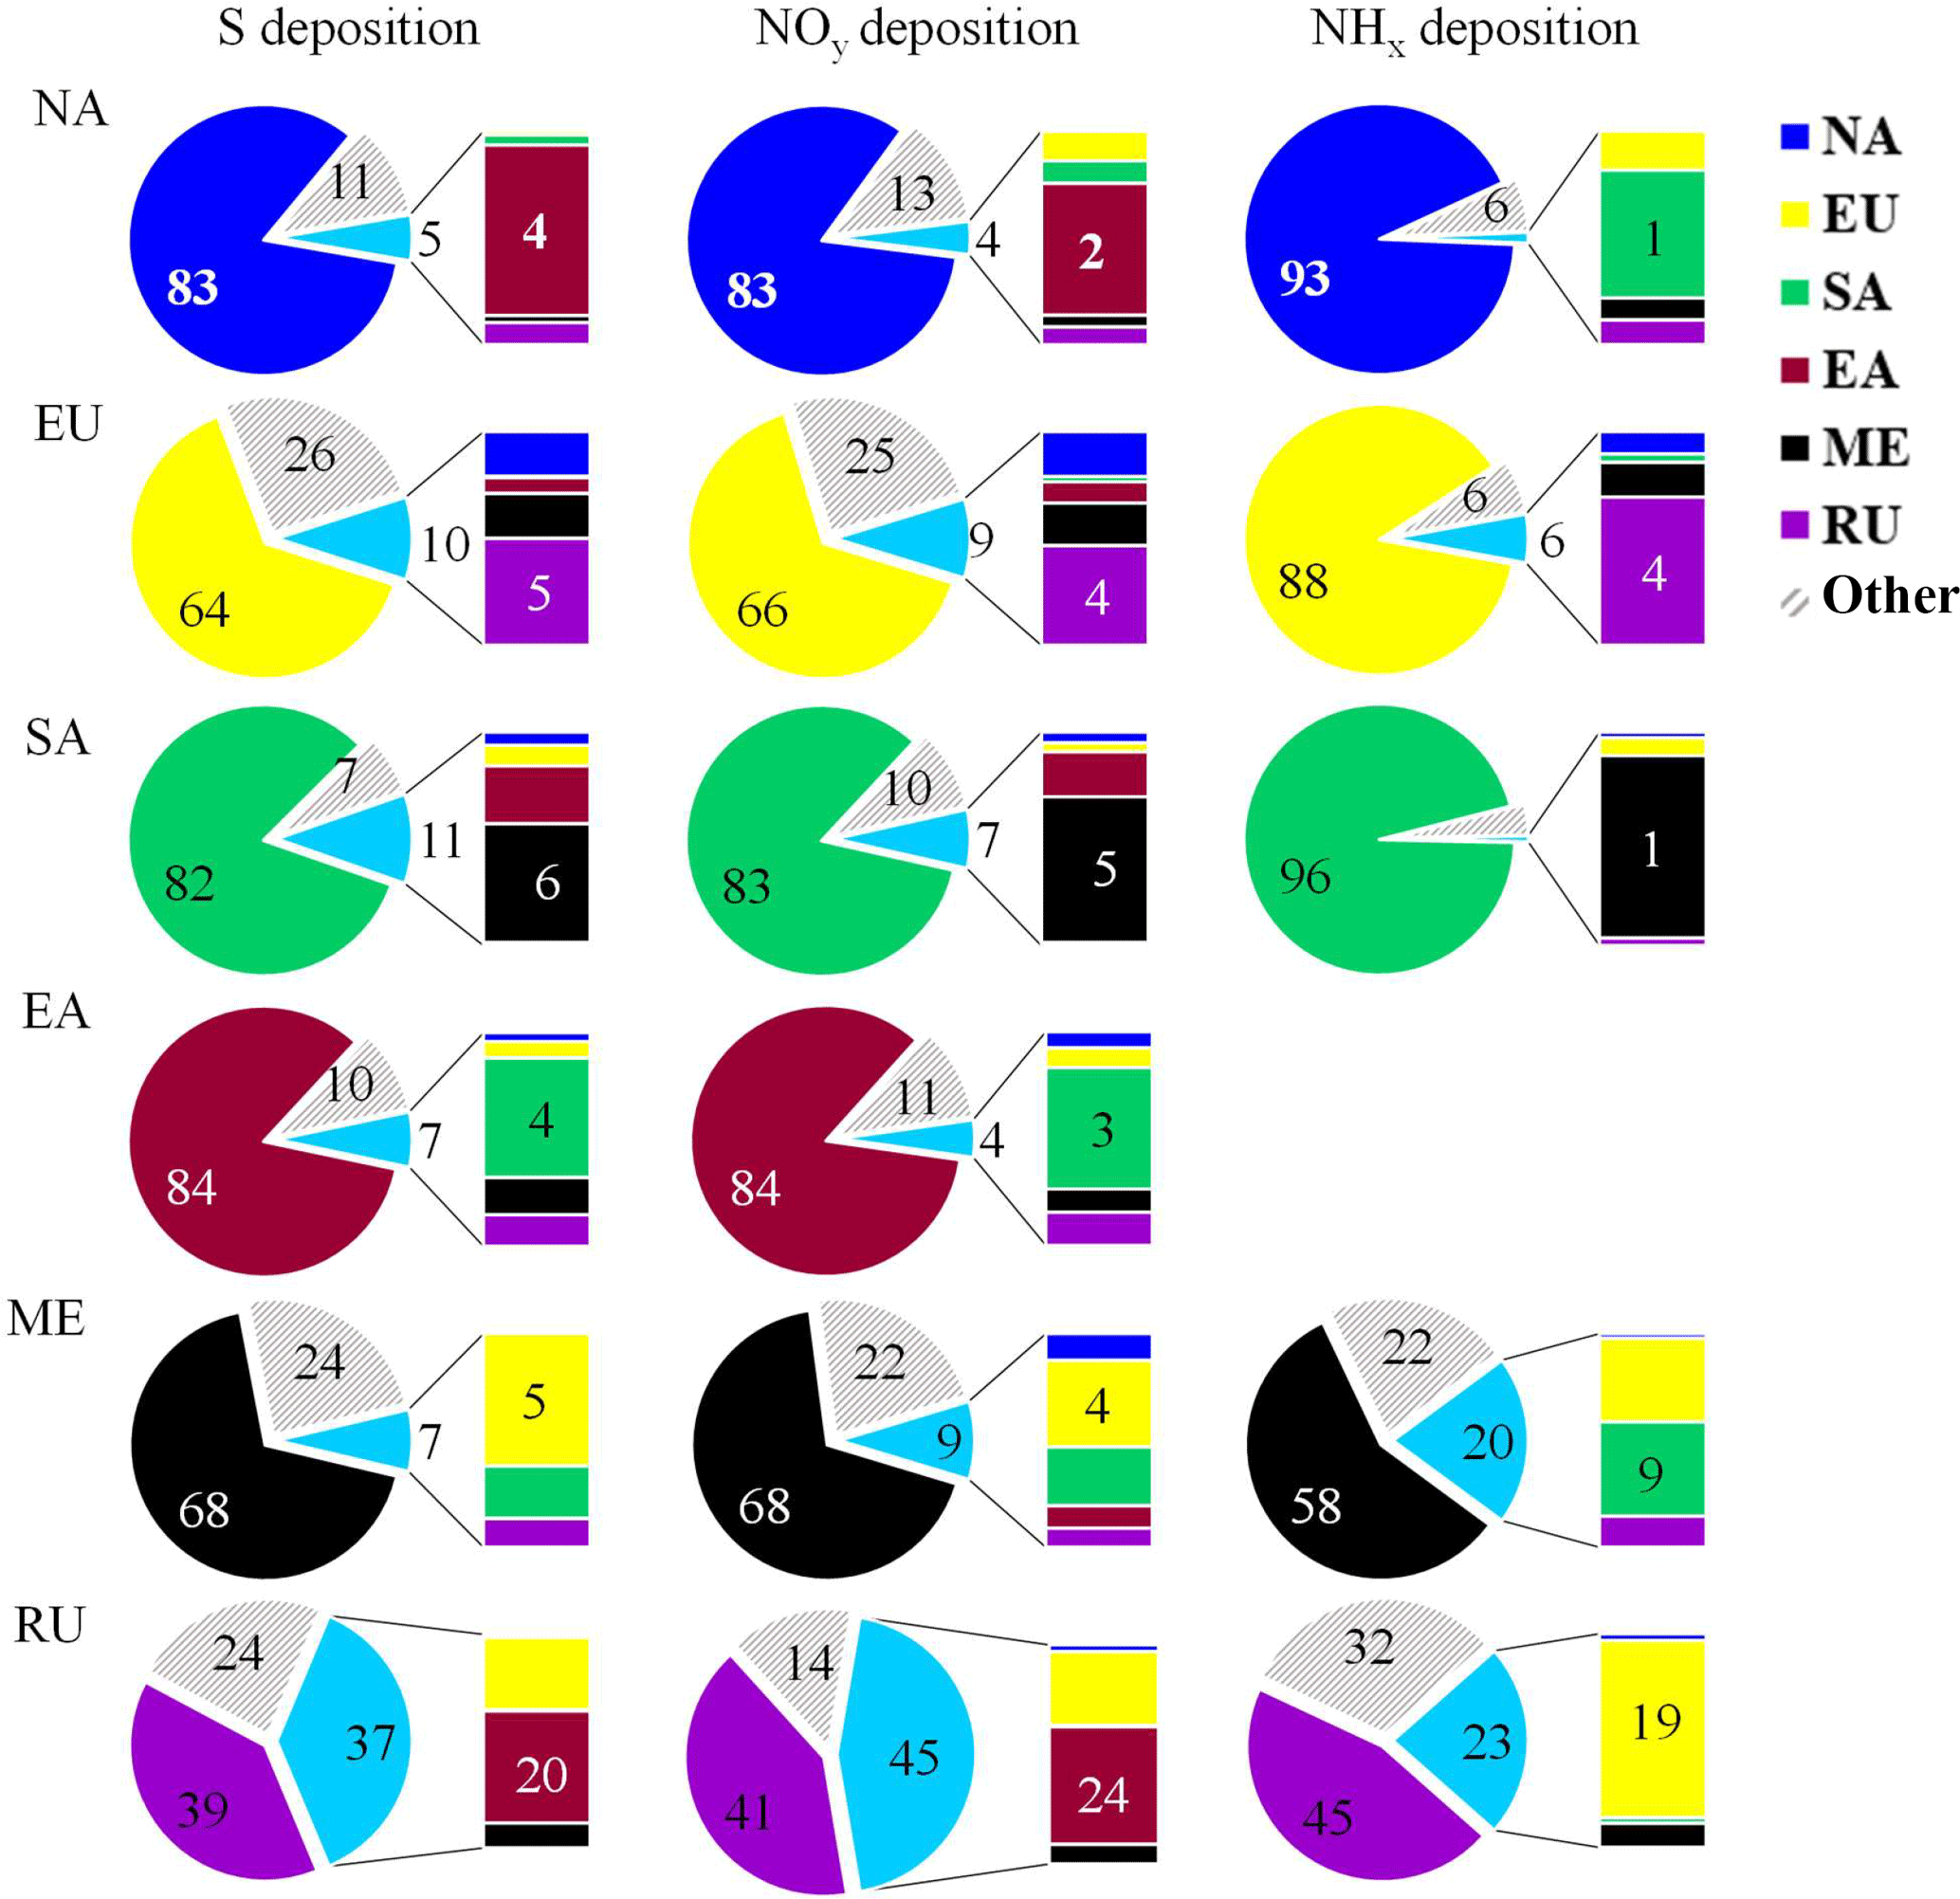
Figure 6Source contribution to S and N deposition from the hemispheric transport from foreign regions and from own-region emissions. Other (OTH, pattern fill) is the contribution by other reasons than the total effects of separate emission reduction of the six regions (see manuscript for details).
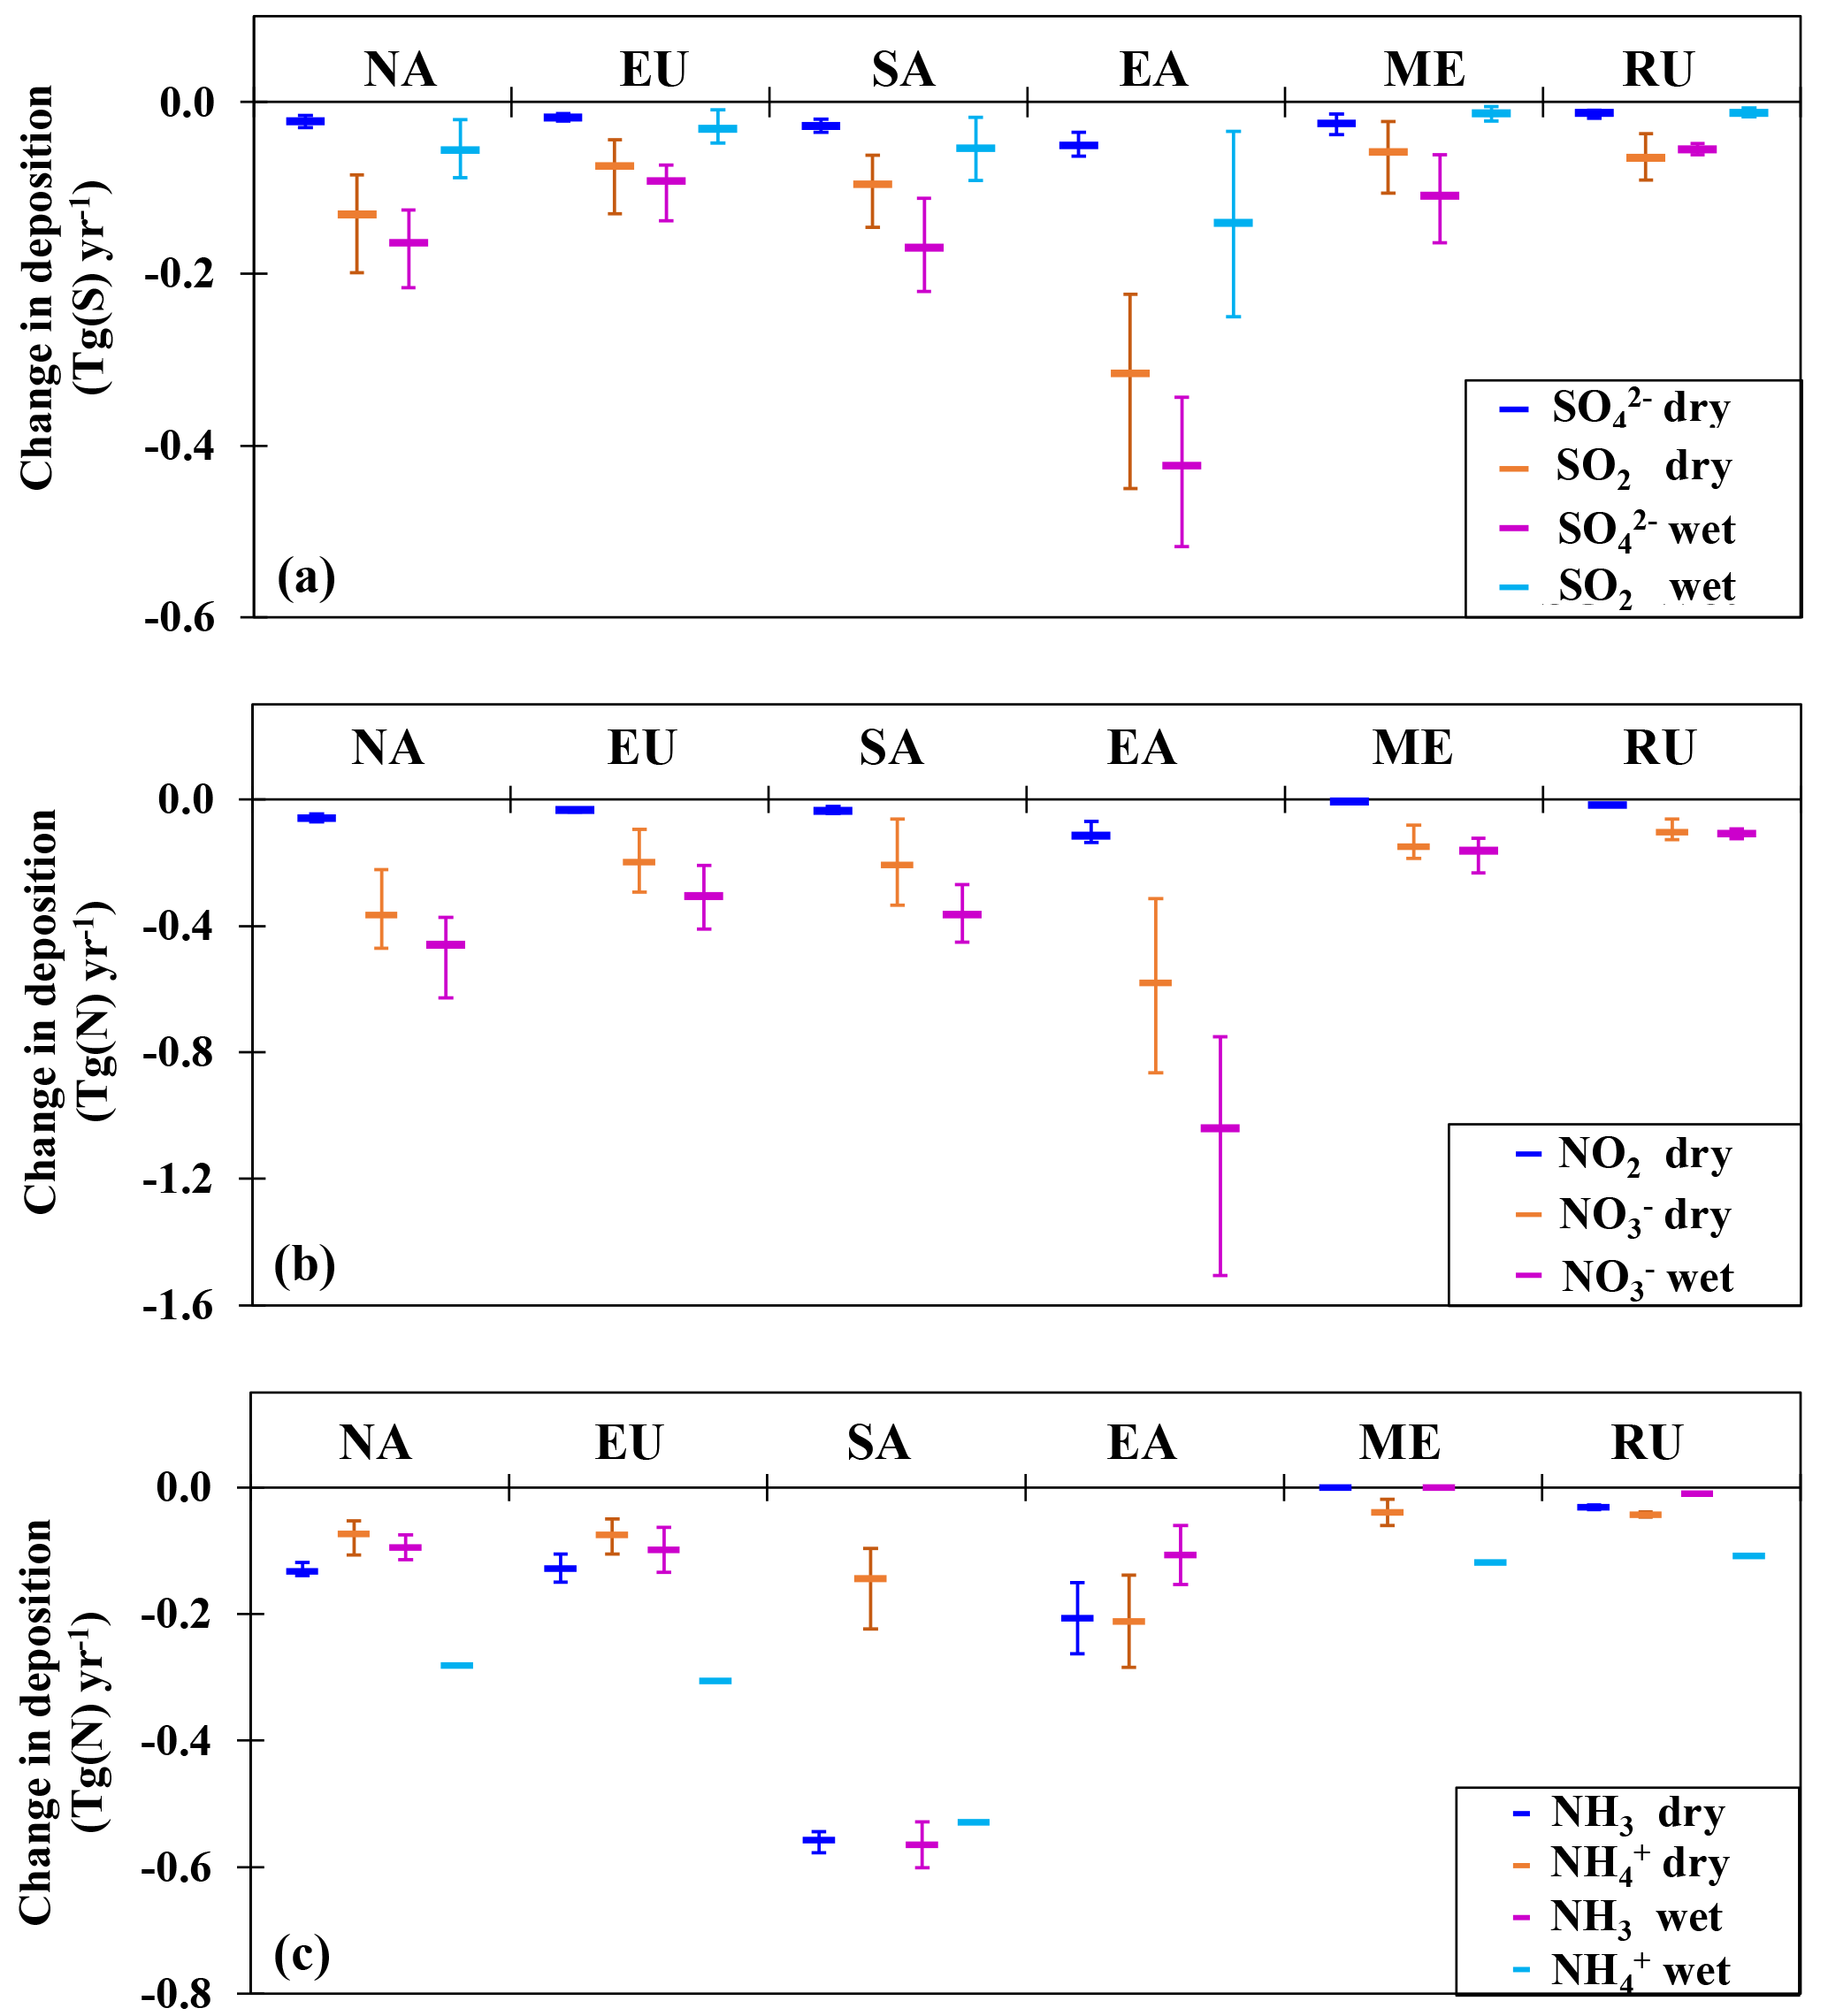
Figure 7Inter-model variations in the change of wet and dry deposition (unit: Tg (S or N) yr−1) under emission perturbation experiments. The values are global integrated changes in components of S and N deposition between base case and perturbation experiments from multi-model mean (MMM) results. The error bars are the max and min values among all models. Species without error bars are derived from results of a single model.
The RERER values of coastal regions are generally 0.1–0.3 higher than those of non-coastal regions. Even regions with low non-coastal RERER values such as NA and SA have high RERER values in coastal regions. For instance, the RERER values of NA reaches 0.3–0.4 for its coastal region, more than double of the RERER values in its non-coastal regions (0.05–0.12). Coastal regions receive high proportions of deposition from the hemispheric transport. Except large-scale circulation like prevailing westerlies, the coastal regions are featured with complex small-scale circulations. For instance, the low-level jet (zonal winds with high speed) contributes to rainfall in coastal regions in Asia (Xavier et al., 2018). The orographic effects enhance the precipitation over coastal mountain regions such as the west coast of NA and EU, and the southeast coast of RU (James and Houze, 2005). According to Table 1, EA exports 5 % of its S and N emissions to RU, almost half of which are deposited on RU's coastal regions. RU exports 7 %–12 % of S and N emissions to EU, 30 % of which are deposited on EU's coastal regions. The impact of hemispheric transport is identical or even larger than the effect of controlling own-region emissions for some coastal or near-coastal regions. According to Fig. 2, 20 % emission reduction in EA can reduce 2 %–6 % of S deposition in the west coast of NA. This effect is even larger than 20 % emission reduction in its own region (<1 %). Similarly, 20 % emission reduction in NA can change 2 %–5 % of S deposition in the west coast of EU, which is almost identical to the effect of 20 % emission control in EU. On one hand, the emissions in western NA and western EU are relatively low, thus the effect of own-region control is not significant. On the other hand, these coastal regions are in the downwind directions of eastern EA and eastern NA, which are the main source regions of S and N emissions. Coastal regions serve as transit places for air–sea exchanges with vulnerable ecosystems (Jickells, 2006; Jickells et al., 2017). The over-richness of deposition in coastal water and ecosystems can evoke a number of environmental issues, of which some are specifically for coastal regions such as threats to coastal benthic and planktonic system and sustainability of fishery (Paerl, 2002; Doney et al., 2007).
Figure 6 shows the source concentrations of deposition from hemispheric transport and own-region emissions. Other (OTH, pattern fill in the figure) is calculated as Δ Depo Depo(case) (case = 6, including NA, EU, SA, EA, ME and RU). It indicates the deposition change due to other reasons than the total effects of separate emission reduction in the six regions. It could come from the emission reduction in the rest of the world, especially nearby regions such as from Central Asia and North Africa to EU and ME. It could also come from the joint effects of emission control in multiple source regions, which possibly change the oxidant chemistry, atmospheric mixing and lifetimes of reactive pollutants. However, the model simulations do not allow us to separate these contributions in this study. For regions with low RERER values (NA, SA and EA), the own-region emissions dominate the local deposition by more than 80 %. For these regions, determined by vicinity and transport patterns, the foreign impact is somewhat dominated by certain source regions, such as from EA to NA (2 %–4 % out of 4 %–5 %), from ME to SA (5 %–6 % out of 7 %–11 %) and from SA to EA (3 %–4 % out of 4 %–7 %). For regions with higher RERER values (i.e., EU and ME), there is an about 20 % contribution from “OTH”. Besides this, RU contributes 4 %–5 % to EU's deposition and EU contributes 5 % to ME's deposition. The high RERER region (i.e., RU) has a different pattern than the other regions. The contributions of hemispheric transport from the other five regions (23 %–45 %) are almost equivalent to its own-region emission control (39 %–45 %), with significant impacts from EA (20 %–24 %) and EU (13 %–15 %).
Figure 7 shows the inter-model variations on simulating the Δ Depo of S, NOy and NHx deposition under emission perturbation cases, separately for wet and dry deposition. The values are global integrated changes in the components of deposition between base case and perturbation experiments from MMM results, with error bars showing the maximum and minimum values of models. The figure only shows the main compositions of S and N deposition, which together account for more than 95 % of total deposition. In terms of S deposition (Fig. 7a), the modeled Δ Depo by multiple models (defined as maximum value of multi-model minus minimum value of multi-model) ranges from 0.06 to 0.23 Tg(N) yr−1 and from 0.01 to 0.22 Tg(N) yr−1 for SO2 dry and wet deposition, respectively, and from 0.01 to 0.03 Tg(N) yr−1 and from 0.009 to 0.17 Tg(N) yr−1 for dry and wet deposition, respectively (ranges are for different cases). High uncertainty is found in the EA perturbation case, where the model divergences are mainly from SO2 wet and dry deposition and wet deposition. In terms of NOy deposition (Fig. 7b), the differences among models range from 0.003 to 0.07 Tg(N) yr−1 for NO2 dry deposition, and from 0.07 to 0.55 Tg(N) yr−1 and from 0.03 to 0.75 Tg(N) yr−1 for dry and wet deposition, respectively. The EA perturbation case also has the largest inter-model variation, with high uncertainties in simulating both the wet and dry deposition. In terms of NHx deposition (Fig. 7c), the differences among models range from 0.04 to 0.09 Tg(N) yr−1 for NH3 dry deposition, and from 0.008 to 0.15 Tg(N) yr−1 and from 0.002 to 0.11 Tg(N) yr−1 for dry and wet deposition, respectively. Both EA and SA perturbation cases have relatively high uncertainties in dry deposition. Overall, the inter-model variations are considerably high under emission perturbation in Asian regions, especially EA. On one hand, the EA perturbation case assumes the largest amounts of emission reduction among all perturbation cases (Table S3). On the other hand, model evaluation (Tan et al., 2018) reported high model bias in simulating the deposition in this region, and suggest an incomplete knowledge from the combined picture provided by observations and models.
This study assesses the impact of hemispheric transport on S and N deposition for six regions: North America (NA), Europe (EU), South Asia (SA), East Asia (EA), Russia (RU) and Middle East (ME), by using multi-model ensemble results from 11 models of HTAP II, with simulations under base case and 20 % emission perturbation scenario for each region.
We investigate the export of S and N emissions and oxidation products from the source regions. Results show that about 27 %–58 %, 26 %–46 % and 12 %–23 % of the emitted S, NOx and NH3 emissions are deposited outside of the source regions (ranges are for different source regions). The most significant exports of emissions are (1) transport between EU and RU, 10 %–14 % of EU's emissions are transported to RU and 7 %–12 % of RU's emissions are transport to EU; (2) transport between EA and RU, 5 % of EA's emissions are transported to RU and 4 %–5 % of RU's emissions are transported to EA; and (3) transport from SA to EA (4 %–9 %). Most regions export 5 %–10 % more emissions in winter than summer, which is highly influenced by chemistry, precipitation amount and frequency, atmospheric mixing, and transport patterns.
We explore the impacts of hemispheric transport on deposition in the receptor regions. Overall, 20 % emission reduction in the source regions could affect 1 %–10 % of deposition in foreign continental regions and 1 %–14 % in foreign coastal regions and the open ocean. The most significant impacts are from NA to the North Atlantic Ocean (2 %–14 %), and from EA to the North Pacific Ocean (2 %–12 %) and to western NA (4 %–6 %). The amounts of deposition brought by hemispheric transport range 104–105 kg (S or N) month−1 per 0.1∘ longitude (meridional sum). The impact via short-distance transport between neighboring regions (i.e., EU to RU) is generally found throughout the whole year and slightly stronger in winter, while the long-range transport (i.e., from EA to NA) mainly occurs in spring and fall.
We compare the contributions of own-region emissions and hemispheric transport on local deposition. The deposition in NA, SA and EA is dominated (∼80 %) by their own-region emissions, while EU, ME and RU receive 40 %–60 % of deposition from hemispheric transport. In particular, Russian deposition is even equally contributed by foreign inputs and own-region emissions, with high contributions from two neighboring source regions: EA (∼20 %) and EU (∼15 %). For some regions, the upmost half of the exported emissions from foreign regions is deposited over their coastal regions. Deposition in coastal regions or the near-coastal open ocean is found to be twice as sensitive to long-range transport than non-coastal regions. For some coastal regions, such as the west coast of NA and the west coast of the EU, the impact of hemispheric transport is identical or even larger than controlling own-region emissions.
This study highlights the impact of hemispheric transport on aggravating the deposition burden in coastal regions and the open ocean, which has not been fully studied in the literature. We therefore suggest further research on the impact of the mitigation of coastal and oceanic ecosystem, with regards to the increasing air pollutants in the hemispheric outflow. We also find a significant impact of hemispheric transport on deposition in relatively low-emission-intensity regions such as RU. Meanwhile, there is still a portion of foreign impacts that have not been attributed in this study (aggregated as “OTH” in Fig. 6). For instance, at least four regions (NA, EU, SA and ME) have shown considerable impacts (2 %–10 %) on the S and N deposition in North Africa. But since North Africa is not included as a receptor or source region in the perturbation experiments, it is hard to quantify the amount. Meanwhile, Southeast Asia is regarded as a big emission contributor in Asia. It is important to establish an S–R relationship with other Asian regions. We suggest the future HTAP simulations to include these regions in the perturbation experiments.
The model data can be downloaded upon request from the AeroCom database (TF HTAP, 2018).
The supplement related to this article is available online at: https://doi.org/10.5194/acp-18-12223-2018-supplement.
JT and JSF designed the study. JT prepared the multi-model ensemble results and analyzed the data with help from JSF, QZ and CEY. FD suggested data analysis. FD and TK coordinated HTAP-II. LE and ST provided CAM-Chem model results. JF provided C-IFS_v2 model results. TT provided SPRINTARS model results. HB provided GEOS5 model results. JT wrote the manuscript and JSF edited it with contributions from all co-authors.
The authors declare that they have no conflict of interest.
This article is part of the special issue “Global and regional assessment of intercontinental transport of air pollution: results from HTAP, AQMEII and MICS”. It is not associated with a conference.
We thank all participating modeling groups in HTAP II for providing the
simulation data. The National Center for Atmospheric Research (NCAR) is
funded by the National Science Foundation. The CESM project is supported by
the National Science Foundation and the Office of Science (BER) of the US
Department of Energy. Computing resources were provided by the Climate
Simulation Laboratory at NCAR's Computational and Information Systems
Laboratory (CISL), sponsored by the National Science Foundation and other
agencies. We acknowledge the support by NASA HAQAST (grant no. NNX16AQ19G).
We also acknowledge the support by the supercomputer system of the National
Institute for Environmental Studies, Japan, and the Environment Research and
Technology Development Fund (S-12-3) of the Ministry of the Environment,
Japan, JSPS KAKENHI (grant no. 5H01728)
Edited
by: Christian Hogrefe
Reviewed by: two anonymous referees
Arndt, R. L. and Carmichael, G. R.: Long-range transport and deposition of sulfur in Asia, Water Air Soil Poll., 85, 2283–2288, https://doi.org/10.1007/BF01186174,1995.
Auvray, M. and Bey, I.: Long-range transport to Europe: Seasonal variations and implications for the European ozone budget, J. Geophys. Res.-Atmos., 110, D11303, https://doi.org/10.1029/2004JD005503, 2005.
Bergstrom, A. K. and Jansson, M.: Atmospheric nitrogen deposition has caused nitrogen enrichment and eutrophication of lakes in the northern hemisphere, Glob. Change Biol., 12, 635–643, https://doi.org/10.1111/j.1365-2486.2006.01129.x, 2006.
Berntsen, T. K., Karlsdottir, S., and Jaffe, D. A.: Influence of Asian emissions on the composition of air reaching the North Western United States, Geophys. Res. Lett., 26, 2171–2174, https://doi.org/10.1029/1999GL900477, 1999.
Bey, I., Jacob, D. J., Logan, J. A., and Yantosca, R. M.: Asian chemical outflow to the Pacific in spring: Origins, pathways, and budgets, J. Geophys. Res.-Atmos., 106, 23097–23113, https://doi.org/10.1029/2001jd000806, 2001.
Bian, H., Chin, M., Hauglustaine, D. A., Schulz, M., Myhre, G., Bauer, S. E., Lund, M. T., Karydis, V. A., Kucsera, T. L., Pan, X., Pozzer, A., Skeie, R. B., Steenrod, S. D., Sudo, K., Tsigaridis, K., Tsimpidi, A. P., and Tsyro, S. G.: Investigation of global particulate nitrate from the AeroCom phase III experiment, Atmos. Chem. Phys., 17, 12911–12940, https://doi.org/10.5194/acp-17-12911-2017, 2017.
Bleeker, A., Hicks, W. K., Dentener, E., Galloway, J., and Erisman, J. W.: N deposition as a threat to the World's protected areas under the Convention on Biological Diversity, Environ. Pollut., 159, 2280–2288, https://doi.org/10.1016/j.envpol.2010.10.036, 2011.
Bobbink, R., Hicks, K., Galloway, J., Spranger, T., Alkemade, R., Ashmore, M., Bustamante, M., Cinderby, S., Davidson, E., Dentener, F., Emmett, B., Erisman, J. W., Fenn, M., Gilliam, F., Nordin, A., Pardo, L., and De Vries, W.: Global assessment of nitrogen deposition effects on terrestrial plant diversity: a synthesis, Ecol. Appl., 20, 30–59, https://doi.org/10.1890/08-1140.1, 2010.
Bouwman, A. F., Van Vuuren, D. P., Derwent, R. G., and Posch, M.: A global analysis of acidification and eutrophication of terrestrial ecosystems, Water Air Soil Poll., 141, 349–382, https://doi.org/10.1023/a:1021398008726, 2002.
Brown-Steiner, B. and Hess, P.: Asian influence on surface ozone in the United States: A comparison of chemistry, seasonality, and transport mechanisms, J. Geophys. Res.-Atmos., 116, D17309, https://doi.org/10.1029/2011jd015846, 2011.
Chin, M., Diehl, T., Tan, Q., Prospero, J. M., Kahn, R. A., Remer, L. A., Yu, H., Sayer, A. M., Bian, H., Geogdzhayev, I. V., Holben, B. N., Howell, S. G., Huebert, B. J., Hsu, N. C., Kim, D., Kucsera, T. L., Levy, R. C., Mishchenko, M. I., Pan, X., Quinn, P. K., Schuster, G. L., Streets, D. G., Strode, S. A., Torres, O., and Zhao, X.-P.: Multi-decadal aerosol variations from 1980 to 2009: a perspective from observations and a global model, Atmos. Chem. Phys., 14, 3657–3690, https://doi.org/10.5194/acp-14-3657-2014, 2014.
Clark, C. M. and Tilman, D.: Loss of plant species after chronic low-level nitrogen deposition to prairie grasslands, Nature, 451, 712–715, https://doi.org/10.1038/nature06503, 2008.
Dentener, F., Drevet, J., Lamarque, J. F., Bey, I., Eickhout, B., Fiore, A. M., Hauglustaine, D., Horowitz, L. W., Krol, M., Kulshrestha, U. C., Lawrence, M., Galy-Lacaux, C., Rast, S., Shindell, D., Stevenson, D., Van Noije, T., Atherton, C., Bell, N., Bergman, D., Butler, T., Cofala, J., Collins, B., Doherty, R., Ellingsen, K., Galloway, J., Gauss, M., Montanaro, V., Muller, J. F., Pitari, G., Rodriguez, J., Sanderson, M., Solmon, F., Strahan, S., Schultz, M., Sudo, K., Szopa, S., and Wild, O.: Nitrogen and sulfur deposition on regional and global scales: A multimodel evaluation, Glob. Biogeochem Cy., 20, GB4003, https://doi.org/10.1029/2005gb002672, 2006.
Deolal, S. P., Staehelin, J., Brunner, D., Cui, J. B., Steinbacher, M., Zellweger, C., Henne, S., and Vollmer, M. K.: Transport of PAN and NOy from different source regions to the Swiss high alpine site Jungfraujoch, Atmos. Environ., 64, 103–115, https://doi.org/10.1016/j.atmosenv.2012.08.021, 2013.
Derwent, R. G., Stevenson, D. S., Collins, W. J., and Johnson, C. E.: Intercontinental transport and the origins of the ozone observed at surface sites in Europe, Atmos. Environ., 38, 1891–1901, https://doi.org/10.1016/j.atmosenv.2004.01.008, 2004.
Doney, S. C., Mahowald, N., Lima, I., Feely, R. A., Mackenzie, F. T., Lamarque, J. F., and Rasch, P. J.: Impact of anthropogenic atmospheric nitrogen and sulfur deposition on ocean acidification and the inorganic carbon system, P. Natl. Acad. Sci. USA, 104, 14580–14585, https://doi.org/10.1073/pnas.0702218104, 2007.
Duce, R. A., LaRoche, J., Altieri, K., Arrigo, K. R., Baker, A. R., Capone, D. G., Cornell, S., Dentener, F., Galloway, J., Ganeshram, R. S., Geider, R. J., Jickells, T., Kuypers, M. M., Langlois, R., Liss, P. S., Liu, S. M., Middelburg, J. J., Moore, C. M., Nickovic, S., Oschlies, A., Pedersen, T., Prospero, J., Schlitzer, R., Seitzinger, S., Sorensen, L. L., Uematsu, M., Ulloa, O., Voss, M., Ward, B., and Zamora, L.: Impacts of atmospheric anthropogenic nitrogen on the open ocean, Science, 320, 893–897, https://doi.org/10.1126/science.1150369, 2008.
Duncan, B. N. and Bey, I.: A modeling study of the export pathways of pollution from Europe: Seasonal and interannual variations (1987–1997), J. Geophys. Res.-Atmos., 109, D08301, https://doi.org/10.1029/2003JD004079, 2004.
Duncan, B. N., West, J. J., Yoshida, Y., Fiore, A. M., and Ziemke, J. R.: The influence of European pollution on ozone in the Near East and northern Africa, Atmos. Chem. Phys., 8, 2267–2283, https://doi.org/10.5194/acp-8-2267-2008, 2008.
Fiore, A. M., Dentener, F. J., Wild, O., Cuvelier, C., Schultz, M. G., Hess, P., Textor, C., Schulz, M., Doherty, R. M., Horowitz, L. W., MacKenzie, I. A., Sanderson, M. G., Shindell, D. T., Stevenson, D. S., Szopa, S., Van Dingenen, R., Zeng, G., Atherton, C., Bergmann, D., Bey, I., Carmichael, G., Collins, W. J., Duncan, B. N., Faluvegi, G., Folberth, G., Gauss, M., Gong, S., Hauglustaine, D., Holloway, T., Isaksen, I. S. A., Jacob, D. J., Jonson, J. E., Kaminski, J. W., Keating, T. J., Lupu, A., Marmer, E., Montanaro, V., Park, R. J., Pitari, G., Pringle, K. J., Pyle, J. A., Schroeder, S., Vivanco, M. G., Wind, P., Wojcik, G., Wu, S., and Zuber, A.: Multimodel estimates of intercontinental source-receptor relationships for ozone pollution, J. Geophys. Res., 114, D04301, https://doi.org/10.1029/2008jd010816, 2009.
Fu, J. S., Dong, X. Y., Gao, Y., Wong, D. C., and Lam, Y. F.: Sensitivity and linearity analysis of ozone in East Asia: The effects of domestic emission and intercontinental transport, J. Air Waste Manage., 62, 1102–1114, https://doi.org/10.1080/10962247.2012.699014, 2012.
Galloway, J. N., Townsend, A. R., Erisman, J. W., Bekunda, M., Cai, Z. C., Freney, J. R., Martinelli, L. A., Seitzinger, S. P., and Sutton, M. A.: Transformation of the nitrogen cycle: Recent trends, questions, and potential solutions, Science, 320, 889–892, https://doi.org/10.1126/science.1136674, 2008.
Galmarini, S., Koffi, B., Solazzo, E., Keating, T., Hogrefe, C., Schulz, M., Benedictow, A., Griesfeller, J. J., Janssens-Maenhout, G., Carmichael, G., Fu, J., and Dentener, F.: Technical note: Coordination and harmonization of the multi-scale, multi-model activities HTAP2, AQMEII3, and MICS-Asia3: simulations, emission inventories, boundary conditions, and model output formats, Atmos. Chem. Phys., 17, 1543–1555, https://doi.org/10.5194/acp-17-1543-2017, 2017.
Glotfelty, T., Zhang, Y., Karamchandani, P., and Streets, D. G.: Will the role of intercontinental transport change in a changing climate?, Atmos. Chem. Phys., 14, 9379–9402, https://doi.org/10.5194/acp-14-9379-2014, 2014.
Guerova, G., Bey, I., Attié, J.-L., Martin, R. V., Cui, J., and Sprenger, M.: Impact of transatlantic transport episodes on summertime ozone in Europe, Atmos. Chem. Phys., 6, 2057–2072, https://doi.org/10.5194/acp-6-2057-2006, 2006.
Guo, J. H., Liu, X. J., Zhang, Y., Shen, J. L., Han, W. X., Zhang, W. F., Christie, P., Goulding, K. W. T., Vitousek, P. M., and Zhang, F. S.: Significant Acidification in Major Chinese Croplands, Science, 327, 1008–1010, https://doi.org/10.1126/science.1182570, 2010.
Holzer, M., Hall, T. M., and Stull, R. B.: Seasonality and weather-driven variability of transpacific transport, J. Geophys. Res.-Atmos., 110, D23103, https://doi.org/10.1029/2005jd006261, 2005.
Hudman, R. C., Jacob, D. J., Cooper, O. R., Evans, M. J., Heald, C. L., Park, R. J., Fehsenfeld, F., Flocke, F., Holloway, J., Hubler, G., Kita, K., Koike, M., Kondo, Y., Neuman, A., Nowak, J., Oltmans, S., Parrish, D., Roberts, J. M., and Ryerson, T.: Ozone production in transpacific Asian pollution plumes and implications for ozone air quality in California, J. Geophys. Res.-Atmos., 109, D23S10, https://doi.org/10.1029/2004JD004974, 2004.
Jacob, D. J., Logan, J. A., and Murti, P. P.: Effect of rising Asian emissions on surface ozone in the United States, Geophys. Res. Lett., 26, 2175–2178, https://doi.org/10.1029/1999gl900450, 1999.
Jaffe, D., Price, H., Parrish, D., Goldstein, A., and Harris, J.: Increasing background ozone during spring on the west coast of North America, Geophys. Res. Lett., 30, 1613, https://doi.org/10.1029/2003gl017024, 2003.
James, C. N. and Houze, R. A.: Modification of precipitation by coastal orography in storms crossing northern California, Mon. Weather Rev., 133, 3110–3131, https://doi.org/10.1175/MWR3019.1, 2005.
Janssens, I. A., Dieleman, W., Luyssaert, S., Subke, J. A., Reichstein, M., Ceulemans, R., Ciais, P., Dolman, A. J., Grace, J., Matteucci, G., Papale, D., Piao, S. L., Schulze, E. D., Tang, J., and Law, B. E.: Reduction of forest soil respiration in response to nitrogen deposition, Nat. Geosci., 3, 315–322, https://doi.org/10.1038/ngeo844, 2010.
Janssens-Maenhout, G., Crippa, M., Guizzardi, D., Dentener, F., Muntean, M., Pouliot, G., Keating, T., Zhang, Q., Kurokawa, J., Wankmüller, R., Denier van der Gon, H., Kuenen, J. J. P., Klimont, Z., Frost, G., Darras, S., Koffi, B., and Li, M.: HTAP_v2.2: a mosaic of regional and global emission grid maps for 2008 and 2010 to study hemispheric transport of air pollution, Atmos. Chem. Phys., 15, 11411–11432, https://doi.org/10.5194/acp-15-11411-2015, 2015.
Jickells, T.: The role of air-sea exchange in the marine nitrogen cycle, Biogeosciences, 3, 271–280, https://doi.org/10.5194/bg-3-271-2006, 2006.
Jickells, T. D., Buitenhuis, E., Altieri, K., Baker, A. R., Capone, D., Duce, R. A., Dentener, F., Fennel, K., Kanakidou, M., LaRoche, J., Lee, K., Liss, P., Middelburg, J. J., Moore, J. K., Okin, G., Oschlies, A., Sarin, M., Seitzinger, S., Sharples, J., Singh, A., Suntharalingam, P., Uematsu, M., and Zamora, L. M.: A reevaluation of the magnitude and impacts of anthropogenic atmospheric nitrogen inputs on the ocean, Global Biogeochem. Cy., 31, 289–305, https://doi.org/10.1002/2016GB005586, 2017.
Kanakidou, M., Myriokefalitakis, S., Daskalakis, N., Fanourgakis, G., Nenes, A., Baker, A. R., Tsigaridis, K., and Mihalopoulos, N.: Past, Present, and Future Atmospheric Nitrogen Deposition, J. Atmos. Sci., 73, 2039–2047, https://doi.org/10.1175/jas-d-15-0278.1, 2016.
Kim, T. W., Lee, K., Najjar, R. G., Jeong, H. D., and Jeong, H. J.: Increasing N Abundance in the Northwestern Pacific Ocean Due to Atmospheric Nitrogen Deposition, Science, 334, 505–509, https://doi.org/10.1126/science.1206583, 2011.
Lamarque, J. F., Kiehl, J. T., Brasseur, G. P., Butler, T., Cameron-Smith, P., Collins, W. D., Collins, W. J., Granier, C., Hauglustaine, D., Hess, P. G., Holland, E. A., Horowitz, L., Lawrence, M. G., McKenna, D., Merilees, P., Prather, M. J., Rasch, P. J., Rotman, D., Shindell, D., and Thornton, P.: Assessing future nitrogen deposition and carbon cycle feedback using a multimodel approach: Analysis of nitrogen deposition, J. Geophys. Res.-Atmos., 110, D19303, https://doi.org/10.1029/2005jd005825, 2005.
Lamarque, J.-F., Dentener, F., McConnell, J., Ro, C.-U., Shaw, M., Vet, R., Bergmann, D., Cameron-Smith, P., Dalsoren, S., Doherty, R., Faluvegi, G., Ghan, S. J., Josse, B., Lee, Y. H., MacKenzie, I. A., Plummer, D., Shindell, D. T., Skeie, R. B., Stevenson, D. S., Strode, S., Zeng, G., Curran, M., Dahl-Jensen, D., Das, S., Fritzsche, D., and Nolan, M.: Multi-model mean nitrogen and sulfur deposition from the Atmospheric Chemistry and Climate Model Intercomparison Project (ACCMIP): evaluation of historical and projected future changes, Atmos. Chem. Phys., 13, 7997–8018, https://doi.org/10.5194/acp-13-7997-2013, 2013.
Li, M., Liu, H., Geng, G. N., Hong, C. P., Liu, F., Song, Y., Tong, D., Zheng, B., Cui, H. Y., Man, H. Y., Zhang, Q., and He, K. B.: Anthropogenic emission inventories in China: a review, Natl. Sci. Rev., 4, 834–866, https://doi.org/10.1093/nsr/nwx150, 2017.
Li, Q. B., Jacob, D. J., Bey, I., Palmer, P. I., Duncan, B. N., Field, B. D., Martin, R. V., Fiore, A. M., Yantosca, R. M., Parrish, D. D., Simmonds, P. G., and Oltmans, S. J.: Transatlantic transport of pollution and its effects on surface ozone in Europe and North America, J. Geophys. Res.-Atmos., 107, 4166, https://doi.org/10.1029/2001jd001422, 2002.
Li, Q. B., Jacob, D. J., Munger, J. W., Yantosca, R. M., and Parrish, D. D.: Export of NOy from the North American boundary layer: Reconciling aircraft observations and global model budgets, J. Geophys. Res.-Atmos., 109, D02313, https://doi.org/10.1029/2003JD004086, 2004.
Li, X. Y., Liu, J. F., Mauzerall, D. L., Emmons, L. K., Walters, S., Horowitz, L. W., and Tao, S.: Effects of trans-Eurasian transport of air pollutants on surface ozone concentrations over Western China, J. Geophys. Res.-Atmos., 119, 12338–12354, https://doi.org/10.1002/2014jd021936, 2014.
Liang, Q., Jaegle, L., Jaffe, D. A., Weiss-Penzias, P., Heckman, A., and Snow, J. A.: Long-range transport of Asian pollution to the northeast Pacific: Seasonal variations and transport pathways of carbon monoxide, J. Geophys. Res.-Atmos., 109, D23S07, https://doi.org/10.1029/2003JD004402, 2004.
Lin, M., Holloway, T., Carmichael, G. R., and Fiore, A. M.: Quantifying pollution inflow and outflow over East Asia in spring with regional and global models, Atmos. Chem. Phys., 10, 4221–4239, https://doi.org/10.5194/acp-10-4221-2010, 2010.
Liu, H. Y., Jacob, D. J., Bey, I., Yantosca, R. M., Duncan, B. N., and Sachse, G. W.: Transport pathways for Asian pollution outflow over the Pacific: Interannual and seasonal variations, J. Geophys. Res.-Atmos., 108, 8786, https://doi.org/10.1029/2002jd003102, 2003.
Liu, J. F., Mauzerall, D. L., and Horowitz, L. W.: Analysis of seasonal and interannual variability in transpacific transport, J. Geophys. Res.-Atmos., 110, D04302, https://doi.org/10.1029/2004jd005207, 2005.
Liu, F., Zhang, Q., Ronald, J. V., Zheng, B., Tong, D., Yan, L., Zheng, Y. X., and He, K. B.: Recent reduction in NOx emissions over China: synthesis of satellite observations and emission inventories, Environ. Res. Lett., 11, 114002, https://doi.org/10.1088/1748-9326/11/11/114002, 2016.
Lu, Z., Streets, D. G., Zhang, Q., Wang, S., Carmichael, G. R., Cheng, Y. F., Wei, C., Chin, M., Diehl, T., and Tan, Q.: Sulfur dioxide emissions in China and sulfur trends in East Asia since 2000, Atmos. Chem. Phys., 10, 6311–6331, https://doi.org/10.5194/acp-10-6311-2010, 2010.
Moxim, W. J., Levy, H., and Kasibhatla, P. S.: Simulated global tropospheric PAN: Its transport and impact on NOx, J. Geophys. Res.-Atmos., 101, 12621–12638, https://doi.org/10.1029/96jd00338, 1996.
Paerl, H. W.: Connecting atmospheric nitrogen deposition to coastal eutrophication, Environ. Sci. Technol., 36, 323–326, https://doi.org/10.1021/es022392a, 2002.
Parrish, D. D., Dunlea, E. J., Atlas, E. L., Schauffler, S., Donnelly, S., Stroud, V., Goldstein, A. H., Millet, D. B., McKay, M., Jaffe, D. A., Price, H. U., Hess, P. G., Flocke, F., and Roberts, J. M.: Changes in the photochemical environment of the temperate North Pacific troposphere in response to increased Asian emissions, J. Geophys. Res.-Atmos., 109, D23S18, https://doi.org/10.1029/2004jd004978, 2004.
Parrish, D. D., Millet, D. B., and Goldstein, A. H.: Increasing ozone in marine boundary layer inflow at the west coasts of North America and Europe, Atmos. Chem. Phys., 9, 1303–1323, https://doi.org/10.5194/acp-9-1303-2009, 2009.
Paulot, F., Jacob, D. J., and Henze, D. K.: Sources and Processes Contributing to Nitrogen Deposition: An Adjoint Model Analysis Applied to Biodiversity Hotspots Worldwide, Environ. Sci. Technol., 47, 3226–3233, https://doi.org/10.1021/es3027727, 2013.
Phoenix, G. K., Hicks, W. K., Cinderby, S., Kuylenstierna, J. C. I., Stock, W. D., Dentener, F. J., Giller, K. E., Austin, A. T., Lefroy, R. D. B., Gimeno, B. S., Ashmore, M. R., and Ineson, P.: Atmospheric nitrogen deposition in world biodiversity hotspots: the need for a greater global perspective in assessing N deposition impacts, Glob. Change Biol., 12, 470–476, https://doi.org/10.1111/j.1365-2486.2006.01104.x, 2006.
Reidmiller, D. R., Fiore, A. M., Jaffe, D. A., Bergmann, D., Cuvelier, C., Dentener, F. J., Duncan, B. N., Folberth, G., Gauss, M., Gong, S., Hess, P., Jonson, J. E., Keating, T., Lupu, A., Marmer, E., Park, R., Schultz, M. G., Shindell, D. T., Szopa, S., Vivanco, M. G., Wild, O., and Zuber, A.: The influence of foreign vs. North American emissions on surface ozone in the US, Atmos. Chem. Phys., 9, 5027–5042, https://doi.org/10.5194/acp-9-5027-2009, 2009.
Richter, A., Burrows, J. P., Nuss, H., Granier, C., and Niemeier, U.: Increase in tropospheric nitrogen dioxide over China observed from space, Nature, 437, 129–132, https://doi.org/10.1038/nature04092, 2005.
Sanderson, M. G., Dentener, F. J., Fiore, A. M., Cuvelier, C., Keating, T. J., Zuber, A., Atherton, C. S., Bergmann, D. J., Diehl, T., Doherty, R. M., Duncan, B. N., Hess, P., Horowitz, L. W., Jacob, D. J., Jonson, J. E., Kaminski, J. W., Lupu, A., MacKenzie, I. A., Mancini, E., Marmer, E., Park, R., Pitari, G., Prather, M. J., Pringle, K. J., Schroeder, S., Schultz, M. G., Shindell, D. T., Szopa, S., Wild, O., and Wind, P.: A multi-model study of the hemispheric transport and deposition of oxidised nitrogen, Geophys. Res. Lett., 35, L17815, https://doi.org/10.1029/2008gl035389, 2008.
Stohl, A.: Characteristics of atmospheric transport into the Arctic troposphere, J. Geophys. Res.-Atmos., 111, D11306, https://doi.org/10.1029/2005JD006888, 2006.
Stohl, A., Trainer, M., Ryerson, T. B., Holloway, J. S., and Parrish, D. D.: Export of NOy from the North American boundary layer during 1996 and 1997 North Atlantic Regional Experiments, J. Geophys. Res.-Atmos., 107, 4131, https://doi.org/10.1029/2001JD000519, 2002.
Sudo, K. and Akimoto, H.: Global source attribution of tropospheric ozone: Long-range transport from various source regions, J. Geophys. Res.-Atmos., 112, D12302, https://doi.org/10.1029/2006JD007992, 2007.
Tan, J., Fu, J. S., Dentener, F., Sun, J., Emmons, L., Tilmes, S., Sudo, K., Flemming, J., Jonson, J. E., Gravel, S., Bian, H., Davila, Y., Henze, D. K., Lund, M. T., Kucsera, T., Takemura, T., and Keating, T.: Multi-model study of HTAP II on sulfur and nitrogen deposition, Atmos. Chem. Phys., 18, 6847–6866, https://doi.org/10.5194/acp-18-6847-2018, 2018.
Tao, Z. N., Yu, H. B., and Chin, M.: Impact of transpacific aerosol on air quality over the United States: A perspective from aerosol-cloud-radiation interactions, Atmos. Environ., 125, 48–60, https://doi.org/10.1016/j.atmosenv.2015.10.083, 2016.
Task Force on Hemispheric Transport of Air Pollution (TF HTAP): available at: http://www.htap.org/, last access: 6 April 2018.
van der A, R. J., Peters, D. H. M. U., Eskes, H., Boersma, K. F., Van Roozendael, M., De Smedt, I., and Kelder, H. M.: Detection of the trend and seasonal variation in tropospheric NO2 over China, J. Geophys. Res., 111, D12317, https://doi.org/10.1029/2005jd006594, 2006.
van der A, R. J., Eskes, H. J., Boersma, K. F., van Noije, T. P. C., Van Roozendael, M., De Smedt, I., Peters, D. H. M. U., and Meijer, E. W.: Trends, seasonal variability and dominant NOx source derived from a ten year record of NO2 measured from space, J. Geophys. Res., 113, D04302, https://doi.org/10.1029/2007jd009021, 2008.
Verstraeten, W. W., Neu, J. L., Williams, J. E., Bowman, K. W., Worden, J. R., and Boersma, K. F.: Rapid increases in tropospheric ozone production and export from China, Nat. Geosci., 8, 690–695, https://doi.org/10.1038/ngeo2493, 2015.
Vet, R., Artz, R. S., Carou, S., Shaw, M., Ro, C. U., Aas, W., Baker, A., Bowersox, V. C., Dentener, F., Galy-Lacaux, C., Hou, A., Pienaar, J. J., Gillett, R., Forti, M. C., Gromov, S., Hara, H., Khodzher, T., Mahowald, N. M., Nickovic, S., Rao, P. S. P., and Reid, N. W.: A global assessment of precipitation chemistry and deposition of sulfur, nitrogen, sea salt, base cations, organic acids, acidity and pH, and phosphorus, Atmos. Environ., 93, 3–100, https://doi.org/10.1016/j.atmosenv.2013.10.060, 2014.
Wild, O. and Akimoto, H.: Intercontinental transport of ozone and its precursors in a three-dimensional global CTM, J. Geophys. Res.-Atmos., 106, 27729–27744, https://doi.org/10.1029/2000jd000123, 2001.
Wild, O., Pochanart, P., and Akimoto, H.: Trans-Eurasian transport of ozone and its precursors, J. Geophys. Res.-Atmos., 109, D11302, https://doi.org/10.1029/2003jd004501, 2004.
WMO: Global Atmopshere Watch Workshop on Measurement-Model Fusion for Global Total Atmospheric Deposition (MMF-GTAD), GAW Report No. 234, available at: https://www.wmo.int/pages/prog/arep/gaw/documents/FINAL_GAW_234_23_May.pdf (last access: 6 April 2018), 2017.
Xavier, A., Kottayil, A., Mohanakumar, K., and Xavier, P. K.: The role of monsoon low-level jet in modulating heavy rainfall events, Int. J. Climatol., 38, 569–576, https://doi.org/10.1002/joc.5390, 2018.
Yienger, J. J., Galanter, M., Holloway, T. A., Phadnis, M. J., Guttikunda, S. K., Carmichael, G. R., Moxim, W. J., and Levy, H.: The episodic nature of air pollution transport from Asia to North America, J. Geophys. Res.-Atmos., 105, 26931–26945, https://doi.org/10.1029/2000jd900309, 2000.
Yu, H., Chin, M., Remer, L. A., Bian, H., Tan, Q., Yuan, T., and Zhang, Y.: Aerosols from overseas rival domestic emissions over North America, Science, 337, 566–569, https://doi.org/10.1126/science.1217576, 2012.
Yu, H. B., Chin, M., West, J. J., Atherton, C. S., Bellouin, N., Bergmann, D., Bey, I., Bian, H. S., Diehl, T., Forberth, G., Hess, P., Schulz, M., Shindell, D., Takemura, T., and Tan, Q.: A multimodel assessment of the influence of regional anthropogenic emission reductions on aerosol direct radiative forcing and the role of intercontinental transport, J. Geophys. Res.-Atmos., 118, 700–720, https://doi.org/10.1029/2012jd018148, 2013.
Zhang, L., Jacob, D. J., Boersma, K. F., Jaffe, D. A., Olson, J. R., Bowman, K. W., Worden, J. R., Thompson, A. M., Avery, M. A., Cohen, R. C., Dibb, J. E., Flock, F. M., Fuelberg, H. E., Huey, L. G., McMillan, W. W., Singh, H. B., and Weinheimer, A. J.: Transpacific transport of ozone pollution and the effect of recent Asian emission increases on air quality in North America: an integrated analysis using satellite, aircraft, ozonesonde, and surface observations, Atmos. Chem. Phys., 8, 6117–6136, https://doi.org/10.5194/acp-8-6117-2008, 2008.
Zhang, L., Jacob, D. J., Kopacz, M., Henze, D. K., Singh, K., and Jaffe, D. A.: Intercontinental source attribution of ozone pollution at western US sites using an adjoint method, Geophys. Res. Lett., 36, L11810, https://doi.org/10.1029/2009gl037950, 2009.
Zhang, L., Jacob, D. J., Knipping, E. M., Kumar, N., Munger, J. W., Carouge, C. C., van Donkelaar, A., Wang, Y. X., and Chen, D.: Nitrogen deposition to the United States: distribution, sources, and processes, Atmos. Chem. Phys., 12, 4539–4554, https://doi.org/10.5194/acp-12-4539-2012, 2012.
Zhang, Q., Streets, D. G., He, K., Wang, Y., Richter, A., Burrows, J. P., Uno, I., Jang, C. J., Chen, D., Yao, Z., and Lei, Y.: NOx emission trends for China, 1995–2004: The view from the ground and the view from space, J. Geophys. Res.-Atmos., 112, D22306, https://doi.org/10.1029/2007jd008684, 2007.