the Creative Commons Attribution 4.0 License.
the Creative Commons Attribution 4.0 License.
 | 22 Aug 2018
Comprehensive analysis of particle growth rates from nucleation mode to cloud condensation nuclei in boreal forest
Pauli Paasonen
Maija Peltola
Jenni Kontkanen
Heikki Junninen
Veli-Matti Kerminen
Markku Kulmala
Growth of aerosol particles to sizes at which they can act as cloud condensation nuclei (CCN) is a crucial factor in estimating the current and future impacts of aerosol–cloud–climate interactions. Growth rates (GRs) are typically determined for particles with diameters (dP) smaller than 40 nm immediately after a regional new particle formation (NPF) event. These growth rates are often taken as representatives for the particle growth to CCN sizes (dP > 50–100 nm). In modelling frameworks, the concentration of the condensable vapours causing the growth is typically calculated with steady state assumptions, where the condensation sink (CS) is the only loss term for the vapours. Additionally, the growth to CCN sizes is represented with the condensation of extremely low-volatility vapours and gas–particle partitioning of semi-volatile vapours. Here, we use a novel automatic method to determine growth rates from below 10 nm to hundreds of nanometres from a 20-year-long particle size distribution (PSD) data set in boreal forest. With this method, we are able to detect growth rates also at times other than immediately after a NPF event. We show that the GR increases with an increasing oxidation rate of monoterpenes, which is closely coupled with the ambient temperature. Based on our analysis, the oxidation reactions of monoterpenes with ozone, hydroxyl radical and nitrate radical all are capable of producing vapours that contribute to the particle growth in the studied size ranges. We find that GR increases with particle diameter, resulting in up to 3-fold increases in GRs for particles with dP ∼ 100 nm in comparison to those with dP ∼ 10 nm. We use a single particle model to show that this increase in GR can be explained with aerosol-phase reactions, in which semi-volatile vapours form non-volatile dimers. Finally, our analysis reveals that the GR of particles with dP < 100 nm is not limited by the condensation sink, even though the GR of larger particles is. Our findings suggest that in the boreal continental environment, the formation of CCN from NPF or sub-100 nm emissions is more effective than previously thought and that the formation of CCN is not as strongly self-limiting a process as the previous estimates have suggested.


The role of aerosol particles in global climate is one of the largest uncertainties in our current knowledge of the climate system (Boucher et al., 2013). Aerosol particles that are large enough, having diameters (dP) larger than about 50–100 nm, can act as cloud condensation nuclei (CCN), which are cores of all the cloud droplets in our atmosphere (Kerminen et al., 2012). Since the lifetime and albedo of a cloud depend on the CCN concentration, they significantly adjust the fraction of solar radiation reflected back to space (Boucher et al., 2013). Cloud condensation nuclei are emitted to the atmosphere directly from both anthropogenic (Paasonen et al., 2016) and biogenic sources (Després et al., 2012), but a significant fraction of CCN are formed by condensation growth of smaller particles (Merikanto et al., 2009; Kerminen et al., 2012; Paasonen et al., 2013; Dunne et al., 2016; Gordon et al., 2017). These smaller particles may originate from atmospheric new particle formation (NPF), anthropogenic combustion or other emissions. The importance of the growth due to condensation of biogenic vapours has been shown both in model and observational studies (Merikanto et al., 2009; Makkonen et al., 2012; Paasonen et al., 2013; Scott et al., 2014), where the fraction of CCN originating from growth of smaller particles is estimated to be around 50 % of the total CCN concentration.
The condensable biogenic vapours typically originate from emissions of volatile organic compounds (VOCs) from plants (e.g. Kulmala et al., 1998; Riipinen et al., 2011). In the atmosphere, VOCs are oxidized mainly by ozone (O3), hydroxyl radical (OH) and nitrate radical (NO3), which decreases their volatility (e.g. Atkinson and Arey, 2003; Kroll and Seinfeld, 2008). One oxidation step cannot decrease the volatility enough to allow the vapour to condense, but the required number of oxygen molecules in an extremely low-volatility organic compound (ELVOC) is roughly the same as the number of carbon molecules (Ehn et al., 2014; Jokinen et al., 2015). However, an auto-oxidation process in which, after the initial oxidation, further oxidation steps occur with atmospheric oxygen molecules can produce very rapidly condensable vapours from VOCs (Ehn et al., 2014; Barsanti et al., 2017). In addition to extremely low-volatility organic compounds, low-volatility or semi-volatile organic compounds (SVOCs) can participate in aerosol growth by moving towards equilibrium in gas–particle partitioning. The impact of different volatility vapours is often analysed using the so-called volatility basis set (VBS, Donahue et al., 2011), in which the compounds with roughly similar volatilities are lumped together in order to facilitate, for example, modelling their impact on the growth rate (GR).
The growth rate of atmospheric particles can be determined after a period during which formation of particles with roughly similar size has occurred on a regional scale. Typically, the growth rates are determined after atmospheric NPF events, during which new particles are simultaneously formed from vapour molecules in a large area (Kulmala et al., 2012). After a NPF event, the growth of the formed particle mode can be typically followed up to 15 nm or sometimes up to 50 nm, but very rarely up to 100 nm. In order to observe the growth until 100 nm at the measurement station under typical conditions, simultaneous NPF should happen in a very large area (e.g. with wind speed 5 m s−1 and growth rate of 3 nm h−1 from the station to roughly 600 km upwind from the station), followed by continuous rather homogenous conditions without disturbing major aerosol sources. Since these kinds of circumstances are encountered only in specific clean environments and even then only under suitable conditions, the growth rates observed from NPF to 100 nm cannot be considered as representative for wide spatial and temporal scales.
The growth rate has been shown to increase with increasing particle diameter in nucleation mode (dp < 25 nm) (Manninen et al., 2010; Yli-Juuti et al., 2011; Kuang et al., 2012; Häkkinen et al., 2013; Dos Santos et al., 2015). This is assumed to be caused by the decreasing impact of the Kelvin effect, which makes condensation more difficult over surfaces with a strong curvature (Tröstl et al., 2016). Recently, a case study in the remote Arctic environment suggested that the particle growth rate is higher in the Aitken mode (25 nm < dP <100 nm) than in the nucleation mode, which follows from the growth caused by partitioning of semi-volatile vapours (Burkart et al., 2018). In these size ranges, the increase in particle growth rate with diameter is suggested to result from particle-phase reactions, e.g. dimerization of the semi-volatile vapours (Apsokardu and Johnston, 2018). However, it was also suggested that the increasing viscosity of particles with increasing size would slow down the growth rate (Zaveri et al., 2017).
Here, we first present an easy-to-use automatic method to determine the particle growth rates from particle number size distribution data by analysing growing particle modes that do not need to immediately follow the NPF event. The growth rates can be calculated for different particle size ranges: nucleation mode (dP < 25 nm), Aitken mode (25 nm < dP < 100 nm) and accumulation mode (dP >100 nm). The method is based on the manual growth rate analysis presented in Arneth et al. (2016). Secondly, we determine the growth rates at the SMEAR II station in Hyytiälä, Finland, in different seasons and times of day during 20 years. Finally, we determine the impacts of atmospheric conditions, estimated sources and sinks of condensable biogenic vapours and particle diameter on the growth rate. With the new method we have, for the first time, a comprehensive-enough data set for a detailed analysis of the growth in all the sizes from the nucleation mode to CCN sizes and beyond.
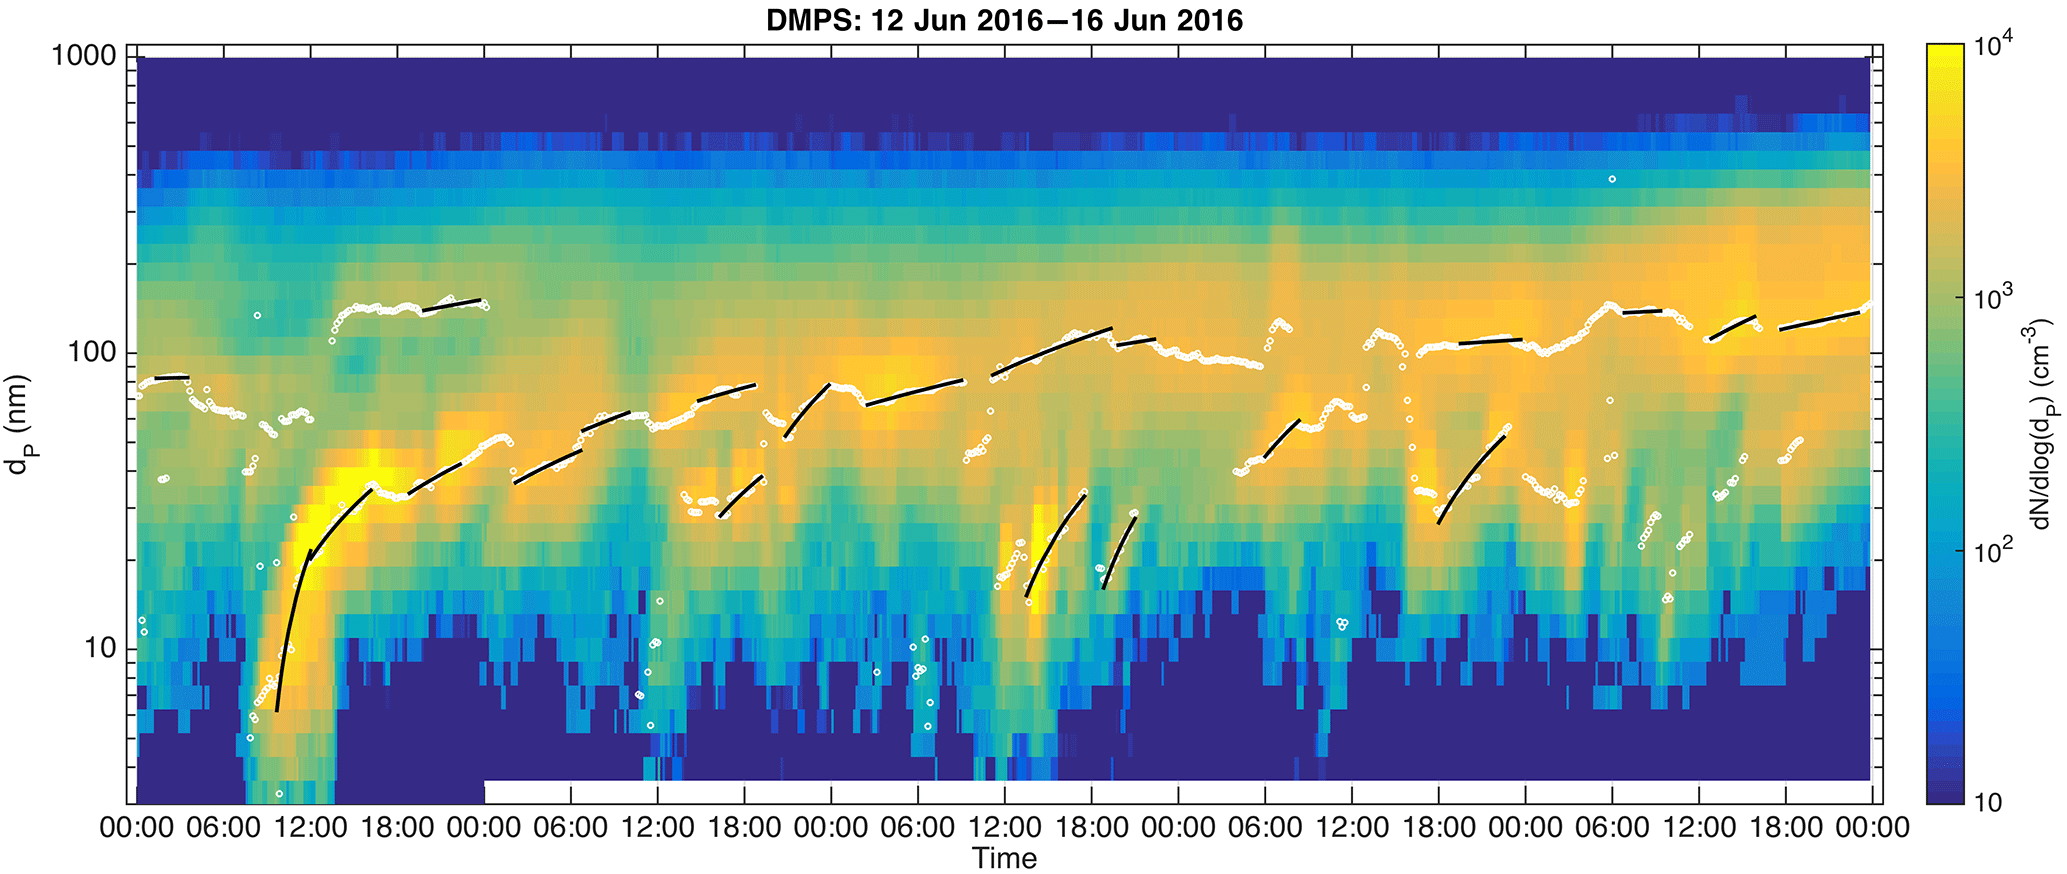
Figure 1An example of the evolution of particle size distribution and the determined growth periods over five consecutive days in June 2016. White circles show the found peaks in particle size distribution and the black lines show the determined monotonic growth periods.
2.1 DMPS data set and other applied variables
The automatic determination of growth rates, described in more detail in Sect. 2.2., was developed using the particle size distribution (PSD) data recorded at the SMEAR II station (Hari and Kulmala, 2005) with a differential mobility particle sizer (DMPS, Aalto et al., 2001) system, which has a time resolution of 10 min. The applied data set is 20 years long, from January 1996 to August 2016, and presents the PSD for particles in diameter range from 3 to 1000 nm. The measurement station is situated in a boreal forest area with the dominant tree species being Scots pine (Pinus sylvestris). The closest densely habituated area is the city of Tampere, roughly 80 km west from the station.
The determined growth rates were compared with meteorological variables and gaseous compounds, such as ozone, sulphur dioxide and nitrogen oxides, recorded at SMEAR II. The temperature was measured with PT-100 sensor at 16.8 m height and the ozone concentration with an ozone analyser (TEI 49C, Thermo Fisher Scientific, Waltham, MA, USA). These data (as well as the data for several other parameters, which were investigated in terms of their connection to growth rates but which we do not present in this paper) together with a more-detailed explanation of their measurements can be found in the AVAA database (http://avaa.tdata.fi/web/smart/, last access: September 2016). The condensation sink (CS), describing the loss rate of condensable vapours due to their condensation onto aerosol particles, was calculated from the PSD data using the methods described in Kulmala et al. (2001).
Next, the growth rates were compared with monoterpene concentrations ([MT]) and related parameters determined using proxies developed by Kontkanen et al. (2016). The applied proxy for monoterpene concentrations is given in Eq. (12) in Kontkanen et al. (2016). They showed that the correlation coefficient between this proxy and measured concentration was 0.74 and that for 80 % of the data points the proxy had a bias smaller than a factor of 5.8, which is rather small considering that the monoterpene concentration varies over almost 3 orders of magnitude. In addition to [MT], we inspected the correlation of GR with the proxy of monoterpene oxidation products
where kMT+X is the reaction rate coefficient for α-pinene and oxidant X, [OH] is calculated with a radiation-based proxy generated for Hyytiälä by Petäjä et al. (2009) and [NO3] is calculated based on Peräkylä et al. (2014) as described in Kontkanen et al. (2016), where also the other details and assumptions for the proxies are described.
Finally, we compared the GRs with the source rate of monoterpene oxidation products, i.e. the oxidation rate of monoterpenes (OxRate), which is the numerator on the right-hand side of Eq. (1). Because the different oxidation reactions are expected to have different yields of semi-volatile compounds (Jokinen et al., 2015), we tested whether introducing separate weighting factors, varied from 0.01 to 100, for OH and NO3 oxidation reactions in Eq. (1) would improve the correlation between the oxidation rate of monoterpenes and GR. The weighting factors were optimized by minimizing the inverse of the Pearson correlation coefficient (1/r) with the Matlab function fminsearch, and the initial conditions were varied in order to confirm that the results do not represent only local minima. It should be noted that, because the optimization concerned only the relative shares of different oxidation reactions and r is not sensitive to the absolute values of the data points, setting the weighting factor for ozonolysis reaction to 1 does not impact the results.
2.2 Automatic method for determining the growth rate
The DMPS data, described in Sect. 2.1, is first smoothed over five time steps with a median filter. Peak diameters (marked as white circles in Fig. 1) are determined from the smoothed data for each size distribution by fitting a parabola to logarithmic particle concentrations in size bins around local concentration maxima. The growth rates are determined by making linear least-squares fits to these peak diameters as a function of time if they fulfil the criteria described below. In the following description the PSDs are marked with PSDn so that for the first PSD for the day n=0 and for the next n=1 and so on.
The peaks of PSDn≥0 are divided into consecutive groups based on the time and diameter difference between them. If the first peak is determined in PSD0, the timewise closest peak in PSDn>0 is added to the same group, if it takes place within an hour from PSD0 (i.e. PSDn with 1 < n < 7) and is close enough in size (maximum allowed difference is 10 nm for peaks with dP < 50 nm and 50 nm for peaks with dP > 150 nm). If this peak is found, for example, in PSD2, the size distributions PSDn>2 are inspected in a similar manner. The procedure is repeated and the group of peaks is extended as long as more points are found. The peaks falling out of the size (or temporal) range are inspected later similarly in order to see if they form a group with other peaks.
When all the peaks within the PSD data file (typically for 1 day) have been assigned to a group (which in some cases can consist of only six points), the groups are inspected one by one in order to find periods with monotonic growth of the peak diameter within the groups. The monotonicity is determined with three conditions: (i) temporal and diameter differences between consecutive peaks; (ii) similarity of the growth rates, retrieved from linear least-squares fits to the peaks, along the growth period; and (iii) a combination of these two parameters. When these monotonicity conditions (described in more detail below) are violated for the third time, the growth period is ended. The peaks that cause the two first violations are excluded from the growth period before continuing to the next PSD.
The maximum allowed temporal and diameter differences between consecutive peaks (condition i above) are 0.5 h and 20 nm, respectively, which are stricter limitations than when the grouping of the peaks is done. The condition for monotonicity (ii) above the fitted growth rate is not fulfilled if both (a) the addition of a new peak changes the growth rate by a factor larger than 1.5 in comparison to the growth rate during the first hour of the growth period and (b) the slope of the fit to the peaks in the latest three PSDs differs by a factor larger than 2 from the growth rate during the first hour. The combined condition (iii) uses the original growth rate GRorig which is fitted for the first hour (or if the growth period is not yet 1 h long, the growth rate of the last four points) and the diameter of the new peak. The condition is fulfilled if the diameter of the new peak is between the diameters and GRorig/, where δt is the time step between the last and the new peak and b is a tolerance constant having the value of 10 % of the new peak diameter when dP > 20 and 2 nm when dP < 20 nm.
Finally, when the original growth periods of a minimum of 1 h have been determined using the monotonicity conditions described above, each growth period is inspected to find out whether it can be combined with a previous or following growth period. This is done because growth periods shorter than 2 h are not considered long enough for determining the growth rate. Two growth periods are combined if their growth rates do not differ by more than a factor of 1.5 and if the growth rate of the combined growth period (retrieved from the linear least-squares fit to the peaks included in both initial periods) does not differ by more than a factor of 1.5 from the former initial period. Additionally, the latter initial period needs to start within a timeframe of at most half of the sum of the initial growth period durations, but not more than 2 h, before and after the end of the former growth period.
In the analysis, the combined and non-combined growth periods are not separated. The minimum duration applied is 2 h, but in many parts of Sect. 3 the results are also presented separately for periods with duration over 5 h. It should be noted that our method simply searches for monotonic increases in particle-mode diameters, and hence it does not differentiate the condensational growth from growth due to coagulation or other possible phenomena that may cause apparent growth of a particle mode. Such phenomena, e.g. the faster coagulation scavenging of the smallest particles within a mode in comparison to the largest particles within the same mode, are typically considered more significant for particle growth in diameter ranges below 10 nm and in more polluted environments. Thus, we assume that the results in this article are not significantly impacted by them.
We made a comparison between GRs determined with our automatic method and manually determined GRs for nucleation-mode particles (Nieminen et al., 2014). For the comparison, we received start and end times of 153 growth periods during the years 2003–2013. It is notable that the manual growth rates were determined only for the time until the mode reaches 25 nm in diameter, because the initial purpose for their determination had been in calculating new particle formation rates, whereas the compared automatic GRs were for the growth periods that had initial diameters below 25 nm. In order to prevent the possibility of comparing different parts of a growth period, between which the particle growth rate might have changed drastically, we chose for comparison only the growth periods for which the automatic and manual growth periods overlapped for at least 2 h. Another note to be made on the manual GR data is that these 153 events represent only a small fraction of the manual GR values for the years 2003–2013, but for the rest of the manual GRs the start and end times were not readily available.
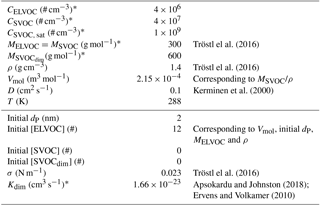
Table 1Values of the variables in the model runs for the base case run. Variables marked with asterisk (∗) are varied in the sensitivity analysis. The variables mainly related to the atmospheric conditions and vapours are shown in the upper part and those related to the growing particle in the lower part of the table.
2.3 Model
In order to investigate how the diameter of the particle, vapour concentration and particle-phase chemistry affect the growth rate, we applied a simple one-particle process model. The model included a particle, which consists of extremely low-volatility molecules (ELVOC), semi-volatile molecules (SVOC) and non-volatile dimers formed from SVOCs in the particle phase (SVOCdim). The parameters describing the model and vapours are shown in Table 1. The basic assumption of the model is that the compounds are fully mixed within the particle. The model consists of a set of differential equations for the number of ELVOC and SVOC molecules and SVOCdim inside the particle, adopted from the theoretical frameworks by Fuchs and Sutugin (1970), Kerminen et al. (2000), Vesterinen et al. (2007) and Trump and Donahue (2014):
and
Here [ELVOC], [SVOC] and [SVOCdim] describe the number of ELVOC, SVOC and SVOCdim molecules in the particle, respectively; D is vapour diffusion coefficient; dP is particle diameter; CELVOC and CSVOC are the gas-phase concentrations of ELVOC and SVOC, respectively; kdim is the reaction rate coefficient for the formation of SVOC dimers in the aerosol phase; and VP is the volume of the particle. In Eq. (2) it is assumed that CELVOC > >CELVOC, eq. In Eqs. (2–3), β describes the Fuchs–Sutugin correction factor for the transition regime
where Kn nm/dP is the Knudsen number. In Eq. (3), Ke is the Kelvin term
where σ describes the surface tension, Vm is the molar volume, R is the ideal gas constant (8.314 kg m2 s−2 mol−1 K−1) and T is the temperature. The equilibrium vapour concentration (Pankow, 1994) for gas-phase SVOC is calculated as
where CSVOC, sat is the saturation vapour concentration of SVOC, which is the inverse of the absorption partitioning coefficient in Kerminen et al. (2000).

Figure 2Diurnal variation of all the determined growth rates in different size ranges. Red horizontal line represents the median value and the blue box the 25th and 75th percentile values. The whiskers reach approximately ±2.7σ and the red markers are outliers from this range.
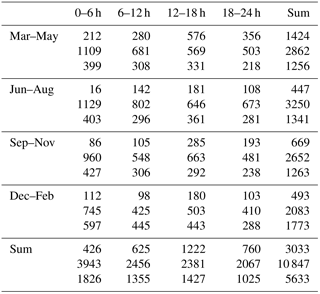
Table 2Number of determined growth periods segregated by time of year (rows), times of day (columns) and aerosol size modes (top: nucleation mode, middle: Aitken mode, bottom: accumulation mode). Note that the segregation to modes is made based on the starting size of the observed growth period.
The change in the diameter of the particle is calculated as
where is molecular volume for compound i, calculated with compound molar mass Mi, Avogadro's number NA(6.022×10²³ # mol−1) and density ρ.
The initial values for all the variables are given in Table 1.
3.1 Observed particle growth rates, seasonal and diurnal variations
The number of determined growth rates in different size ranges during different times of the year and day are presented in Table 2. The number is the largest for the Aitken mode in summer and the smallest for the nucleation mode in summer.
The observed growth rates did not show a clear diurnal cycle (Fig. 2). This is rather surprising, since the strong diurnal cycles of oxidant concentrations, in terms of OH and nitrate radicals, would be expected to affect the concentrations of condensable vapours and the growth rates. The possibility of the opposite diurnal cycles of these factors partly cancelling out their impact and further analysis on their effect is presented in Sect. 3.2.1.
In the nucleation and Aitken mode, the growth rates showed a seasonal cycle with a maximum in summer (Fig. 3). This is in agreement with previous analyses made for this site (Dal Maso et al., 2007; Yli-Juuti et al., 2011; Nieminen et al., 2014). In contrast to smaller sizes, in accumulation mode the median GRs had a minimum during summer.

Figure 3Monthly variation of all the determined growth rates in different size ranges. See caption for Fig. 2 for details of the markers.
The month-specific median growth rates were very similar in the nucleation and Aitken modes, varying between 1.8 and 4.1 nm h−1. The highest growth rates, both in terms of the maximum values and on average, were observed in the accumulation mode. In wintertime, the growth rates in the accumulation mode were a factor of 3 to 5 larger than in nucleation and Aitken modes, whereas in summer the median values were similar or slightly lower than at the smaller sizes.

Figure 4Observed particle growth rate as a function of the initial size of the growing mode, in panel (a) separated with the length of the observed growth period and in panel (b) with the time of the year.
The comparison of nucleation-mode GRs with manually determined GRs from Nieminen et al. (2014) showed a strong correlation (R=0.81) between automatic and manually determined GRs. Out of the 153 manually determined growth periods our method found 111, equaling to 73 %. In 93 % of the growth periods detected with both methods, the automatic GR was within a factor of 2, and in 76 % within a factor of 1.5 from the manually determined GR. We find this accuracy to be reasonably good, since our method was not developed for determining growth rates specifically for the nucleation mode, but rather for the Aitken and accumulation modes. In the manual determination, the selection of peaks in particle size distributions (white circles in Fig. 1) from which the GR is determined is made visually and the human eye can naturally connect more information for verifying the reliability of the determined GR than our automatic method. It should also be noted that, since the manual method relies on visual inspection of the data, exactly similar results would not be expected from different persons using the exactly similar manual method.
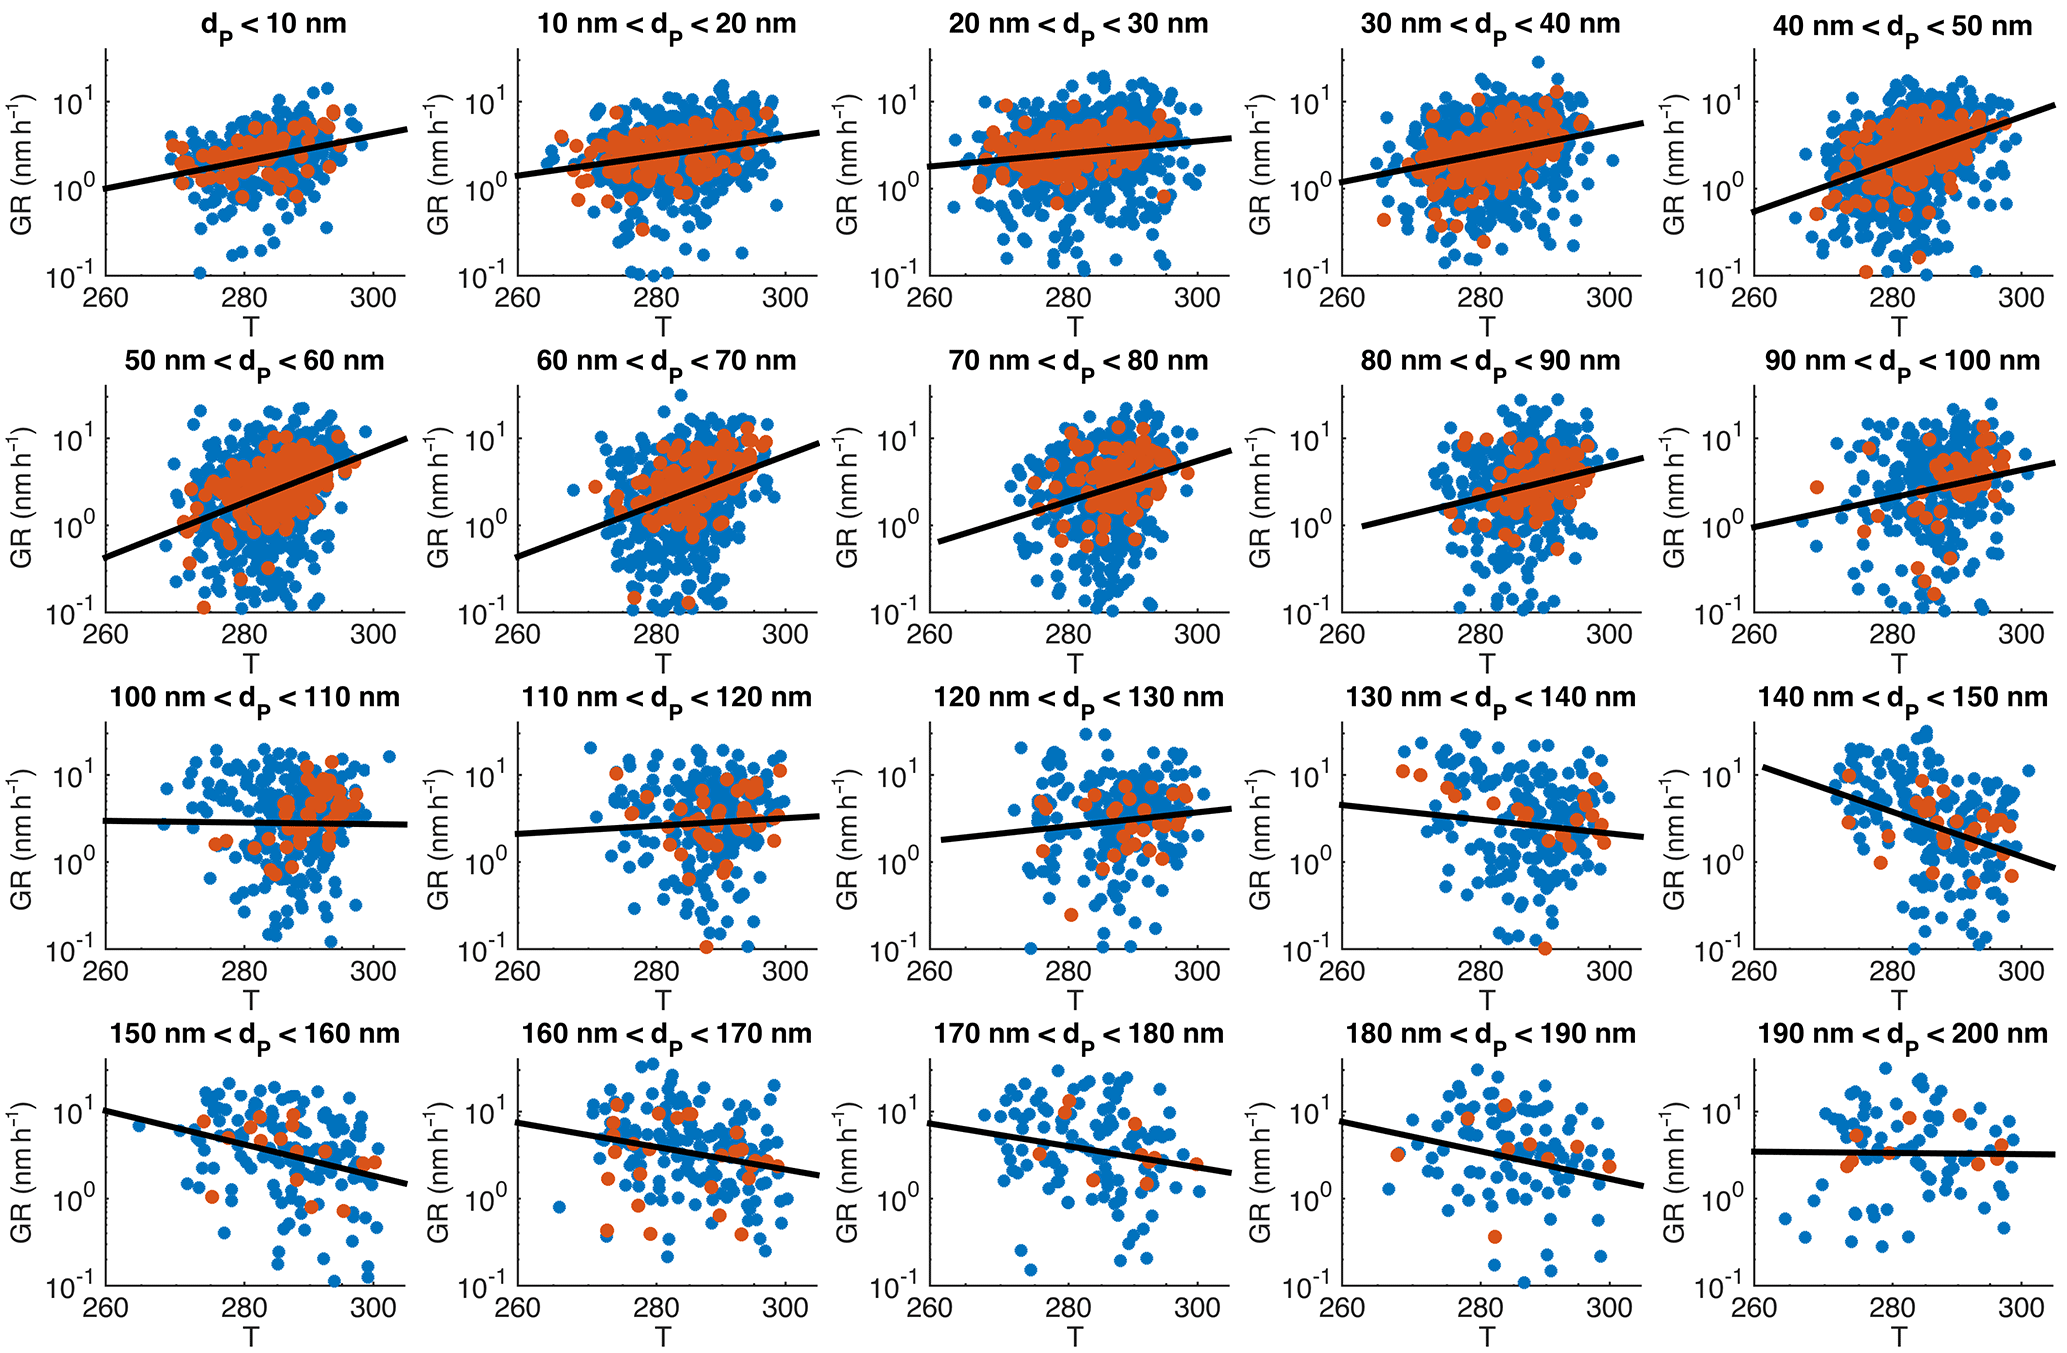
Figure 5Particle growth rate as a function of mean temperature during the growth period, binned with respect to the start size of the observed growth. The blue points depict all the determined growth periods, red ones the long (> 5 h) growth periods and the black lines are log-linear least-squares fittings for all the growth periods (blue points).
3.2 Impacts of atmospheric conditions on growth rates
The coupling of the observed growth rates and the particle size is shown in Fig. 4. Especially the highest observed growth rates increase when the mean diameter of the growing particle-mode increases, but a similar increase is observed also for the lowest growth rate values for diameters larger than 30 nm. These features are evident for all the determined growth rates and for the long growth periods with duration more than 5 h (Fig. 4a), as well as for both winter and summer (Fig. 4b). At diameters smaller than 30 nm, very few growth rates lower than 1 nm h−1 were observed. This is understandable, since with slow growth rates the coagulation scavenging decreases more effectively the concentrations of the nucleation-mode particles (e.g. Kerminen and Kulmala, 2002), resulting in concentration levels at which our method may not detect the growing mode anymore.
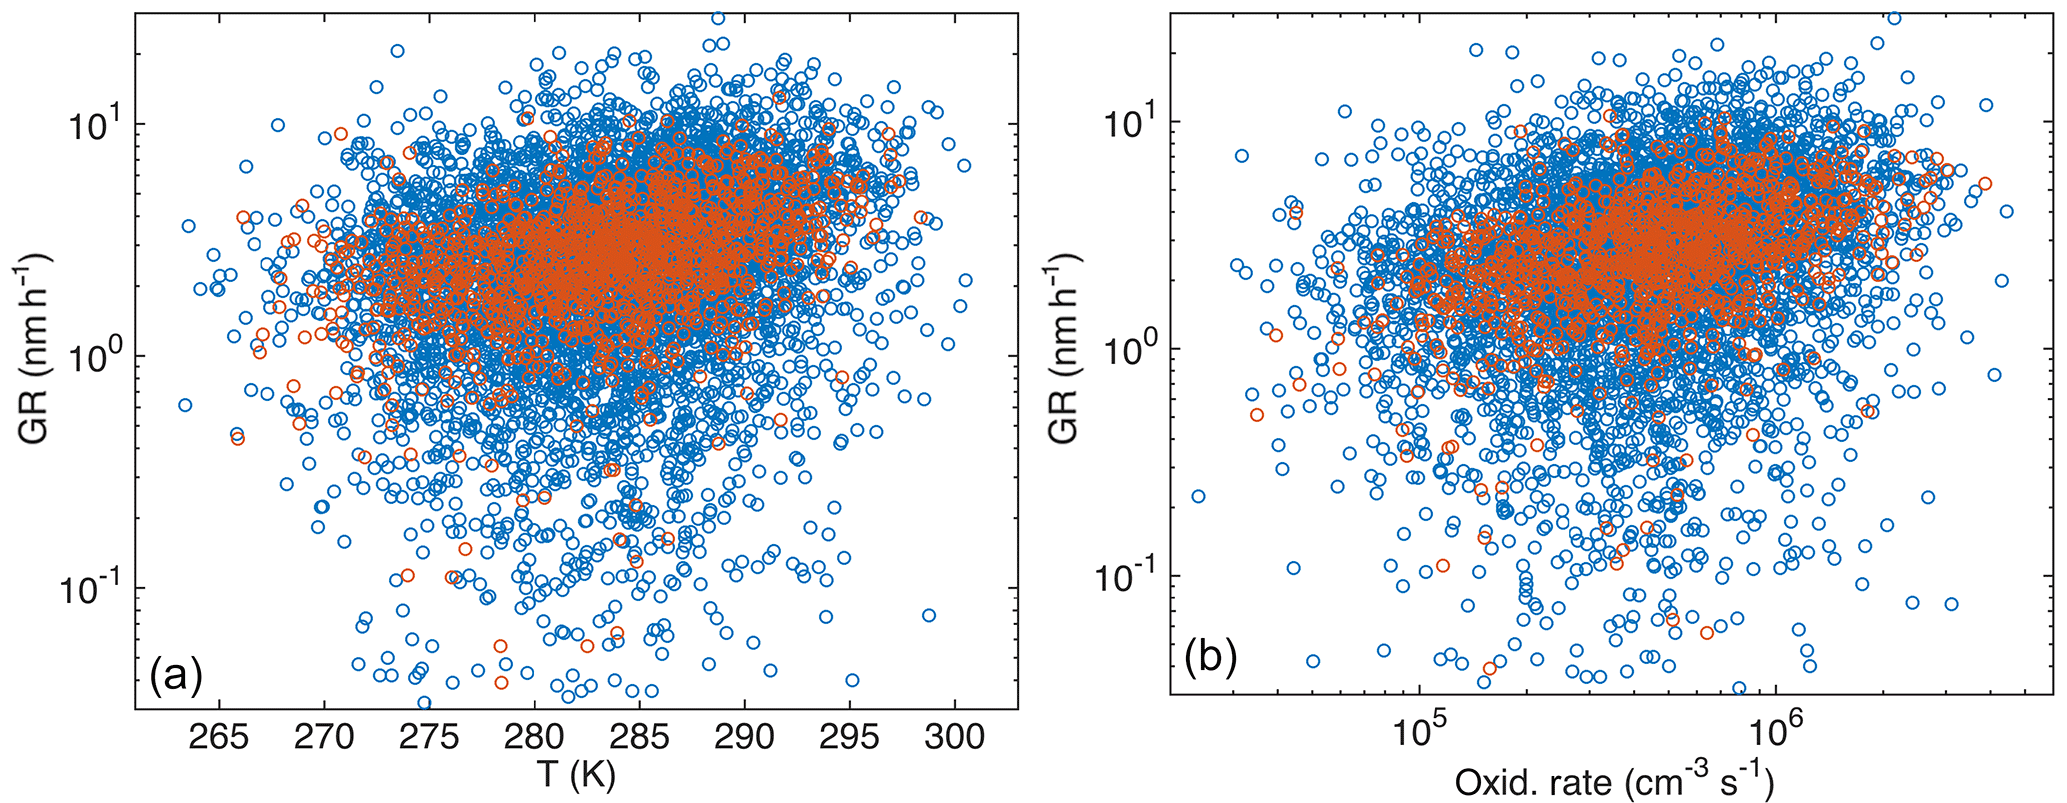
Figure 6Particle growth rate (April–September, growth starts at dP < 100 nm) as a function of temperature (a) and oxidation rate of monoterpenes (b). Blue circles are for growth period duration > 2 h and red for duration > 5 h.
Table 3Parameters of linear least-squares fits for growth rates starting from dP < 100 nm as a function of temperature (first row) and monoterpene oxidation rate (second row), and the related correlation coefficients and p values. Upper values are for growth periods with the duration > 2 h and the lower values in italics for the duration > 5 h.
We chose the initial diameter of the growing mode, instead of, for example, the mean diameter, for describing the impact of particle diameter on GR, because applying the mean diameter of the growing mode would cause an artificial bias to the results (if two growth periods with similar duration and different GRs started at same diameter, the one with higher GR would have a larger mean diameter than the one with lower GR; this would result in a positive correlation between GR and mean diameter, even though the diameters were the same in the beginning and thus the reason for different growth rates should not be the diameter). We will further inspect the impact of particle diameter on the growth rate later (Sect. 3.3). However, because in Fig. 4 the growth rate seems to be very different in different size ranges, in the following section we inspect the impacts of other parameters on growth rate in 10 nm size bins.

Figure 7Growth rates with duration > 2 h during April–September as a function of condensation sink in size bins.
3.2.1 Impact of condensable vapour source on the growth rate
The first source-related parameter that we inspected was temperature. It has been shown that during the vegetation growing season in Hyytiälä the condensational growth of particles is driven by biogenic vapours, such as monoterpenes (Paasonen et al., 2013), and their emissions depend strongly on temperature (Guenther et al., 1993). In Fig. 5 GR is depicted as a function of the mean temperature during the observed growth period in 10 nm size bins from below 10 to 200 nm in April–September. The growth rates clearly increased as a function of temperature in bins with diameters below 100 nm. In diameter bins of 100–130 nm the effect of temperature was not observed, but for bins with diameters > 130 nm a weak negative correlation between GR and temperature was found. It should be noted that the uncertainties in the determined values of growth rates increase with an increasing diameter, because the relative change in diameter is larger for smaller particles. Another factor contributing to higher uncertainties for larger GRs is that the width of the DMPS size channels is roughly directly proportional to the diameter. Thus, the growth rates at larger diameters are determined with coarser particle size distributions relative to the growth rates, which increase at most by a factor of 3 when the diameter increases by a factor of 10 (in Fig. 4, the higher end of GRs increases from ∼ 7 nm h−1 at 10 to 20 nm h−1 at 100 nm).
We used linear least-squares fits in a log-linear space to examine the temperature dependence. Interestingly, the fitted functions, shown in each panel of Fig. 5 with fitting parameters and correlation coefficients tabulated in Appendix A, were not very different for the diameter bins having the mean diameters lower than 100 nm. Instead of showing consistently higher growth rates for larger (or closer to 100 nm) particles at certain temperature, Fig. 5 shows that growth periods starting from larger sizes are observed on average with higher temperatures than those starting from smaller sizes. This could, in principle, suggest that the association between the particle diameter and growth rate depicted in Fig. 4 is not directly causal. The dependence of GR on diameter could also appear because the particles with the same age under different growing conditions would be observed at the measurement station at different sizes: at warmer air masses and concentrations of condensable vapours the particles would arrive at the station with larger sizes. We will examine this in more detail in Sect. 3.3.
Because of the relatively similar temperature dependences in size bins below 100 nm, all the growth rates in these bins together show a reasonably clear connection with the temperature (Fig. 6a). The Pearson correlation coefficients for log(GR) and temperature in April–September had R=0.20 for the periods with the duration > 2 h and 0.35 for the periods with the duration > 5 h (the respective p values, shown in Table 3, indicate that the correlations are statistically significant).
Next, we repeated the analysis by substituting the temperature with the monoterpene concentration proxy. Surprisingly, the correlation between GR and monoterpene concentrations was weaker (log–log correlation for April–September: R=0.18 when duration > 2 h and 0.33 when duration > 5 h) than for GR and temperature. When the proxy for the monoterpene oxidation product concentrations [MTOx] was applied, the correlations were even weaker (log–log correlations for the same period as above: R=0.15 and 0.26). However, a similar correlation test for GR with the oxidation rate of monoterpenes (OxRate) revealed a stronger correlation (log–log correlations for the same period as above: R=0.24 and 0.39) than for GR and temperature (Fig. 6b). The values of the linear least-squares fits for growth rates as functions of temperature and monoterpene oxidation rate for growth periods starting in dP < 100 nm are presented in Table 3. The linear least-squares fitting parameters for GR as functions of monoterpene concentrations and oxidation rates were similar to those for GR as a function of temperature presented above (see Appendix A).
Finally, we varied the weighting factors for OH and NO3 oxidation reactions from 0.01 to 100. The highest correlation coefficients between GRs with the duration > 2 h and OxRate were obtained with weighting factors 3.8 for OH oxidation and 1.2 for NO3 oxidation. Similar weighting factors for the duration > 5 h were 1.8 and 0.64, respectively. The resulting correlation coefficients were R=0.25 for the duration > 2 h and R=0.40 for the duration > 5 h. These are only 0.01 higher than the respective correlation coefficients for the oxidation rate without weighting factors, and thus the difference cannot be considered significant. What can be considered significant is that more diverse weighting factors could not be found. This indicates that all oxidants, including nitrate radicals, need to be taken into account in order to estimate correctly the formation of condensable vapours from monoterpenes. This result is in agreement with the observed lack of diurnal cycles in growth rates (Sect. 3.1). Since the major contributor to monoterpene oxidation rate during April–September is the ozonolysis reaction (see Figs. 9–10 in Kontkanen et al., 2016), which does not have a strong diurnal variation, the weighting factors with the observed magnitudes do not lead to an observable diurnal cycle in our long-term data.
3.2.2 Impact of condensation sink on the growth rates
A higher condensation sink is expected to decrease particle growth rates by consuming the condensable vapours faster. Thus, it is surprising that the observed particle growth rates correlated clearly better with the approximated oxidation rate of monoterpenes alone than with the same rate divided by CS, which would be the logical solution based on steady state approximation of the condensable vapour concentration. However, there is a strong coupling between the temperature, monoterpene emissions and concentration of accumulation-mode particles in many vegetated regions, including the forests around SMEAR II (Paasonen et al., 2013). This coupling stems from the enhanced growth of particles due to the higher temperatures and monoterpene emissions in the air mass history, which naturally leads to higher concentration of larger particles and thus higher CS (Liao et al., 2014). Due to this causality, the dependence between the observed growth rate and condensation sink, or rather its logarithm, is very similar to that between GR and temperature (Fig. 7): the negative relation between CS and GR is evident only in particle size ranges 110 nm < dP < 180 nm and in size ranges dP < 80 nm the correlation between GR and CS is positive.
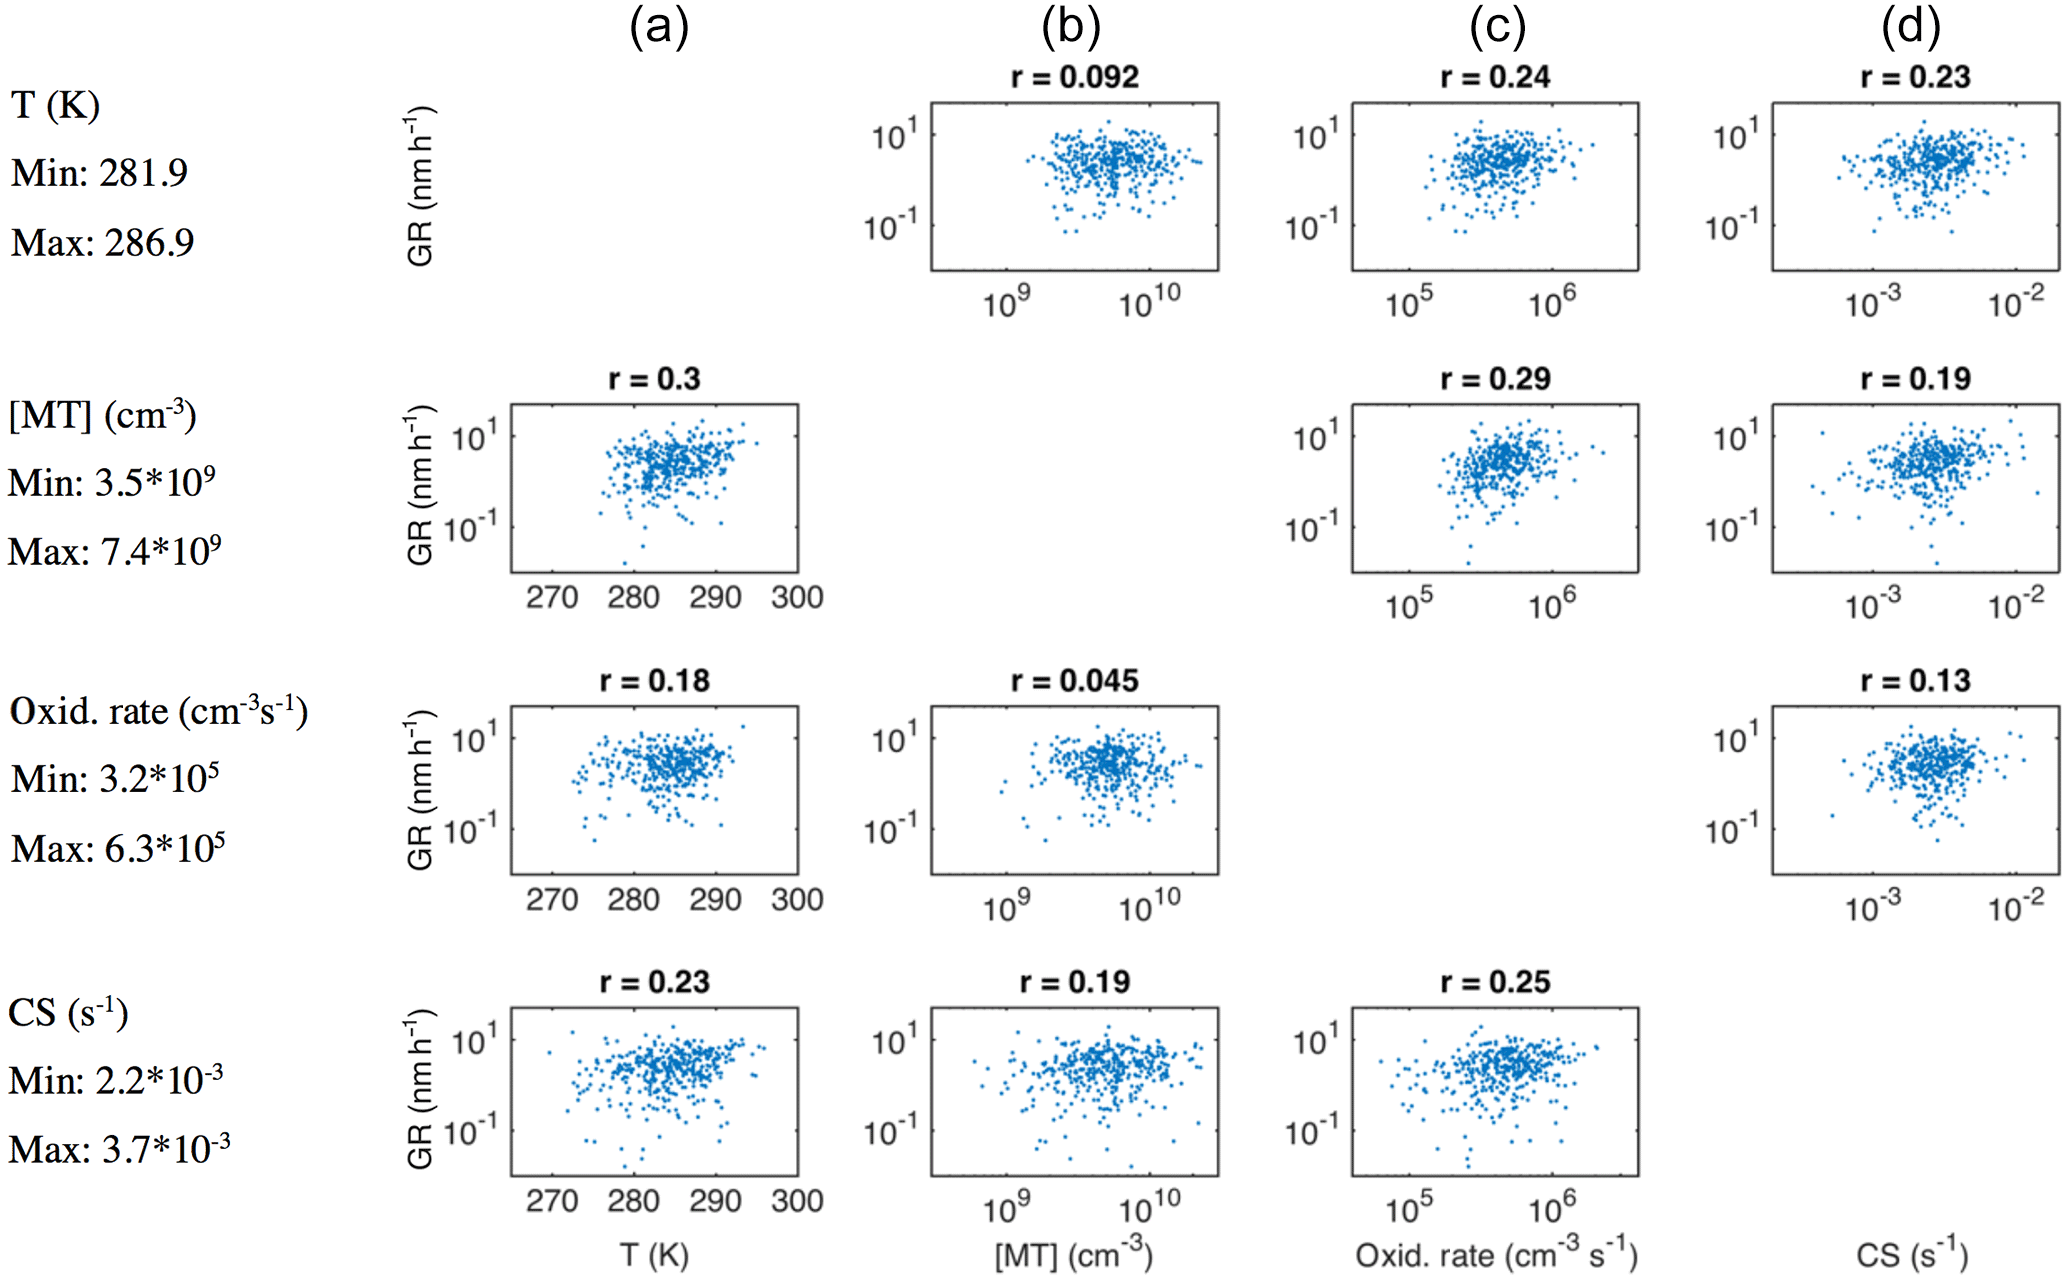
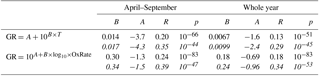
Figure 8Growth rate of growth periods with duration > 2 h and starting size 50 nm < dP < 60 nm during April–September depicted as a function of temperature (a), monoterpene concentration (b), monoterpene oxidation rate (c) and condensation sink (d), while one of these four variables is limited to vary between its 30th and 70th percentile (limited variable for each row and the percentile values indicated on the left-hand side).
The positive relation between GR and CS would indicate that the source of condensable vapours is closely connected to CS, which can result from the strong contribution of the (semi-)condensable vapours to the build-up of CS prior to the observation. Based on our data, this relation seems very strong. We were not able to find negative correlations between GR at dP < 100 nm and CS even for the subsets of data in which the diameter range and the range of monoterpene oxidation rate (representing our best estimate for the source of condensable vapours) were strictly constrained. A representative example can be found in Fig. 8, in the panel on the third row from the top and the fourth column from the left. This seems intuitively difficult to understand. It is even more difficult to explain that the influence of GR on the build-up of CS overrules the plausible decreasing impact of CS on GR in the Aitken mode, but not in the accumulation mode. Another possible explanation for our observation is that the condensation sink is not, for some reason, effective for the vapour(s) growing the nucleation- and Aitken-mode particles, indicating the importance of heterogeneous surface chemistry. Previously, Kulmala et al. (2017) discussed this kind of possibility when comparing the condensation sink and the required concentrations of vapours participating in new particle formation in a very different environment, Chinese megacities.

Figure 9Growth rate as a function of particle diameter for growth periods with duration > 2 in April–September, presented in temperature bins.
3.2.3 Comparison of significance of influencing atmospheric parameters
Since all the variables that were shown to correlate with the growth rate above are strongly interlinked, we tested which of them explains the variation of GR best in the case where the variation in the other parameters was limited. In Fig. 8 the relations of GR in the size range from 50 to 60 nm with temperature, monoterpene concentration, monoterpene oxidation rate and condensation sink are presented by limiting the variation of one of these variables at a time to lie between its 30th and 70th percentile. The highest correlation coefficients were found for GR as a function of monoterpene oxidation rate (third column from left) regardless of which of the other parameters was limited. Additionally, the lowest correlation coefficients in each column were encountered when the variation in the monoterpene oxidation range was limited (third row from the top). Similar features were observed for different subsets of GRs in terms of the growth period duration, size range and time of the year, although not always as clearly as in the presented case. This finding confirms that the oxidation rate of monoterpenes is the strongest of the inspected variables in determining particle growth rates.
It should be noted that we also made an extensive number of tests with other variables recorded at the SMEAR II station (meteorological variables, gaseous- and aerosol-phase concentrations, ratios between different variables, etc.) with similar methodologies as in Paasonen et al. (2010) and Kontkanen et al. (2016), but significant alternative or additional correlations were not found.
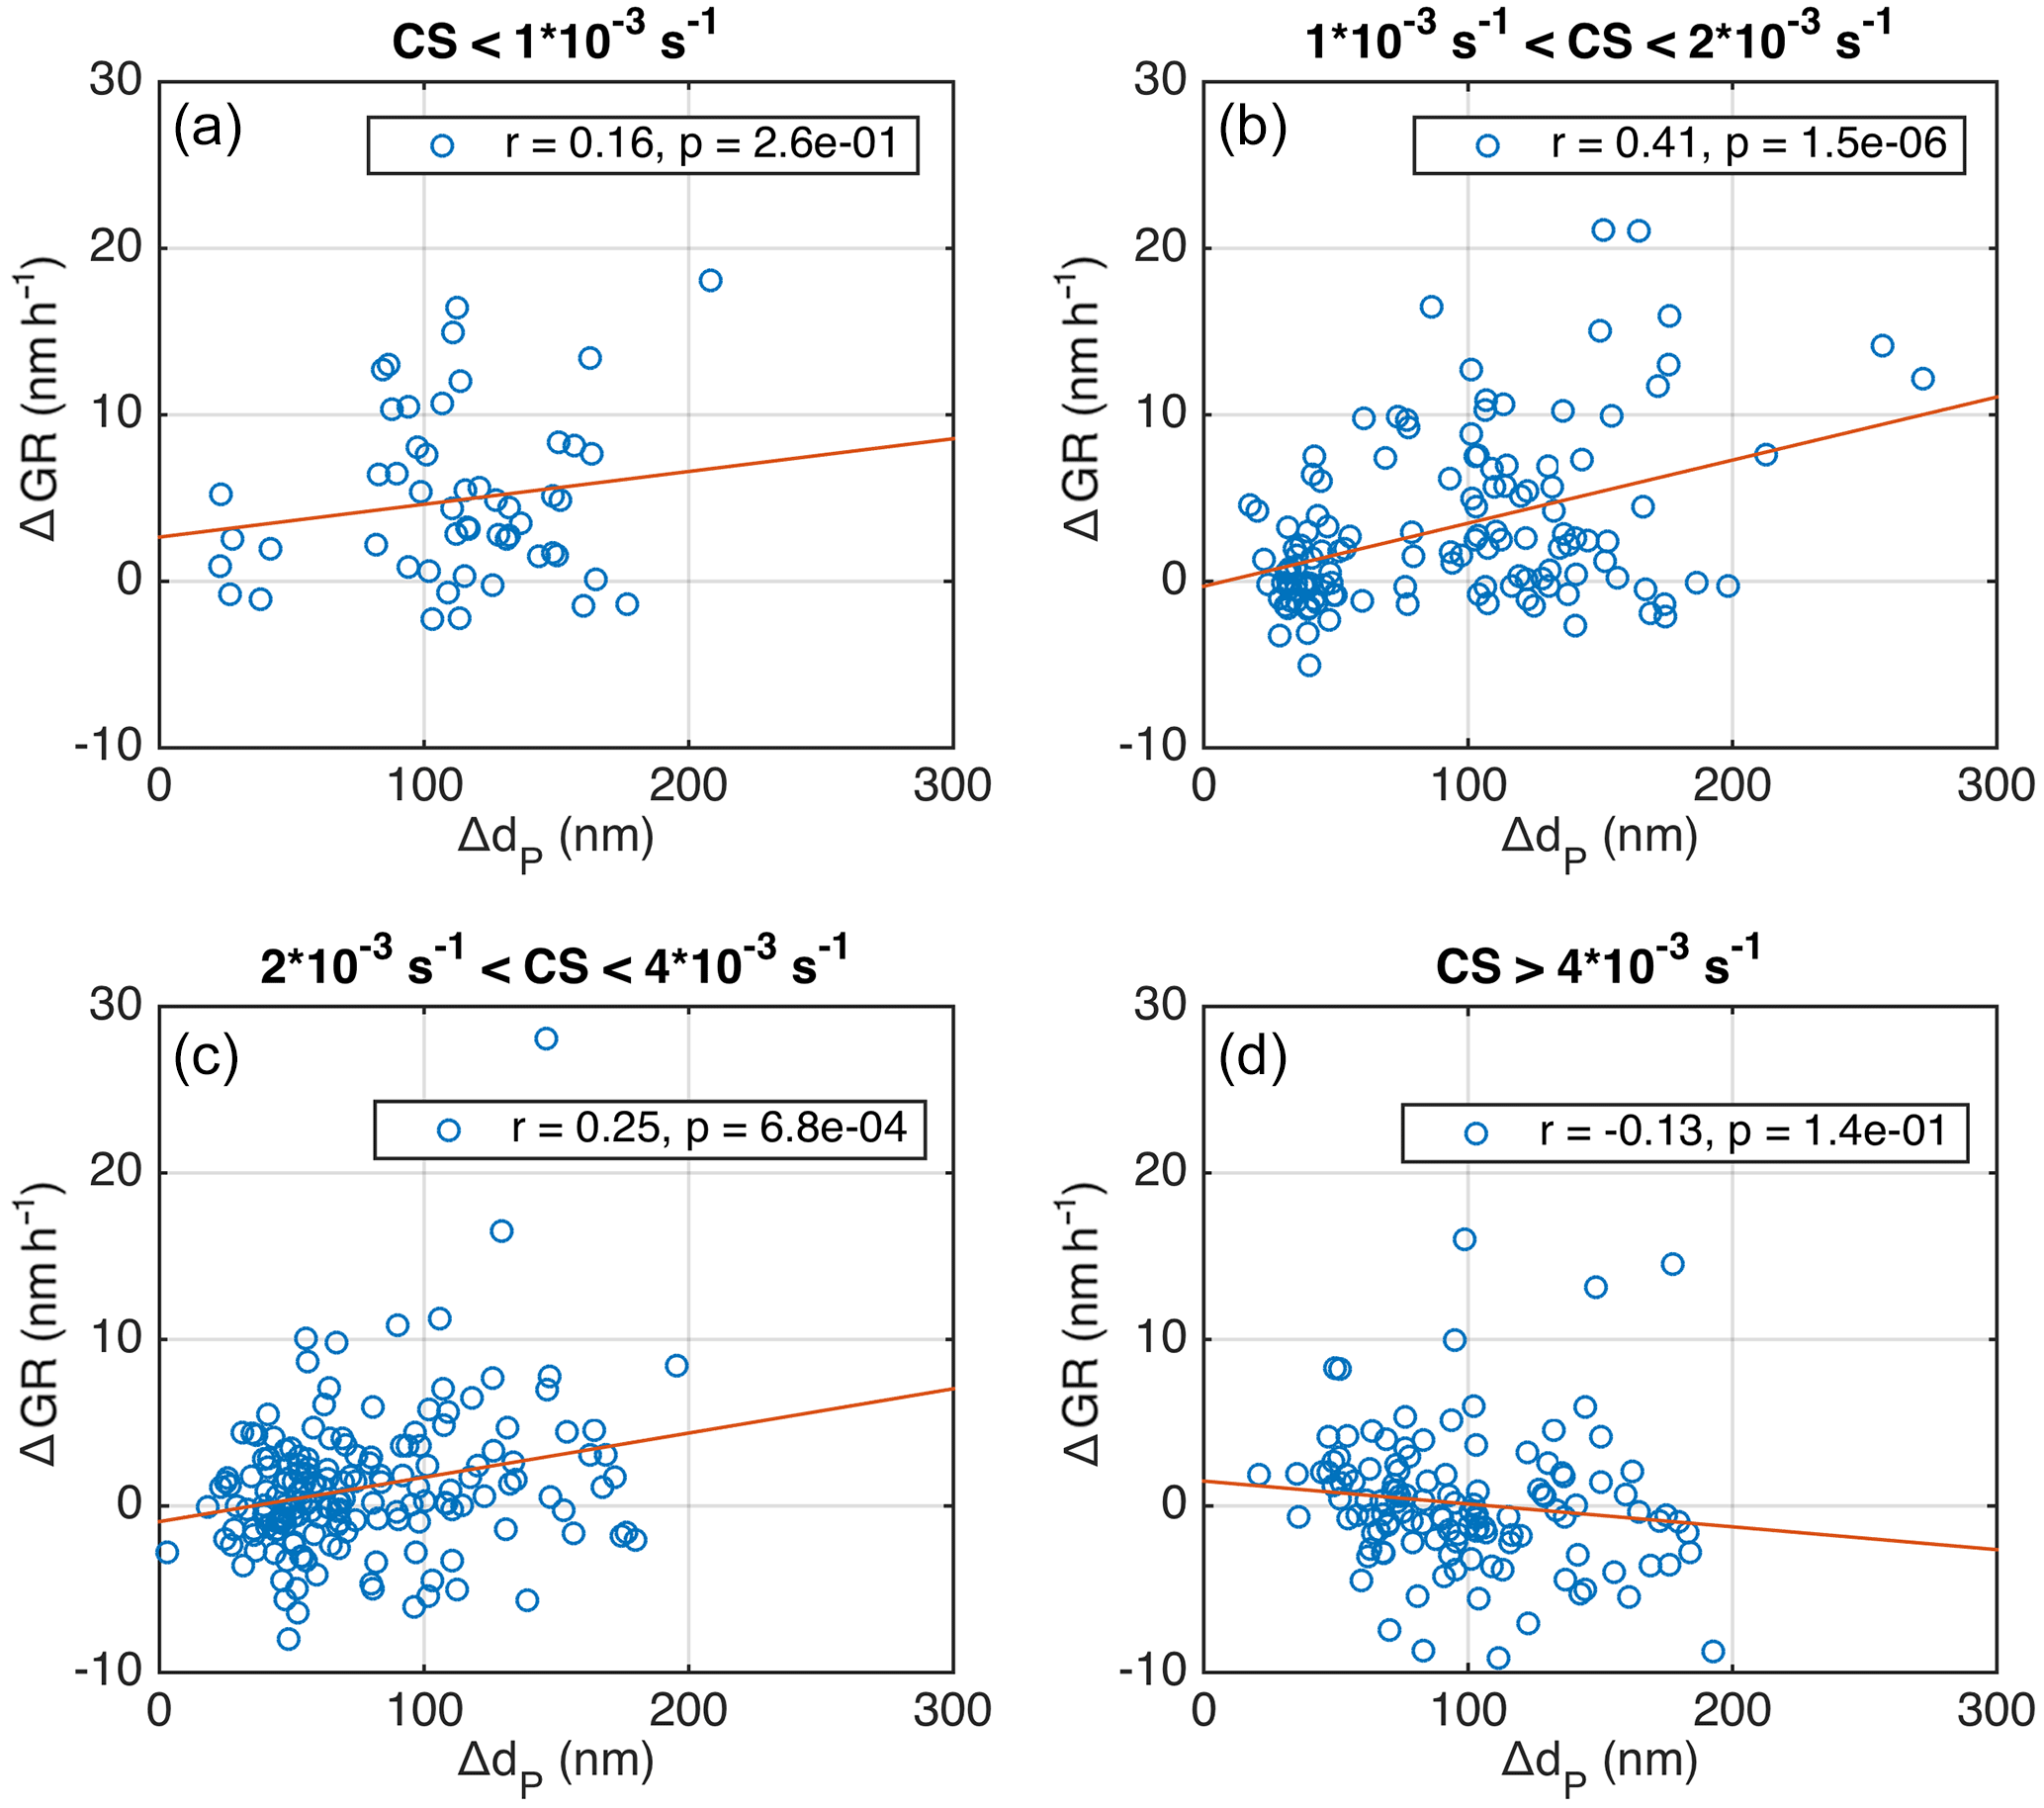
Figure 10Difference in growth rate as a function of difference in diameter for growth periods that overlap temporally for at least an hour. Data are presented in different condensation sink ranges for April–September.
3.3 Impact of particle diameter on growth rate
The similarity of the functions fitted to GR vs. temperature data in different size ranges below 100 nm (Fig. 5 and Appendix A) could be interpreted so that the apparent relation between the diameter and GR (Fig. 4a) is caused by a link between temperature and the size in which the growth rate is observed. In order to investigate this further, we depict in Fig. 9 the growth rates as functions of the starting size of the observed growth period in different temperature ranges. The high end of the GRs grows steadily with dP in all temperature ranges. The low end shows a similar increase when the GR starts at dP > 20 nm. As discussed in Sect. 3.2 in relation to Fig. 4a, the absence of data points at low GRs with dP < 20 nm does not mean that these growth rates do not exist, but that their observation may be impossible. This suggests that there is a direct connection between GR and particle size, which is inspected in more detail below.
We inspected the temporally overlapping growth periods, which are determined to take place simultaneously for at least 1 h. In Fig. 10 the difference in the growth rates (ΔGR = GR(dP2)–GR(dP2), where dP2 > dP1) is depicted against the difference in the mean diameter (ΔdP= dP2−dP1) at the starting moment of the overlap in growth periods. When CS was low or medium high for Hyytiälä (Fig. 10a–c), the growth rate was on average higher for larger particles, and the correlation between ΔGR and ΔdP was significant. This is in agreement with previous findings by Burkart et al. (2017), who analysed 5 days with simultaneous growth periods of different sized particles during Arctic marine observations.
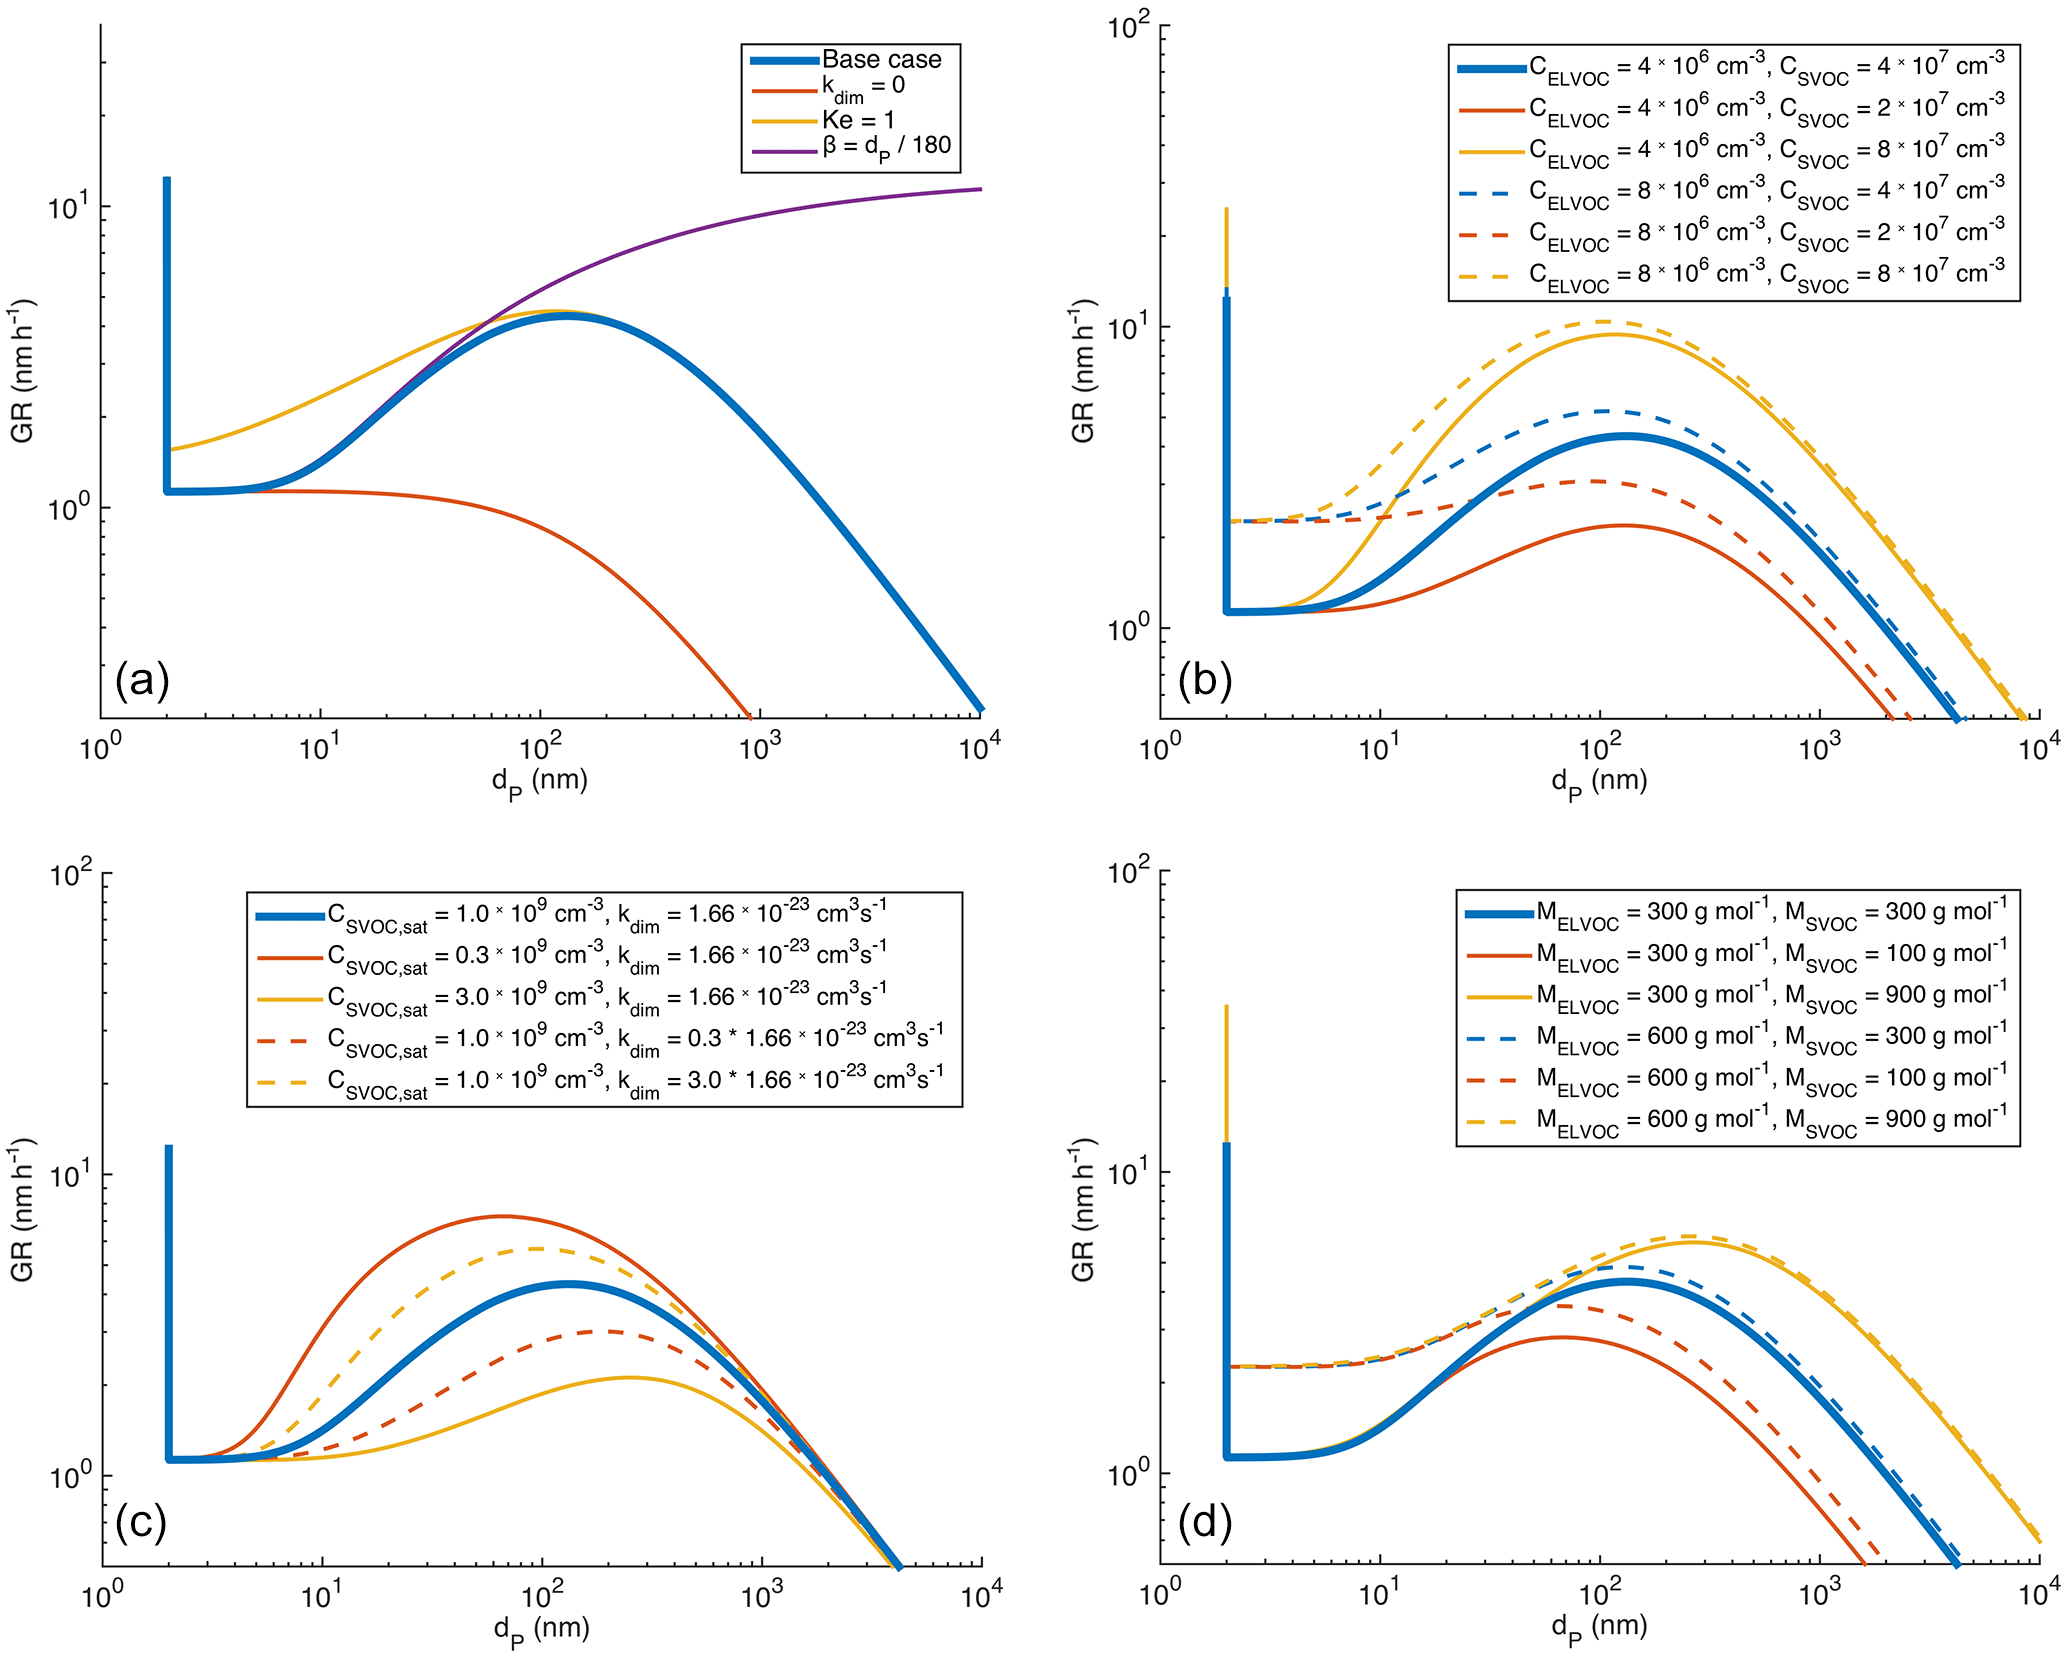
Figure 11Modelled growth rate of an aerosol particle with indication of factors causing the changes in GR as a function of diameter (panel a) and sensitivity analysis towards indicated factors (panels b–d). More details in text.
However, when CS was higher than s−1, the dependence seemed to disappear (Fig. 10d). This is another peculiarity related to the condensation sink, which needs to be assessed in more detail in future studies, in addition to the opposite relation between GR and CS for particles in the Aitken and accumulation modes discussed in the previous section. It should be noted that, when the simultaneous growth periods were investigated in the temperature bins, the division to bins showing positive correlation between ΔGR and ΔT was not as clear as in Fig. 10.
3.3.1 Modelled particle growth rate due to semi-volatile partitioning
The diameter growth rate under a constant concentration of vapour should remain relatively constant with particle size at diameters larger than a few tens of nanometres (at which sizes the Kelvin effect does not affect the growth significantly) if the condensation is limited only by the condensation and evaporation of the vapour without any changes in the volatility of the vapour. The increase in GR with particle diameter suggests that the maximum uptake of semi-volatile vapours is influenced by aerosol-phase reactions, e.g. dimer formation, during which the volatility decreases. This has been proposed earlier based on modelling, for example, by Apsokardu and Johnston (2018).
Our one-particle process model, described in Sect. 2.3 with atmospherically relevant input values for the base case (tabulated in Table 1), shows a clear increase in the diameter growth rate with an increasing particle diameter (blue solid line in Fig. 11) in roughly the same diameter range (10–300 nm) as the observations. This increase is caused by the aerosol-phase formation of non-volatile SVOCdim, since the increase does not occur when the formation of these dimers was turned off (i.e. kdim set to 0, red line in Fig. 11a). The diameter at which the increase in GR starts, being between 10 and 20 nm, is determined by the Kelvin effect, since by setting Ke = 1 in Eq. (3) the increase appears immediately after 2 nm (yellow line in Fig. 11a). When the diameter increases further, over 300 nm, GR starts to decrease. This is because, when the diameter increases and the particle approaches the continuum regime (Kn ≪ 1, i.e. dP ≫ 150 nm), the Fuchs–Sutugin correction factor β starts to decrease notably with an increasing diameter. This is demonstrated with the green line in Fig. 11a, for which β is set to increase linearly with the diameter, similarly to the free-molecular regime (Kn ≫ 1, i.e. dP ≪ 100 nm). In this case GR increases with an increasing diameter throughout the modelled sizes.
Figures 11b–d illustrate the sensitivity of the growth rate to gas-phase concentrations of ELVOC and SVOC (Fig. 11b), SVOC saturation vapour concentration and dimerization rate coefficient (Fig. 11c), and the molar masses of ELVOC and SVOC (Fig. 11d). This sensitivity analysis gives us some suggestions for the parameters determining the particle growth rate in Hyytiälä:
The diameter corresponding to maximum GR decreases with decreasing CSVOC, sat, with increasing kdim and with decreasing MSVOC. In our observations, we did not observe settling of the increase in GR when the diameter increased to over 200 nm. This suggests that the vapours mainly responsible for the particle growth in Aitken and accumulation mode would have either saturation vapour concentrations higher than 109 cm−3, kdim smaller than cm3 s−1 or molar masses higher than 300 g mol−1.
The growth rate at diameters below 10 nm is directly proportional to molar mass and concentration of ELVOC (assuming constant density). At larger diameters, the growth rate is directly proportional to SVOC concentration and inversely proportional to CSVOC, sat, but it is less sensitive to SVOC molar mass. By comparing the GR values in Figs. 11b and d to Fig. 3a, we estimate that the ELVOC concentration in Hyytiälä is typically below 1.6×107 cm−3, assuming MELVOC= 300 g mol−1. The highest SVOC concentrations seem to be around 2×108 cm−3, assuming 109 cm−3, and higher if the saturation vapour concentration is higher.
We generated an automatic method that seeks for growing particle modes from particle number size distribution data and determines the growth rate (GR) for these growth periods. This method finds growth periods from the nucleation mode (dP < 25 nm) to the accumulation mode (dP > 100 nm). We used the method to examine 20 years of particle size distribution data from a boreal forest observation site, SMEAR II, in Hyytiälä, Finland. All together 19 513 growth periods of at least 2 h of duration were determined, with the largest number of periods in the Aitken mode (10 847).
The growth rates in the nucleation mode showed a clear annual cycle, with the highest rates being recorded in July and the lowest in December and January. A similar but less pronounced cycle was observed in the Aitken mode, but in the accumulation mode the annual cycle was opposite, having a minimum in July and August. Clear diurnal cycles were not observed.
We investigated the particle growth rates from April to September in more detail, since during this period the biogenic emissions are expected to dominate the aerosol growth. We found that the behaviour of the growth rates for particles smaller and larger than 100 nm were very different: in the nucleation- and Aitken-mode GR increased with an increasing temperature, while in the accumulation mode this relation was opposite. We showed that the temperature dependence of GR was likely caused by the formation of condensable vapours as GR correlated with the oxidation rate of monoterpenes more strongly than with the temperature.
The growth rates were found to correlate in a similar way with the condensation sink (CS) as with the temperature and monoterpene oxidation rate, i.e. showing a positive correlation for GRs of particles with dP < 100 nm and negative correlations for the larger particles. On the one hand, the positive correlations for the nucleation- and Aitken-mode particles are understandable, since the enhanced growth of particles leads to higher concentrations of accumulation-mode particles, which causes an increase in CS. On the other hand, it would be assumable that a higher CS would also have an opposite impact on the particle growth rate, since it should decrease the concentration of condensable vapours. This kind of an impact was not observed for particles with dP < 100 nm even when inspecting the relation between CS and GR under roughly constant monoterpene oxidation rates, which is our best estimate for the condensable vapour source. In the accumulation mode, GR decreased with an increasing CS in a similar manner to that of the temperature and monoterpene oxidation rate. One possible interpretation of this is that the concentration of condensable vapours is not the limiting factor for the growth. Another possibility is that, for some reason, the vapours condensing on the nucleation- and Aitken-mode particles do not condense as efficiently onto larger particles. The latter interpretation is partly similar to the findings by Kulmala et al. (2017), who showed that in Chinese megacities the high condensation sink should prevent the observed new particle formation as nucleating vapours and small clusters should be effectively scavenged due to the very high values of CS.
Finally, we found that the maximum observed growth rate increased with an increasing particle diameter. While the highest observed growth rates at dP around 10 nm were roughly 10 nm h−1, the highest growth rates increased steadily to around 30 nm h−1 for particles with dP of 100 nm, and this pattern continued in the accumulation mode. A similar result was found when comparing the growth rates of temporally overlapping growth periods, except for the cases where CS was high compared to the average CS at SMEAR II. We also showed with a single particle process model that the increase in GR as a function of dP can be explained by the assumption that the growth is caused by the partitioning of semi-volatile vapours which, in the aerosol phase, form practically non-volatile dimers. This finding is in agreement with the modelling study by Apsokardu and Johnston (2018), as well as the observational study by Burkart et al. (2017) in the Arctic oceans. Our observations suggest that semi-volatile compounds could be responsible for the particle growth to CCN sizes in continental environments as well.
Our study suggests that the aerosol growth to cloud condensation nuclei sizes in the boreal forest is dominated by the condensational growth caused by semi-volatile oxidation products of biogenic volatile organic compounds. The observed increase in the particle growth rate as a function of particle size has a significant effect on the climate impacts of aerosol particles formed either during NPF events or emitted into the Aitken mode sizes from traffic or other sources. The increasing growth rate increases the fraction of the nucleation- and Aitken-mode particles surviving to CCN sizes and being able to form cloud droplets. This effect, or the processes leading to it, i.e. the semi-volatile vapours forming non-volatile dimers in the aerosol phase, needs to be included in climate model simulations when aerosol–cloud and aerosol–radiation interactions are estimated. Additionally, the observation that the condensation sink appears not to limit the growth of particles in the sub-CCN size range is in contrast with various estimates of the aerosol dynamics. Our findings suggest that the formation of CCN-sized particles is not as strongly self-limiting a process as previous studies have suggested.
The data recorded at SMEAR II site are available at http://avaa.tdata.fi/web/smart/ (AVAA, 2018). The data are licensed under a Creative Commons 4.0 Attribution (CC BY) license. The calculated growth rates are available upon request from the corresponding author.
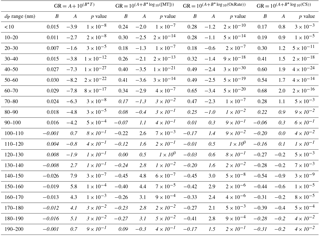
Table A1Fitting parameters resulting from linear least-squares fits for parameterizations of growth rates with growth period starting sizes in 10 nm bins and the related correlation coefficient p values, indicating the probability of getting a similar correlation as random chance. Fittings and correlations are for all determined growth rates (> 2 h) during April–September. Correlations which cannot be considered statistically significant (p > 0.01) are shown in italics.
PP had the original idea for the method, planned the analysis, designed the model and wrote most of the article. MP, HJ, PP and JK developed the automated method. MP, PP and JK conducted the data analysis. VMK and MK helped in planning the analysis and interpreting the data. All authors contributed to writing the manuscript.
The authors declare that they have no conflict of interest.
This study was funded by the Academy of Finland (project no. 307331),
European Commission (project ID: 742206), the Doctoral Programme in
Atmospheric Sciences (ATM-DP, University of Helsinki, Jenni Kontkanen), and
the European Regional Development Fund and the Mobilitas Pluss programme
(project MOBTT42). The authors would like to thank Tuomo Nieminen from
the University of Eastern Finland for providing the manually determined
growth rate data for comparison, as well as Santtu Mikkonen and Ville
Leinonen from the University of Eastern Finland for fruitful discussion.
Edited by: Kari Lehtinen
Reviewed by: two anonymous referees
Aalto, P., Hämeri, K., Becker, E., Weber, R., Salm, J., Mäkelä, J. M., Hoell, C., O'Dowd, C., Karlsson, H., Hansson, H.-C., Väkevä, M., Koponen, I., Buzorius, G., and Kulmala, M.: Physical characterisation of aerosol particles during nucleation events, Tellus, 53B, 344–358, 2001.
Apsokardu, M. J. and Johnston, M. V.: Nanoparticle growth by particle-phase chemistry, Atmos. Chem. Phys., 18, 1895–1907, https://doi.org/10.5194/acp-18-1895-2018, 2018.
Arneth, A., Makkonen, R., Olin, S., Paasonen, P., Holst, T., Kajos, M. K., Kulmala, M., Maximov, T., Miller, P. A., and Schurgers, G.: Future vegetation–climate interactions in Eastern Siberia: an assessment of the competing effects of CO2 and secondary organic aerosols, Atmos. Chem. Phys., 16, 5243–5262, https://doi.org/10.5194/acp-16-5243-2016, 2016.
Atkinson, R. and Arey, J.: Gas-phase tropospheric chemistry of biogenic volatile organic compounds: a review, Atmos. Environ., 37, Suppl. 2, S197–S219, 2003.
AVAA: Data recorded at SMEAR II site, available at: http://avaa.tdata.fi/web/smart/ (last access: September 2016), 2018.
Barsanti, K. C., Kroll, J. H., and Thornton, J. A.: Formation of low-volatility organic compounds in the atmosphere: Recent advancements and insights, J. Phys. Chem. Lett., 8, 1503–1511, 2017.
Boucher, O., Randall, D., Artaxo, P., Bretherton, C., Feingold, G., Forster, P., Kerminen, V.-M., Kondo, Y., Liao, H., Lohmann, U., Rasch, P., Satheesh, S., Sherwood, S., Stevens, B., and Zhan, X.: Clouds and Aerosols, in: Climate Change 2013: The Physical Science Basis. Contribution of Working Group I to the Fifth Assessment Report of the Intergovernmental Panel on Climate Change, edited by: Stocker, T., Qin, D., Plattner, G., Tignor, M., Allen, S., Boschung, J., Nauels, A., Xia, Y., Bex, V., and Midgley, P., Cambridge University Press, Cambridge, UK and New York, NY, USA, 2013.
Burkart, J., Hodshire, A. L., Mungall, E. L., Pierce, J. R., Collins, D. B., Ladino, L. A., and Abbatt, J.: Organic condensation and particle growth to CCN sizes in the summertime marine Arctic is driven by materials more semivolatile than at continental sites, Geophys. Res. Lett., 44, 10725–10734, https://doi.org/10.1002/2017GL075671, 2017.
Dal Maso, M., Sogacheva, L., Aalto, P. P., Riipinen, I., Komppula, M., Tunved, P., Korhonen, L., Suur-Uski, V., Hirsikko, A., Kurtén, T., Kerminen, V.-M., Lihavainen, H., Viisanen, Y., Hansson, H.-C., and Kulmala M.: Aerosol size distribution measurements at four Nordic field stations: identification, analysis and trajectory analysis of new particle formation bursts, Tellus, 59B, 350–361, 2007.
Després, V. R., Huffman, J. A., Burrows, S. M., Hoose, C., Safatov, A. S., Buryak, G., Fröhlich-Nowoisky, J., Elbert, W., Andreae, M. O., Pöschl, U., and Jaenicke, R.: Primary biological aerosol particle in the atmosphere: A review, Tellus B 64, 015598, https://doi.org/10.3402/tellusb.v64i0.15598, 2012.
Donahue, N. M., Epstein, S. A., Pandis, S. N., and Robinson, A. L.: A two-dimensional volatility basis set: 1. organic-aerosol mixing thermodynamics, Atmos. Chem. Phys., 11, 3303–3318, https://doi.org/10.5194/acp-11-3303-2011, 2011.
Dos Santos, V. N., Herrmann, E., Manninen, H. E., Hussein, T., Hakala, J., Nieminen, T., Aalto, P. P., Merkel, M., Wiedensohler, A., Kulmala, M., Petäjä, T., and Hämeri, K.: Variability of air ion concentrations in urban Paris, Atmos. Chem. Phys., 15, 13717–13737, https://doi.org/10.5194/acp-15-13717-2015, 2015.
Dunne, E. M., Gordon, H., Kürten, A., Almeida, J., Duplissy, J., Williamson, C., Ortega, I. K., Pringle, K. J., Adamov, A., Baltensperger, U., Barmet, P., Benduhn, F., Bianchi, F., Breitenlechner, M., Clarke, A., Curtius, J., Dommen, J., Donahue, N. M., Ehrhart, S., Flagan, R. C., Franchin, A., Guida, R., Hakala, J., Hansel, A., Heinritzi, M., Jokinen, T., Kangasluoma, J., Kirkby, J., Kulmala, M., Kupc, A., Lawler, M. J., Lehtipalo, K., Makhmutov, V., Mann, G., Mathot, S., Merikanto, J., Miettinen, P., Nenes, A., Onnela, A., Rap, A., Reddington, C. L. S., Riccobono, F., Richards, N. A. D., Rissanen, M. P., Rondo, L., Sarnela, N., Schobesberger, S., Sengupta, K., Simon, M., Sipilä, M., Smith, J. N., Stozkhov, Y., Tomé, A., Tröstl, J., Wagner, P. E., Wimmer, D., Winkler, P. M., Worsnop, D. R., and Carslaw, K. S.: Global atmospheric particle formation from CERN CLOUD measurements, Science, 354, 1119–1124, 2016.
Ehn, M., Thornton, J. A., Kleist, E., Sipilä, M., Junninen, H., Pullinen, I., Springer, M., Rubach, F., Tillmann, R., Lee, B., Lopez-Hilfiker, F., Andres, S., Acir, I.-H., Rissanen, M., Jokinen, T., Schobesberger, S., Kangasluoma, J., Kontkanen, J., Nieminen, T., Kurtén, T., Nielsen, L. B., Jørgensen, S., Kjaergaard, H. G., Canagaratna, M., Maso, M. D., Berndt, T., Petäjä, T., Wahner, A., Kerminen, V.-M., Kulmala, M., Worsnop, D. R., Wildt, J. and Mentel, T. F.: A large source of low-volatility secondary organic aerosol, Nature, 506, 476–479, https://doi.org/10.1038/nature13032, 2014.
Ervens, B. and Volkamer, R.: Glyoxal processing by aerosol multiphase chemistry: towards a kinetic modeling framework of secondary organic aerosol formation in aqueous particles, Atmos. Chem. Phys., 10, 8219–8244, https://doi.org/10.5194/acp-10-8219-2010, 2010.
Fuchs, N. A., and Sutugin, A. G.: Highly Dispersed Aerosols, Butterworth-Heinemann, Newton, MA, USA, 1970.
Gordon, H., Kirkby, J., Baltensperger, U., Bianchi, F., Breitenlechner, M., Curtius, J., Dias, A., Dommen, J., Donahue, N. M., Dunne, E. M., Duplissy, J., Ehrhart, S., Flagan, R. C., Frege, C., Fuchs, C., Hansel, A., Hoyle, C. R., Kulmala, M., Kürten, A., Lehtipalo, K., Makhmutov, V., Molteni, U., Rissanen, M. P., Stozhov, Y., Tröstl, J., Tsakogeorgas, G., Wagner, R., Williamson, C., Wimmer, D., Winkler, P. M., Yan, C., and Carslaw, K. S.: Causes and importance of new particle formation in the present-day and preindustrial atmospheres, J. Geophys. Res.-Atmos., 122, 8739–8760, 2017.
Guenther, A. B., Zimmerman, P. R., Harley, P. C., Monson, R. K., and Fall, R.: Isoprene and monoterpene emission rate variability: Model evaluations and sensitivity analyses, J. Geophys. Res.-Atmos., 98, 12609–12617, 1993.
Häkkinen, S. A. K., Manninen, H. E., Yli-Juuti, T., Merikanto, J., Kajos, M. K., Nieminen, T., D'Andrea, S. D., Asmi, A., Pierce, J. R., Kulmala, M., and Riipinen, I.: Semi-empirical parameterization of size-dependent atmospheric nanoparticle growth in continental environments, Atmos. Chem. Phys., 13, 7665–7682, https://doi.org/10.5194/acp-13-7665-2013, 2013.
Hari, P. and Kulmala, M.: Station for Measuring Ecosystem-Atmosphere Relations (SMEAR II), Boreal Environ. Res., 10, 315–322, 2005.
Jokinen, T., Berndt, T., Makkonen, R., Kerminen, V.-M., Junninen, H., Paasonen, P., Stratmann, F., Herrmann, H., Guenther, A. B., Worsnop, D. R., Kulmala, M., Ehn, M., and Sipilä, M.: Production of extremely low volatile organic compounds from biogenic emissions: Measured yields and atmospheric implications, P. Natl. Acad. Sci. USA, 112, 7123–7128, https://doi.org/10.1073/pnas.1423977112, 2015.
Kerminen, V.-M. and Kulmala, M.: Analytical formulae connecting the “real” and the “apparent” nucleation rate and the nuclei number concentration for atmospheric nucleation events, J. Aerosol Sci., 33, 609–622, 2002.
Kerminen, V.-M., Virkkula, A., Hillamo, R., Wexler, A. S., and Kulmala M.: Secondary organics and atmospheric cloud condensation nuclei production, J. Geophys. Res., 105, 9255–9264, 2000.
Kerminen, V.-M., Paramonov, M., Anttila, T., Riipinen, I., Fountoukis, C., Korhonen, H., Asmi, E., Laakso, L., Lihavainen, H., Swietlicki, E., Svenningsson, B., Asmi, A., Pandis, S. N., Kulmala, M., and Petäjä, T.: Cloud condensation nuclei production associated with atmospheric nucleation: a synthesis based on existing literature and new results, Atmos. Chem. Phys., 12, 12037–12059, https://doi.org/10.5194/acp-12-12037-2012, 2012.
Kontkanen, J., Paasonen, P., Aalto, J., Bäck, J., Rantala, P., Petäjä, T., and Kulmala, M.: Simple proxies for estimating the concentrations of monoterpenes and their oxidation products at a boreal forest site, Atmos. Chem. Phys., 16, 13291–13307, https://doi.org/10.5194/acp-16-13291-2016, 2016.
Kroll, J. H. and Seinfeld, J. H: Chemistry of secondary organic aerosol: Formation and evolution of low-volatility organics in the atmosphere, Atmos. Environ., 42, 3593–3624, 2008.
Kuang, C., Chen, M., Zhao, J., Smith, J., McMurry, P. H., and Wang, J.: Size and time-resolved growth rate measurements of 1 to 5 nm freshly formed atmospheric nuclei, Atmos. Chem. Phys., 12, 3573–3589, https://doi.org/10.5194/acp-12-3573-2012, 2012.
Kulmala, M., Toivonen, A., Mäkelä, J. M., and Laaksonen, A.: Analysis of the growth of nucleation mode particles observed in Boreal forest, Tellus B, 50, 449–462, 1998.
Kulmala, M., Maso, M. D., Mäkelä, J. M., Pirjola, L., Väkevä, M., Aalto, P., Miikkulainen, P., Hämeri, K., and O'Dowd, C. D.: On the formation, growth and composition of nucleation mode particles, Tellus B, 53, 479–490, 2001.
Kulmala, M., Petäjä, T., Nieminen, T., Sipilä, M., Manninen, H. E., Lehtipalo, K., Dal Maso, M., Aalto, P. P., Junninen, H., Paasonen, P., Riipinen, I., Lehtinen, K. E. J., Laaksonen, A., and Kerminen, V.-M.: Measurement of the nucleation of atmospheric aerosol particles, Nat. Protoc., 7, 1651–1667, https://doi.org/10.1038/nprot.2012.091, 2012.
Kulmala, M., Kerminen, V. M., Petäjä, T., Ding, A. J., and Wang, L.: Atmospheric Gas-to-Particle Conversion: why NPF events are observed in megacities, Faraday Discuss., 200, 271–288, https://doi.org/10.1039/C6FD00257A, 2017.
Liao, L., Kerminen, V.-M., Boy, M., Kulmala, M., and Dal Maso, M.: Temperature influence on the natural aerosol budget over boreal forests, Atmos. Chem. Phys., 14, 8295–8308, https://doi.org/10.5194/acp-14-8295-2014, 2014.
Makkonen, R., Asmi, A., Kerminen, V.-M., Boy, M., Arneth, A., Guenther, A., and Kulmala, M.: BVOC-aerosol-climate interactions in the global aerosol-climate model ECHAM5.5-HAM2, Atmos. Chem. Phys., 12, 10077–10096, https://doi.org/10.5194/acp-12-10077-2012, 2012.
Manninen, H. E., Nieminen, T., Asmi, E., Gagné, S., Häkkinen, S., Lehtipalo, K., Aalto, P., Vana, M., Mirme, A., Mirme, S., Hõrrak, U., Plass-Dülmer, C., Stange, G., Kiss, G., Hoffer, A., Töro, N., Moerman, M., Henzing, B., de Leeuw, G., Brinkenberg, M., Kouvarakis, G. N., Bougiatioti, A., Mihalopoulos, N., O'Dowd, C., Ceburnis, D., Arneth, A., Svenningsson, B., Swietlicki, E., Tarozzi, L., Decesari, S., Facchini, M. C., Birmili, W., Sonntag, A., Wiedensohler, A., Boulon, J., Sellegri, K., Laj, P., Gysel, M., Bukowiecki, N., Weingartner, E., Wehrle, G., Laaksonen, A., Hamed, A., Joutsensaari, J., Petäjä, T., Kerminen, V.-M., and Kulmala, M.: EUCAARI ion spectrometer measurements at 12 European sites – analysis of new particle formation events, Atmos. Chem. Phys., 10, 7907–7927, https://doi.org/10.5194/acp-10-7907-2010, 2010.
Merikanto, J., Spracklen, D. V., Mann, G. W., Pickering, S. J., and Carslaw, K. S.: Impact of nucleation on global CCN, Atmos. Chem. Phys., 9, 8601–8616, https://doi.org/10.5194/acp-9-8601-2009, 2009.
Nieminen, T., Asmi, A., Dal Maso, M., Aalto, P. P., Keronen, P., Petäjä, T., Kulmala, M., and Kerminen, V.-M.: Trends in atmospheric new-particle formation: 16 years of observations in a boreal-forest environment, Boreal Environ. Res., 19, Suppl. B, 191–214, 2014.
Paasonen, P., Nieminen, T., Asmi, E., Manninen, H. E., Petäjä, T., Plass-Dülmer, C., Flentje, H., Birmili, W., Wiedensohler, A., Hõrrak, U., Metzger, A., Hamed, A., Laaksonen, A., Facchini, M. C., Kerminen, V.-M., and Kulmala, M.: On the roles of sulphuric acid and low-volatility organic vapours in the initial steps of atmospheric new particle formation, Atmos. Chem. Phys., 10, 11223–11242, https://doi.org/10.5194/acp-10-11223-2010, 2010.
Paasonen, P., Asmi, A., Petäjä, T., Kajos, M. K., Äijälä, M., Junninen, H., Holst, T., Abbatt, J. P. D., Arneth, A., Birmili, W., van der Gon, H. D., Hamed, A., Hoffer, A., Laakso, L., Laaksonen, A., Leaitch, W. R., Plass-Dülmer, C., Pryor, S. C., Räisänen, P., Swietlicki, E., Wiedensohler, A., Worsnop, D. R., Kerminen, V.-M., and Kulmala, M.: Warming-induced increase in aerosol number concentration likely to moderate climate change, Nat. Geosci., 6, 438-442, 2013.
Paasonen, P., Kupiainen, K., Klimont, Z., Visschedijk, A., Denier van der Gon, H. A. C., and Amann, M.: Continental anthropogenic primary particle number emissions, Atmos. Chem. Phys., 16, 6823–6840, https://doi.org/10.5194/acp-16-6823-2016, 2016.
Pankow, J. F.: An absorption model of gas/particle partitioning of organic compounds in the atmosphere, Atmos. Environ., 28, 185–188, 1994.
Peräkylä, O., Vogt, M., Tikkanen, O.-P., Laurila, T., Kajos, M. K., Rantala, P. A., Patokoski, J., Aalto, J., Yli-Juuti, T., Ehn, M., Sipilä, M., Paasonen, P., Rissanen, M., Nieminen, T., Taipale, R., Keronen, P., Lappalainen, H. K., Ruuskanen, T. M., Rinne, J., Kerminen, V.-M., Kulmala, M., Bäck, J., and Petäjä, T.: Monoterpenes' oxidation capacity and rate over a boreal forest: temporal variation and connection to growth of newly formed particles, Boreal Environ. Res., 19, 293–310, 2014.
Petäjä, T., Mauldin, III, R. L., Kosciuch, E., McGrath, J., Nieminen, T., Paasonen, P., Boy, M., Adamov, A., Kotiaho, T., and Kulmala, M.: Sulfuric acid and OH concentrations in a boreal forest site, Atmos. Chem. Phys., 9, 7435–7448, https://doi.org/10.5194/acp-9-7435-2009, 2009.
Riipinen, I., Pierce, J. R., Yli-Juuti, T., Nieminen, T., Häkkinen, S., Ehn, M., Junninen, H., Lehtipalo, K., Petäjä, T., Slowik, J., Chang, R., Shantz, N. C., Abbatt, J., Leaitch, W. R., Kerminen, V.-M., Worsnop, D. R., Pandis, S. N., Donahue, N. M., and Kulmala, M.: Organic condensation: a vital link connecting aerosol formation to cloud condensation nuclei (CCN) concentrations, Atmos. Chem. Phys., 11, 3865–3878, https://doi.org/10.5194/acp-11-3865-2011, 2011.
Scott, C. E., Rap, A., Spracklen, D. V., Forster, P. M., Carslaw, K. S., Mann, G. W., Pringle, K. J., Kivekäs, N., Kulmala, M., Lihavainen, H., and Tunved, P.: The direct and indirect radiative effects of biogenic secondary organic aerosol, Atmos. Chem. Phys., 14, 447–470, https://doi.org/10.5194/acp-14-447-2014, 2014.
Tröstl, J., Chuang, W. K., Gordon, H., Heinritzi, M., Yan, C., Molteni, U., Ahlm, L., Frege, C., Bianchi, F., Wagner, R., Simon, M., Lehtipalo, K., Williamson, C., Craven, J. S., Duplissy, J., Adamov, A., Almeida, J., Bernhammer, A.-K., Breitenlechner, M., Brilke, S., Dias, A., Ehrhart, S., Flagan, R. C., Franchin, A., Fuchs, C., Guida, R., Gysel, M., Hansel, A., Hoyle, C. R., Jokinen, T., Junninen, H., Kangasluoma, J., Keskinen, H., Kim, J., Krapf, M., Kürten, A., Laaksonen, A., Lawler, M., Leiminger, M., Mathot, S., Möhler, O., Nieminen, T., Onnela, A., Petäjä, T., Piel, F. M., Miettinen, P., Rissanen, M. P., Rondo, L., Sarnela, N., Schobesberger, S., Sengupta, K., Sipilä, M., Smith, J. N., Steiner, G., Tomè, A., Virtanen, A., Wagner, A. C., Weingartner, E., Wimmer, D., Winkler, P. M., Ye, P., Carslaw, K. S., Curtius, J., Dommen, J., Kirkby, J., Kulmala, M., Riipinen, I., Worsnop, D. R., Donahue, N. M., and Baltensperger, U.: The role of low-volatility organic compounds in initial particle growth in the atmosphere, Nature, 533, 527–531, https://doi.org/10.1038/nature18271, 2016.
Trump, E. R. and Donahue, N. M.: Oligomer formation within secondary organic aerosols: equilibrium and dynamic considerations, Atmos. Chem. Phys., 14, 3691–3701, https://doi.org/10.5194/acp-14-3691-2014, 2014.
Vesterinen, M., Lehtinen, K. E. J., Kulmala, M., and Laaksonen, A.: Effect of particle phase oligomer formation on aerosol growth, Atmos. Environ., 41, 8, 1768–1776, https://doi.org/10.1016/j.atmosenv.2006.10.024, 2007.
Yli-Juuti, T., Nieminen, T., Hirsikko, A., Aalto, P. P., Asmi, E., Hõrrak, U., Manninen, H. E., Patokoski, J., Dal Maso, M., Petäjä, T., Rinne, J., Kulmala, M., and Riipinen, I.: Growth rates of nucleation mode particles in Hyytiälä during 2003–2009: variation with particle size, season, data analysis method and ambient conditions, Atmos. Chem. Phys., 11, 12865–12886, https://doi.org/10.5194/acp-11-12865-2011, 2011.
Zaveri, R. A., Shilling, J. E., Zelenyuk, A., Liu, J., Bell, D. M., D'Ambro, E. L., Gaston, C. J., Thornton, J. A., Laskin, A., Lin, P., Wilson, J., Easter, R. C., Wang, J., Bertram, A. K., Martin, S. T., Seinfeld, J. H., and Worsnop, D. R.: Growth Kinetics and Size Distribution Dynamics of Viscous Secondary Organic Aerosol, Environ. Sci. Technol., 52, 1191–1199, https://doi.org/10.1021/acs.est.7b04623, 2017.