the Creative Commons Attribution 4.0 License.
the Creative Commons Attribution 4.0 License.
 | 22 Aug 2018
Direct measurements of NO3 reactivity in and above the boundary layer of a mountaintop site: identification of reactive trace gases and comparison with OH reactivity
Jonathan M. Liebmann
Jennifer B. A. Muller
Dagmar Kubistin
Anja Claude
Robert Holla
Christian Plass-Dülmer
Jos Lelieveld
We present direct measurements of the summertime total reactivity of NO3 towards organic trace gases, , at a rural mountain site (988 m a.s.l.) in southern Germany in 2017. The diel cycle of was strongly influenced by local meteorology with high reactivity observed during the day (values of up to 0.3 s−1) and values close to the detection limit (0.005 s−1) at night when the measurement site was in the residual layer and free troposphere. Daytime values of were sufficiently large that the loss of NO3 due to reaction with organic trace gases competed with its photolysis and reaction with NO. Within experimental uncertainty, monoterpenes and isoprene accounted for all of the measured NO3 reactivity. Averaged over the daylight hours, more than 25 % of NO3 was removed via reaction with biogenic volatile organic compounds (BVOCs), implying a significant daytime loss of NOx and the formation of organic nitrates due to NO3 chemistry. Ambient NO3 concentrations were measured on one night and were comparable to those derived from a stationary-state calculation using measured values of . We present and compare the first simultaneous, direct reactivity measurements for the NO3 and OH radicals. The decoupling of the measurement site from ground-level emissions resulted in lower reactivity at night for both radicals, though the correlation between OH and NO3 reactivity was weak as would be anticipated given their divergent trends in rate constants with many organic trace gases.
- Article
(614 KB) -
Supplement
(1116 KB) - BibTeX
- EndNote


Hydroxyl (OH) and nitrate radicals (NO3) play a centrally important role in cleansing the atmosphere of trace gas emissions resulting from both anthropogenic and biogenic activity (Lelieveld et al., 2004, 2016; Ng et al., 2017). Whereas OH is largely photochemically generated and present at its highest concentrations during the day, NO3 is generated through the oxidation of NO2 by O3 and, due to its rapid photolysis and reaction with NO, is present mainly at night. A further important difference in the roles of OH and NO3 in the atmosphere is related to the mechanism of their reactions. NO3 reacts rapidly via electrophilic addition to unsaturated organic trace gases but reacts comparatively slowly (via H abstraction) with saturated organics. In the presence of O2, the initial addition step results in the formation of nitrooxyalkyl peroxy radicals, which can react with HO2, NO, NO2, or NO3 to form multifunctional peroxides and organic nitrates (Fry et al., 2014; Ng et al., 2017).
OH can react both by addition and H abstraction to organic and inorganic trace gases and may be considered to be more reactive and much less selective than the NO3 radical. The distinct reaction modes lead to significant differences in the lifetimes of both radicals, which for OH are typically less than 1 s and for NO3 can exceed 1 h (Wayne et al., 1991; Atkinson, 2000; Atkinson and Arey, 2003b; Brown and Stutz, 2012; Liebmann et al., 2018). Maximum daytime concentrations of OH are typically less than 1 pptv, whereas NO3 has been observed at the tens to hundreds of pptv level during night-time (Noxon et al., 1978; Sobanski et al., 2016; Ng et al., 2017).
The large NO3 mixing ratios at night-time and the large rate constants for the reaction of NO3 with several unsaturated biogenic VOCs result in NO3 being the dominant sink of many BVOCs (Wayne et al., 1991; Atkinson, 2000; Atkinson and Arey, 2003a, b; Brown and Stutz, 2012; Liebmann et al., 2017, 2018), especially those whose emission is mainly temperature dependent and continues at night-time, e.g. monoterpenes (Hakola et al., 2012). The importance of NO3 on a global scale is highlighted by the fact that forest ecosystems (covering around 9 % of the world's surface) annually release ≈1000 Tg of biogenic volatile organic compounds (BVOCs; e.g. isoprene, 2-methyl-1,3-butadiene; monoterpenes, C10H16; and sesquiterpenes, C15H24) into the Earth's atmosphere (Guenther et al., 2012; Bastin et al., 2017). BVOCs have a strong impact on the atmospheric radical budget, the NOx cycle (Hakola et al., 2003; Holzke et al., 2006; Nölscher et al., 2013), and on the formation and growth of organic particles (Jaoui et al., 2013; Lee et al., 2016; Ng et al., 2017); hence, understanding their lifetime and fate is essential for predicting atmospheric processes and climate change (Lelieveld et al., 2008, 2016). In addition, NO3 is an intermediate in the stepwise oxidation of NO to N2O5 (Reactions R1–R2, R4) and its lifetime with respect to reaction with biogenic trace gases (Reaction R6) impacts NOx levels and thus photochemical O3 formation from NO2 photolysis.
The organic nitrates formed in the multistep Reaction (R6) can transfer to the particle phase or be lost through deposition; N2O5 formed in Reaction (R4) can react with aqueous particles to form particulate nitrate and/or ClNO2 (Reaction R7) (Osthoff et al., 2008; Phillips et al., 2012, 2016; Bannan et al., 2015), thus reducing the rate of photochemical O3 production (Dentener and Crutzen, 1993). The absolute and relative fluxes through Reactions (R6) and (R7) thus control to some extent the lifetime of NOx.
Direct NO3 reactivity measurements have recently become possible (Liebmann et al., 2017) and the first deployment in a forested region revealed a large NO3 reactivity at canopy height, not all of which could be accounted for by simultaneous measurements of a large suite of organic trace gases (Liebmann et al., 2018). The authors concluded that unmeasured monoterpenes as well as sesquiterpenes were likely to be responsible. The difference between the observed (or derived) reactivity and that calculated from summing loss rates for a set of reactive trace gases is generally termed “missing reactivity” as frequently reported for OH (Nölscher et al., 2012). In this paper we prefer the term “unassigned reactivity”.
Previous work on NO3 reactivity has also revealed a strong meteorological influence on the NO3 lifetime, especially when air masses are decoupled from the surface layer into which reactive trace gases (NO and BVOC) are emitted at night (Brown et al., 2007b, 2011; Sobanski et al., 2016; Liebmann et al., 2018).
In this paper we describe direct measurements of NO3 reactivity in ambient air on a rural mountain site in southern Germany and interpret the data based on measured VOCs and in terms of the underlying meteorological situation. We also compare NO3 reactivity to simultaneous measurements of OH reactivity over the same period.
During the period 20 July to 6 August 2017 NO3 reactivity measurements were conducted in parallel with ongoing observations at the Meteorological Observatory Hohenpeissenberg (MOHp) in Bavaria, southern Germany. The observatory is a meteorological monitoring and Global Atmosphere Watch site operated by the German Meteorological Service (DWD). It is located on the Hohenpeissen mountain (988 m a.s.l.), 300–400 m above the surrounding countryside about 40 km from the northern rim of the Alps and has been the location of several intensive field campaigns (Plass-Dülmer et al., 2002; Birmili et al., 2003; Handisides et al., 2003; Mannschreck et al., 2004; Bartenbach et al., 2007; Hock et al., 2008; Novelli et al., 2017). The vegetation around the measurement site consists of coniferous trees and beeches growing on the slopes of the mountain, while grassland and marshes are dominant in the valley. Tourism-related vehicular emissions represent a potential source of local anthropogenic pollution, especially at the weekends. The nearest city, Munich, is about 70 km to the north-east.
Trace gases were sampled into the NO3 reactivity and NO2 CRD instruments through 1 inch outer-diameter PFA tubing (20 m long, operated at a flow of 40 dm3 min−1; STP) located 1.5 m above the roof directly next to the VOC inlet. The inlet was circa 3 m of distance from the inlet used for the other NOx measurements and circa 2 m of distance from the OH reactivity inlet.
2.1 NO3 reactivity measurements
The NO3 reactivity instrument was operated in a laboratory located on the third floor of the MOHp station building at the Hohenpeissenberg. Air samples were drawn at a flow rate of 2900 cm3 (STP) min−1 through a 2 µm membrane filter (Pall Teflon) and 4 m of PFA tubing (6.35 mm OD) from the centre of the bypass flow (see above), resulting in a 7.5 s residence time for the transport of air from the sampling point. During night-time (≈ 19:00–03:50 UTC) ambient air samples were drawn through a heated glass flask (35 ∘C, residence time 20 s) to destroy ambient N2O5 and NO3, which would potentially interfere with the reactivity measurements. Operational details of the instrument were recently described by Liebmann et al. (2017). NO3 radicals were generated by mixing NO2 and O3 at elevated pressure (1.5 bar, ≈5 min reaction time) and passing the mixture through an oven at ≈ 100 ∘C to convert all N2O5 to NO3 (Reactions R2–R5). The effluent from the oven was mixed with either zero-air or ambient air in a flow tube with the temperature set to 21 ∘C to yield typical (initial) NO3 mixing ratios of 40–60 pptv.
After a fixed reaction time, the remaining NO3 was detected by cavity ring-down spectroscopy (CRDS) at 662 nm. The lower pressure at the top of the Hohenpeissenberg station (903±8 hPa) meant that the reaction time was reduced from 10.5 s as previously reported (Liebmann et al., 2017) to 9.5 s. The measurement cycle was typically 400 s for synthetic air and 1200 s for ambient air, with intermittent signal zeroing (every ≈100 s) by addition of NO. The fractional loss of NO3 in ambient air compared to zero-air was converted to a reactivity via the numerical simulation of a simple reaction scheme (Liebmann et al., 2017) using measured amounts of NO, NO2, and O3. The parameter obtained, , is an NO3 loss rate constant from which contributions by NO and NO2 have been removed and thus refers to reactive loss to organic trace gases (OTGs) only. Throughout the paper, NO3 reactivity and are equivalent terms, with units of s−1. The upper measurement limit to was 45 s−1, achieved by automated, dynamic dilution of the air sample. The lower limit was 0.005 s−1, defined by the stability of the NO3 source. Online calibration of the reactivity using an NO standard was performed every ≈2 h for 10 min. The uncertainty of the measurement was between 0.015 and 0.205 s−1, depending mainly on dilution accuracy, NO levels, and the stability of the NO3 source as described by Liebmann et al. (2017). Since its first description in Liebmann et al. (2017), the instrument has been extended with a further cavity to measure mixing ratios of NO2 (see below).
2.2 NO2, NO, and O3 measurements
Since its first deployment, the NO3 reactivity instrument described by Liebmann et al. (2017, 2018) has been extended with a further cavity to measure NO2. This is described here for the first time and thus in detail. The CRDS measurement of NO2 uses a 2500 Hz, square-wave-modulated, 40 mW laser diode located in a Thorlabs LDM21 housing and thermally stabilized at 36 ∘C using a Thorlabs ITC-510 Laser Diode Combi Controller to produce light at 405 nm (0.5 nm full-width at half-maximum). The laser-diode emission is first directed through an optical isolator (Thorlabs IO-3D-405-PBS), focused by a lens (Thorlabs C340TMD-A) into the optical fibre (0.22 NA, 50 µm core, 400–2400 nm), and then collimated (Thorlabs FiberPort collimator PAF-X-7-A) to a beam diameter of about 6 mm before entering the cavity. Part of the laser emission was directed to an Ocean Optics spectrograph to continuously measure the laser emission spectrum.
The NO2 cavity (Teflon-coated glass; DuPont, FEP, TE 9568, length 70 cm, volume 79 cm3) was operated at 30 ∘C at a flow rate of 3000 cm3 (STP) min−1, resulting in a residence time of approximately 1 s. To remove particles, air was drawn through a 2 µm membrane filter (Pall Teflon) from the centre of the same high-flow bypass used for the NO3 reactivity measurements. Light exiting the cavities through the rear mirror was detected by a photomultiplier (Hamamatsu E717-500), which was screened by a 405 nm interference filter. The pre-amplified PMT signal was digitized and averaged with a 10 MHz, 12 bit USB scope (Picoscope 3424), which was triggered at the laser-modulation frequency of 2500 Hz.
The ring-down constant in the absence of NO2 was obtained by adding zero-air every 30 points of measurement for approximately 15 s. The L ∕ d ratio (the ratio of the distance between the cavity mirrors, L, and the length of the cavity that is filled by absorber, d) was determined as described previously (Schuster et al., 2009; Crowley et al., 2010) and was 1.00±0.03. Inverse decay constants in dry zero-air at 660 Torr were usually between 28 and 31 µs, indicating optical path lengths of ≈8–9 km. The measurement precision (6 s integration) was circa 150 pptv. The cavity was not pressure stabilized, leading to a pressure difference of circa 2.5 Torr when switching from ambient air to zero measurements. The data were corrected for the change in Rayleigh scattering resulting from the pressure difference (typically 120 pptv) and also different relative humidities (typically 60 to 100 pptv) when switching from ambient to zero-air measurement as described by Thieser et al. (2016). The laser spectrum was measured every hour and used to calculate an effective cross section ( cm2 molecule−1) using a literature absorption spectrum (Voigt et al., 2002). The overall uncertainty of the measurement is mainly determined by the uncertainty in the cross section (6 %). Other contributions are from NO2 formation (from reaction of NO with O3 in the inlet lines, ≈0.5 %), the correction for humidity and pressure differences (5 %), and uncertainty in the L ∕ d ratio (2 %), giving an estimated uncertainty of 9 %. The detection limit of the instrument can be estimated from the variability in the zeros and was usually around 150 pptv.
NO2 measurements were made from 20 July to 4 August with breaks from 27 July to 2 August and from 4 to 6 August due to instrumental problems. NO2 mixing ratios were corrected for its formation (Reaction R1) during transport from the rooftop inlet to the cavity (≈7.5 s).
Two commercially available instruments operated permanently at the site also provided measurements of NO2 and NO. These were a cavity phase-shift (CAPS) instrument for NO2 measurement and a chemiluminescence device (CLD) for NO2 and NO. The CAPS (Aerodyne ambient monitor version 2012) had a detection limit of 315 pptv (3σ in 1 min integration time) and an uncertainty of 10 % (1 min integration time). The uncertainty of the CAPS increased during the period of the campaign due to increased noise, probably caused by an undetected leakage or mechanical instability between the lens and the mirror of the measurement cell.
The CLD (ECO PHYSICS, model AL 770 pptv) uses chemiluminescence from the reaction of NO with ozone in combination with a blue-light converter to convert NO2 to NO. The instrument was routinely calibrated once a week (10 ppmv ± 5 % NO in N2; Riessner, Germany). Deviations between two calibrations are typically below 3 %. Detection limits during the intensive were 11 pptv for NO, 16 pptv for NO2 (3σ in 1 min integration time), and median uncertainties are 27 pptv (7 %) for NO and 70 pptv (10 %) for NO2 (2σ at 1 ppbv in 1 min integration time). Corrections were applied to take into account NO loss (≈5 %–30 %) and NO2 formation (≈0 %–12 %, typically ≈2 %) due to further reactions involving ozone in the inlet tubing.
A comparison of the three NO2 measurement instruments is given in Fig. S1 of the Supplement, which plots the NO2 mixing ratios (averaged over 60 s) of the CLD and CAPS instruments versus the CRDS. A least-squares fit (considering errors in both parameters) to the plot of NO2 (CLD) versus NO2 (CRDS) has a slope of 0.94±0.25 and an intercept of 0.00±0.04. For the plot of NO2 (CAPS) versus NO2 (CRDS) comparison we derive a slope of 0.95±0.02 and an intercept of 0.00±0.02. Within combined uncertainty, the NO2 measurements are thus in agreement. The NO2 mixing ratios used as input to calculate the NO3 reactivity were taken from the CRDS instrument, with data gaps filled by CAPS measurements.
Ozone was monitored with a UV absorption instrument (Thermo Environmental Instruments Inc., model TECO 49C), which is calibrated at regular intervals with a transfer standard (TECO 49PS). The uncertainty in the ozone mixing ratio is 1.2 ppbv or 2 % (2σ in 1 h).
2.3 NO3 measurements
For the measurement of ambient NO3, a 10 m length of PFA tubing (3∕8 inch outer diameter) was installed on the top of the building circa 10 cm from the VOC inlet. A 2 µm pore PTFE filter (47 mm in diameter, replaced every hour) in a PFA filter holder was located at the end of the inlet. The tubing was connected to a bypass pump operated at 20 dm3 (STP) min−1 to reduce the residence time. The sample flow through the cavity was increased to 8 dm3 (STP) min−1 to reduce the NO3 residence time within the cavity. NO3 mixing ratios were recorded every 6 s (3600 ring-downs co-added) with zeroing by titration (NO addition) every 15 data points. The NO3 transmission through the inlet (67±15 %), filter and filter holder (84±10 %), and cavity (88±10 %) was established post-campaign as described by Schuster et al. (2009) and used to correct the data. The overall uncertainty in the NO3 measurements, including uncertainty in the absorption cross section, was circa 35 %.
2.4 OH reactivity measurements
OH reactivity measurements were conducted using a chemical ionization mass spectrometer (CIMS) in which OH radicals (generated by the photolysis of H2O at 184.95 nm) are converted to H2SO4 (Berresheim et al., 2000; Schlosser et al., 2009). For the derivation of OH reactivity (), relative OH radical concentrations are measured at two fixed reaction times and a decay constant is derived assuming exponential behaviour. After correction for wall losses, as well as NO-induced HOx recycling in the sample tube, ambient reactivities between 1 and 40 s−1 are measurable. OH reactivity measurements were made every 20 min throughout the measurement period. Measurements were discontinued during periods of precipitation and when the pinhole to the mass spectrometer vacuum system was blocked by insects. The instrument performs best if NO mixing ratios are below 4 ppbv and reactivities do not exceed 15 s−1; for the measurements reported here, the mean uncertainty in the OH reactivity was ±1.2 s−1 (or 46 %). OH reactivity calibration was carried out before and after the measurement period, and the calibration factor was applied to the whole dataset. The determination of the OH wall loss rate from zero reactivity measurement (null measurement) using synthetic air cylinders was not reliable and therefore the zero was estimated using night-time measurements when sampling from above the boundary layer. Details are given in the Supplement.
2.5 VOC measurements
A gas chromatograph (GC-MS/FID model Agilent 6890 with 5975 B inert XL MSD) was used for the detection of C5–C13 NMHCs and BVOCs (Hoerger et al., 2015). In a custom-made pre-concentration unit, air was sampled at 30 ∘C on a three-bed adsorption trap and, after a cryo-focussing step, injected onto the GC column (50 m BPX-5). Subsequently, signals were detected with a mass spectrometer (MS) running in parallel with a flame ionization detector (FID). The instrument measured i.a. isoprene and a wide variety of monoterpenes with uncertainties (2σ) from 6 % to 100 % depending on the compound.
For the detection of light NMHCs (C2–C8), a GC-FID system (GC-1, Varian 3600 CX, FID detector) described in detail by Plass-Dülmer et al. (2002) was used. In both systems, an ozone scrubber (impregnated filter with Na2SO3) was used and water was removed from the sample air either by hydrophobic adsorbents (C5–C13) or a cold trap (C2–C8) prior to the pre-concentration step. VOCs were sampled every hour for either 15 (C2–C8) or 20 min (C5–C13). During the rainy period from 24 July 12:00 UTC to 27 July 12:00 UTC, VOCs were only measured twice daily.
2.6 Particle measurements
The aerosol surface area was calculated using particle number size distributions obtained from a custom-built SMPS described in detail in Wiedensohler et al. (2012) and Birmili et al. (2016). Briefly, the instrument uses a Vienna-type DMA with a condensation particle counter (CPC model 3772, TSI Inc.) to measure particles between 10 and 800 nm. The sheath flow rate is 5 L min−1 at an aerosol flow rate of 1 L min−1; both are actively dried. The typical time resolution for one combined up-scan and down-scan is 5 min.
Figure 1 displays the time series of NO3 reactivity () along with related trace gases and meteorological data obtained during the intensive. Sunrise was around 03:50 UTC and sunset at ≈19:00 UTC. Two mild days (Tmax=20–25 ∘C) at the beginning of the campaign were followed by a 3-day period with heavy rains and maximum temperatures of around 10 ∘C and then by a warm period with temperatures up to 30 ∘C and occasional thunderstorms. The predominant wind direction was west–south-west with only minor contributions from other directions (Fig. S2). Wind speeds were generally around 2.5 to 7.5 m s−1, increasing up to 15 m s−1 during the rainy periods. The highest values of were detected with north-easterly winds (Fig. S2) coincident with the warmest days of the campaign and the highest biogenic emissions (see Sect. 4.2). Ozone mixing ratios were strongly correlated with temperature and ranged from 85 ppbv on 1 August during the warm, photochemically intense period to less than 20 ppbv during the cool, rainy period between 23 and 28 August. NOx levels () during the intensive were generally between about 0.5 and 4 ppbv. The mixing ratios of NO, a trace gas which can potentially impact NO3 lifetimes, were generally below the detection limit (≈12 pptv) during most of the nights, increasing to maximum values of <1 ppbv during the day. Occasional maxima of more than 1 ppbv NO were observed due to local traffic.

Figure 1Overview of measurements during the 2017 intensive. The grey shaded area represents night-time. GR: global radiation, RF: rainfall, RH: relative humidity, T: temperature, WS: wind speed, WD: wind direction.
3.1 NO3 reactivity
NO3 reactivity was measured continuously during a 3-week intensive (20 July to 6 August 2017) with the exception of one night (2–3 August) when, using the same instrument, NO3 mixing ratios were measured instead. The full dataset of is reproduced in Fig. S3 of the Supplement together with the corresponding 95 % uncertainty limits, which take into account drifts in the zero signal, the stability of the NO3 source, uncertainty in the dilution factors, uncertainty of the NO and NO2 mixing ratios, and the corresponding rate constants.
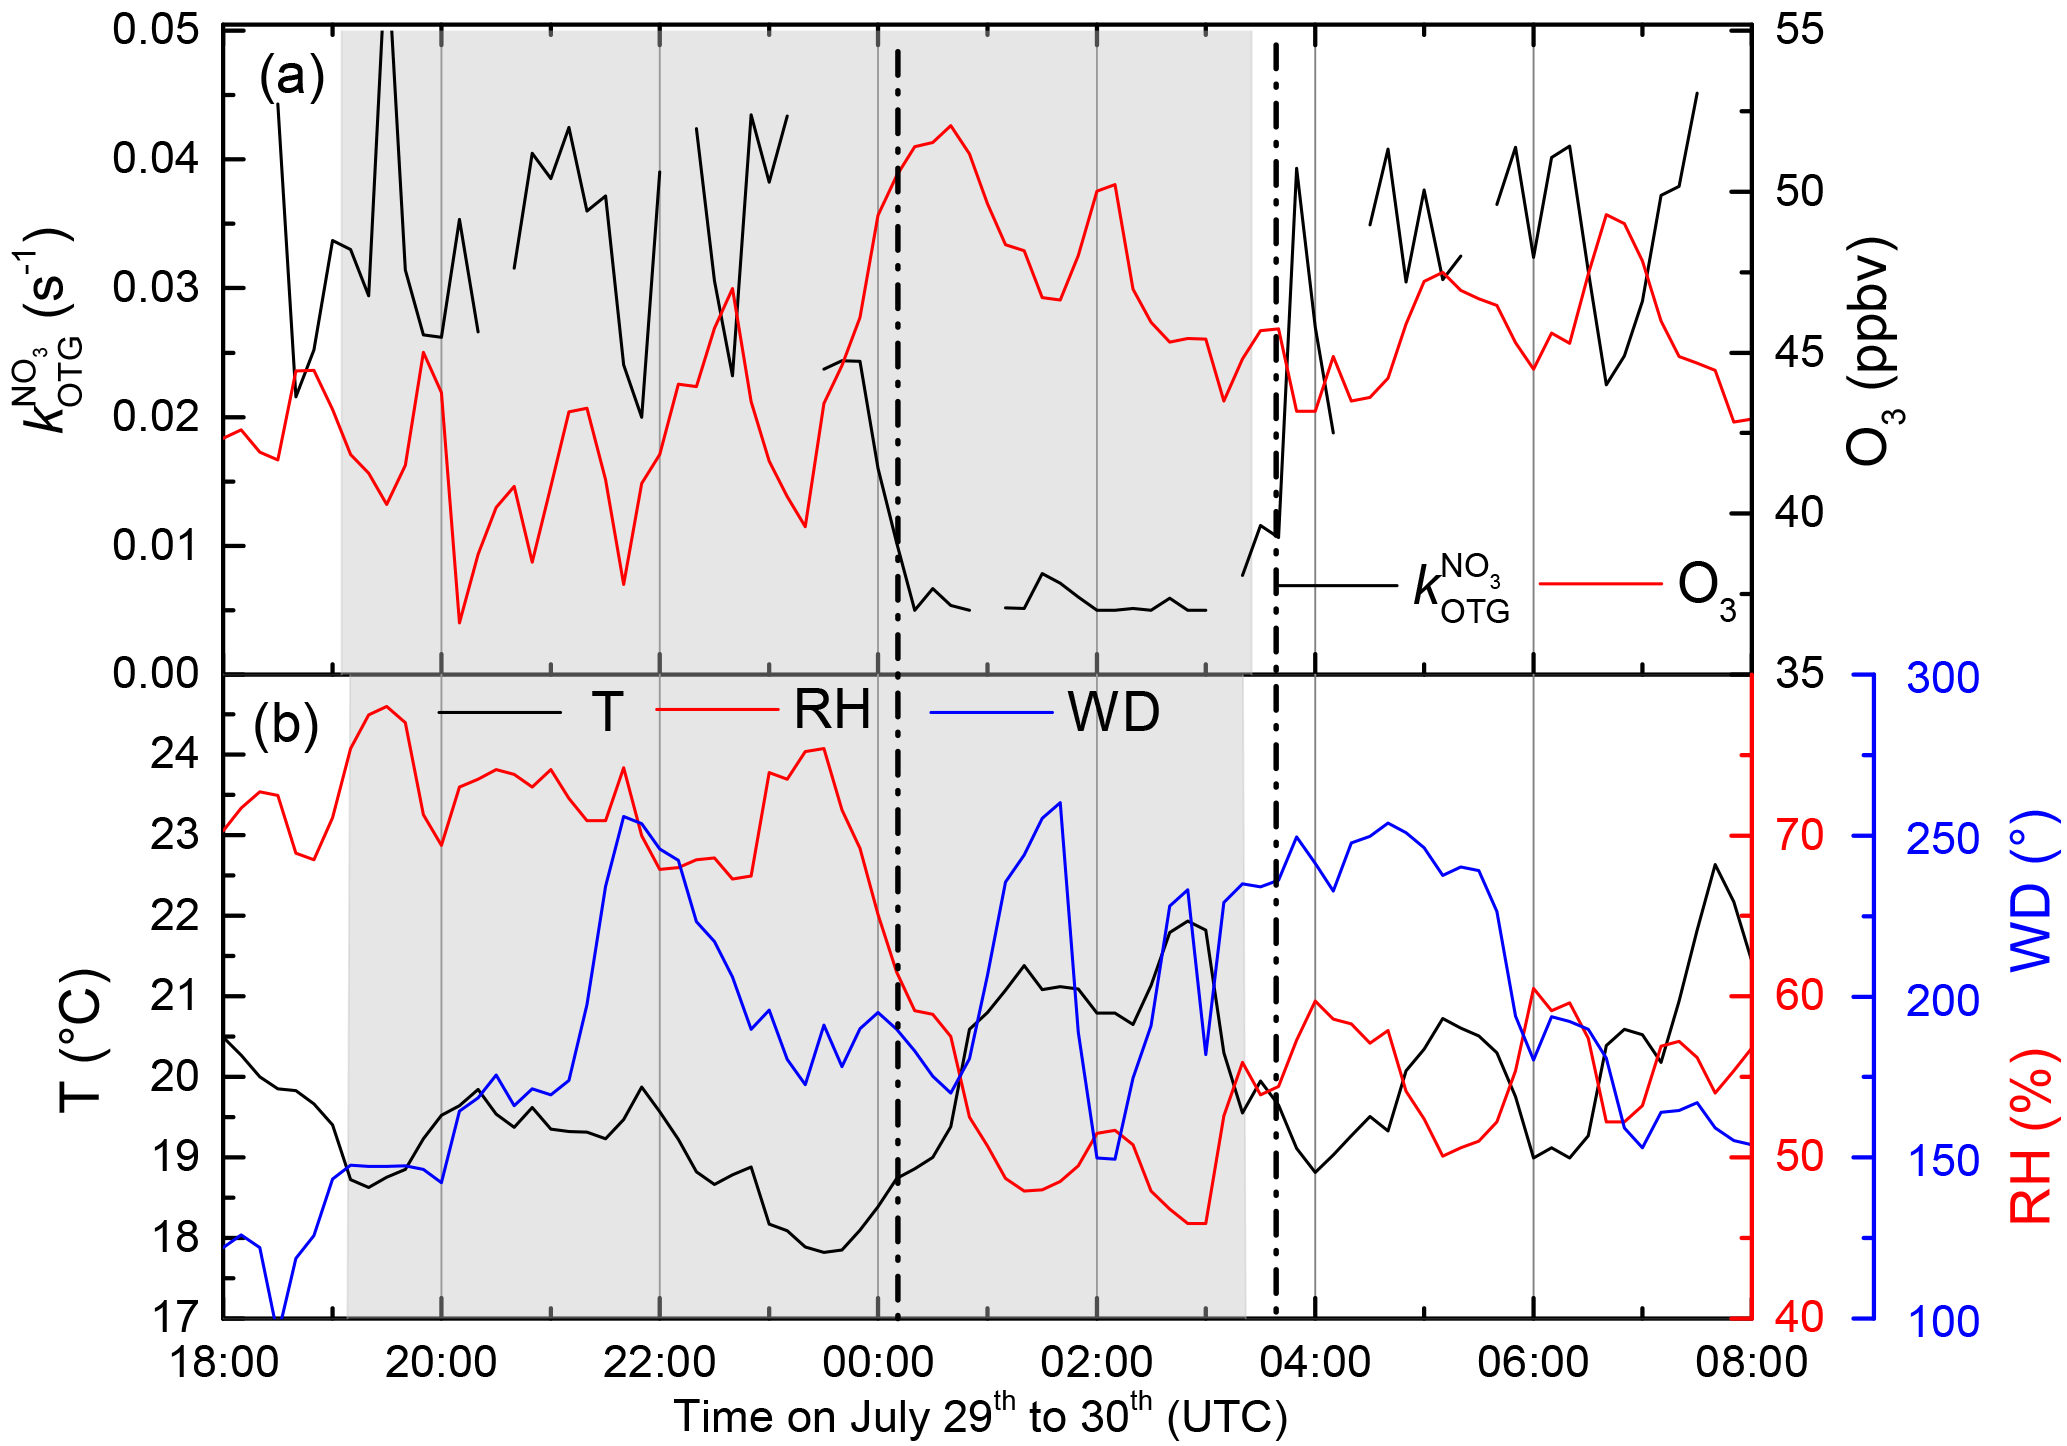
Figure 2(a) (black) and O3 mixing ratios (red) from 29 to 30 July. From 23:50 UTC until sunrise the measurement site is located in the residual layer and free troposphere. (b) Temperature (T), relative humidity (RH), and wind direction (WD) during the same period.
As described above, during daytime the short NO3 lifetime normally results in levels that are under the detection limit of most instruments, precluding the estimation of NO3 reactivity via stationary-state calculations based on its mixing ratio and production rate. In contrast, our direct measurement enables us to derive the NO3 reactivity over the full diel cycle. During the intensive, the 10 min averaged values of ranged from below the detection limit (<0.005 s−1) to values as high as 0.3 s−1. Campaign-averaged values were low (≈0.01 s−1) during night-time but a factor of 10 larger ≈0.1 s−1 at 14:00 UTC (local 16:00) and more variable during daytime.
This observation is in stark contrast to the high relative night-time–daytime NO3 reactivities we observed in a boreal forest (Liebmann et al., 2018) and is related to very different meteorological conditions at the two sites. In the boreal forest, the canopy-level NO3 reactivity was controlled by the rate of emission of biogenic VOCs into a nocturnal boundary layer of varying height and stability. The elevated location of the Hohenpeissenberg observatory, located on a mountaintop above the surrounding countryside, favoured sampling from the residual layer and free troposphere at night-time. In the absence of turbulent exchange, the residual layer and free troposphere may become disconnected from the planetary boundary layer (PBL) and thus from ground-level emissions of reactive trace gases; the layers may thus contain low levels of biogenic trace gases as well as low(er) levels of NO2 and higher levels of ozone (Aliwell and Jones, 1998; Allan et al., 2002; von Friedeburg et al., 2002; Stutz et al., 2004; Brown et al., 2007a, b; Brown and Stutz, 2012). NO3 lifetimes as long as 1 h (using stationary-state analyses) have been reported for mountain sites when sampling air from above the nocturnal boundary layer (Brown et al., 2016; Sobanski et al., 2016).
During the Hohenpeissenberg intensive two distinct air mass types were encountered at night, whereby values of were either at (or below) the detection limit or well above it (referred to as “type 1” and “type 2”, respectively). Figure 2 displays a time series of over a single night (29–30 July) in which a switch from type 2 to type 1 was observed. From early evening until shortly before 12:00 UTC, NO3 reactivity was variable with values between circa 0.02 and 0.03 s−1. A sharp reduction in was then observed with values close to the detection limit until sunrise (04:00 UTC). The reduction in was accompanied by a drop in relative humidity (from 70 % to 60 %) and an increase in O3 (46 to 52 ppbv), both clear indicators of sampling from the residual layer. At the same time, the wind speed increased and the temperature became more variable, indicating that the site was close to the inversion level. At first sunlight, turbulent mixing resulted in gradual connection of the boundary layer and overlying residual layer, leading to an increase in . Upslope winds caused by heating of the mountainside may also have enhanced transport of air masses with high reactivity to the measurement site. Median diel profiles of NO3 reactivity on type 1 (altogether five) and type 2 nights (altogether 10) are shown in Fig. 3. With the exception of the very low reactivity during type 1 nights, type 1 and type 2 have similar diel shapes and similar maximum reactivities.
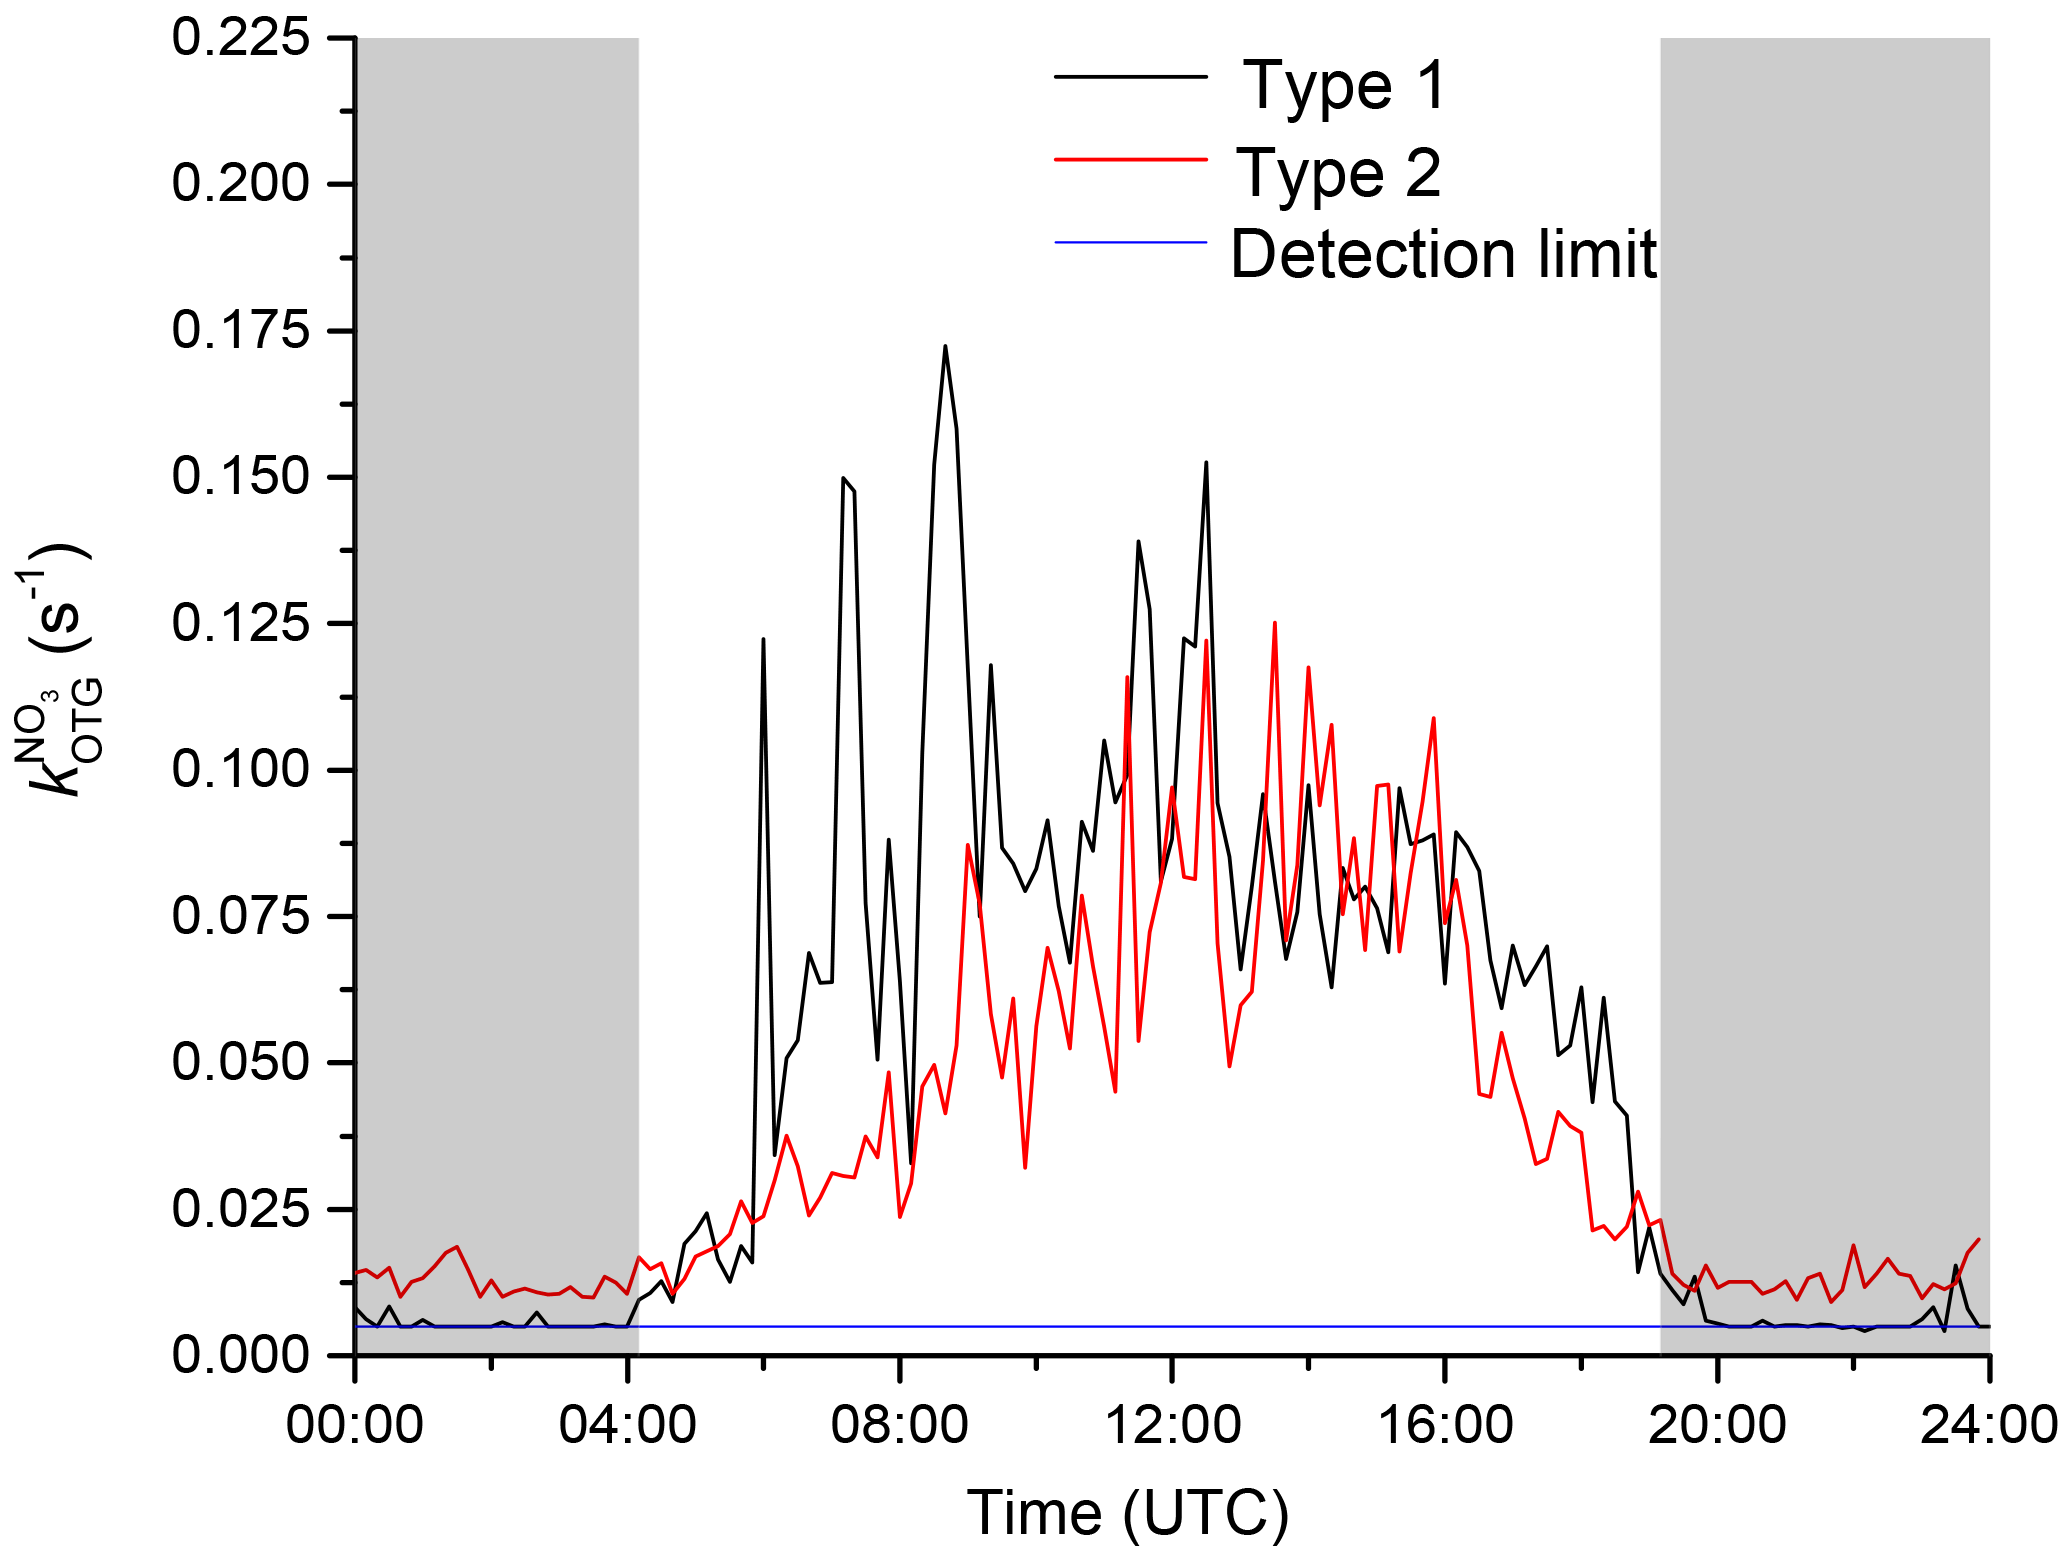
Figure 3Median diel profile of the NO3 reactivity. Type 1 nights (black line) show values around the detection limit during night, and type 2 nights (red line) are above the detection limit.
3.2 NO3 reactivity calculated from VOC measurements
In this section we assess the contribution of various VOCs to the observed NO3 reactivity. The most abundant BVOCs were isoprene, sabinene, α-pinene, and β-pinene with maximum mixing ratios during the warm period around August. The time series of BVOC mixing ratios are displayed in Fig. S4 of the Supplement. is a total loss rate constant for chemical reactions of [NO3] with all organic trace gases present and can be compared to the summed loss rate constant () (also in units of s−1) obtained from the concentrations of individual VOCs in the same air mass, [Ci], and the rate coefficient (ki):
where [Ci] is the measured BVOC concentration and ki the corresponding rate constant. Individual values of , calculated using rate constants from the IUPAC evaluation (IUPAC, 2018) or elsewhere in the literature (Shorees et al., 1991), are plotted with interpolated 20 min averages of as a time series in Fig. 4a.
The data are also displayed as a pie chart in Fig. 4b in which the contribution of individual biogenic trace gases to the NO3 reactivity are listed. Of the terpenoids, α-pinene contributed most to the overall NO3 reactivity (≈16 %) followed by sabinene (≈12 %) with other individual BVOCs contributing less than 10 %. VOCs such as methanol, acetaldehyde, ethanol, acetone, methylethylketone, alkanes, and aromatics were also measured but not included in calculations of as their summed contribution reached a maximum of s−1 and was on average s−1. As and show a similar dependence on wind direction (Fig. S2) and because only BVOCs were used for the derivation of , we conclude that the high NO3 reactivities measured in air masses arriving from the east and north-east are mostly from trace gases of biogenic origin.
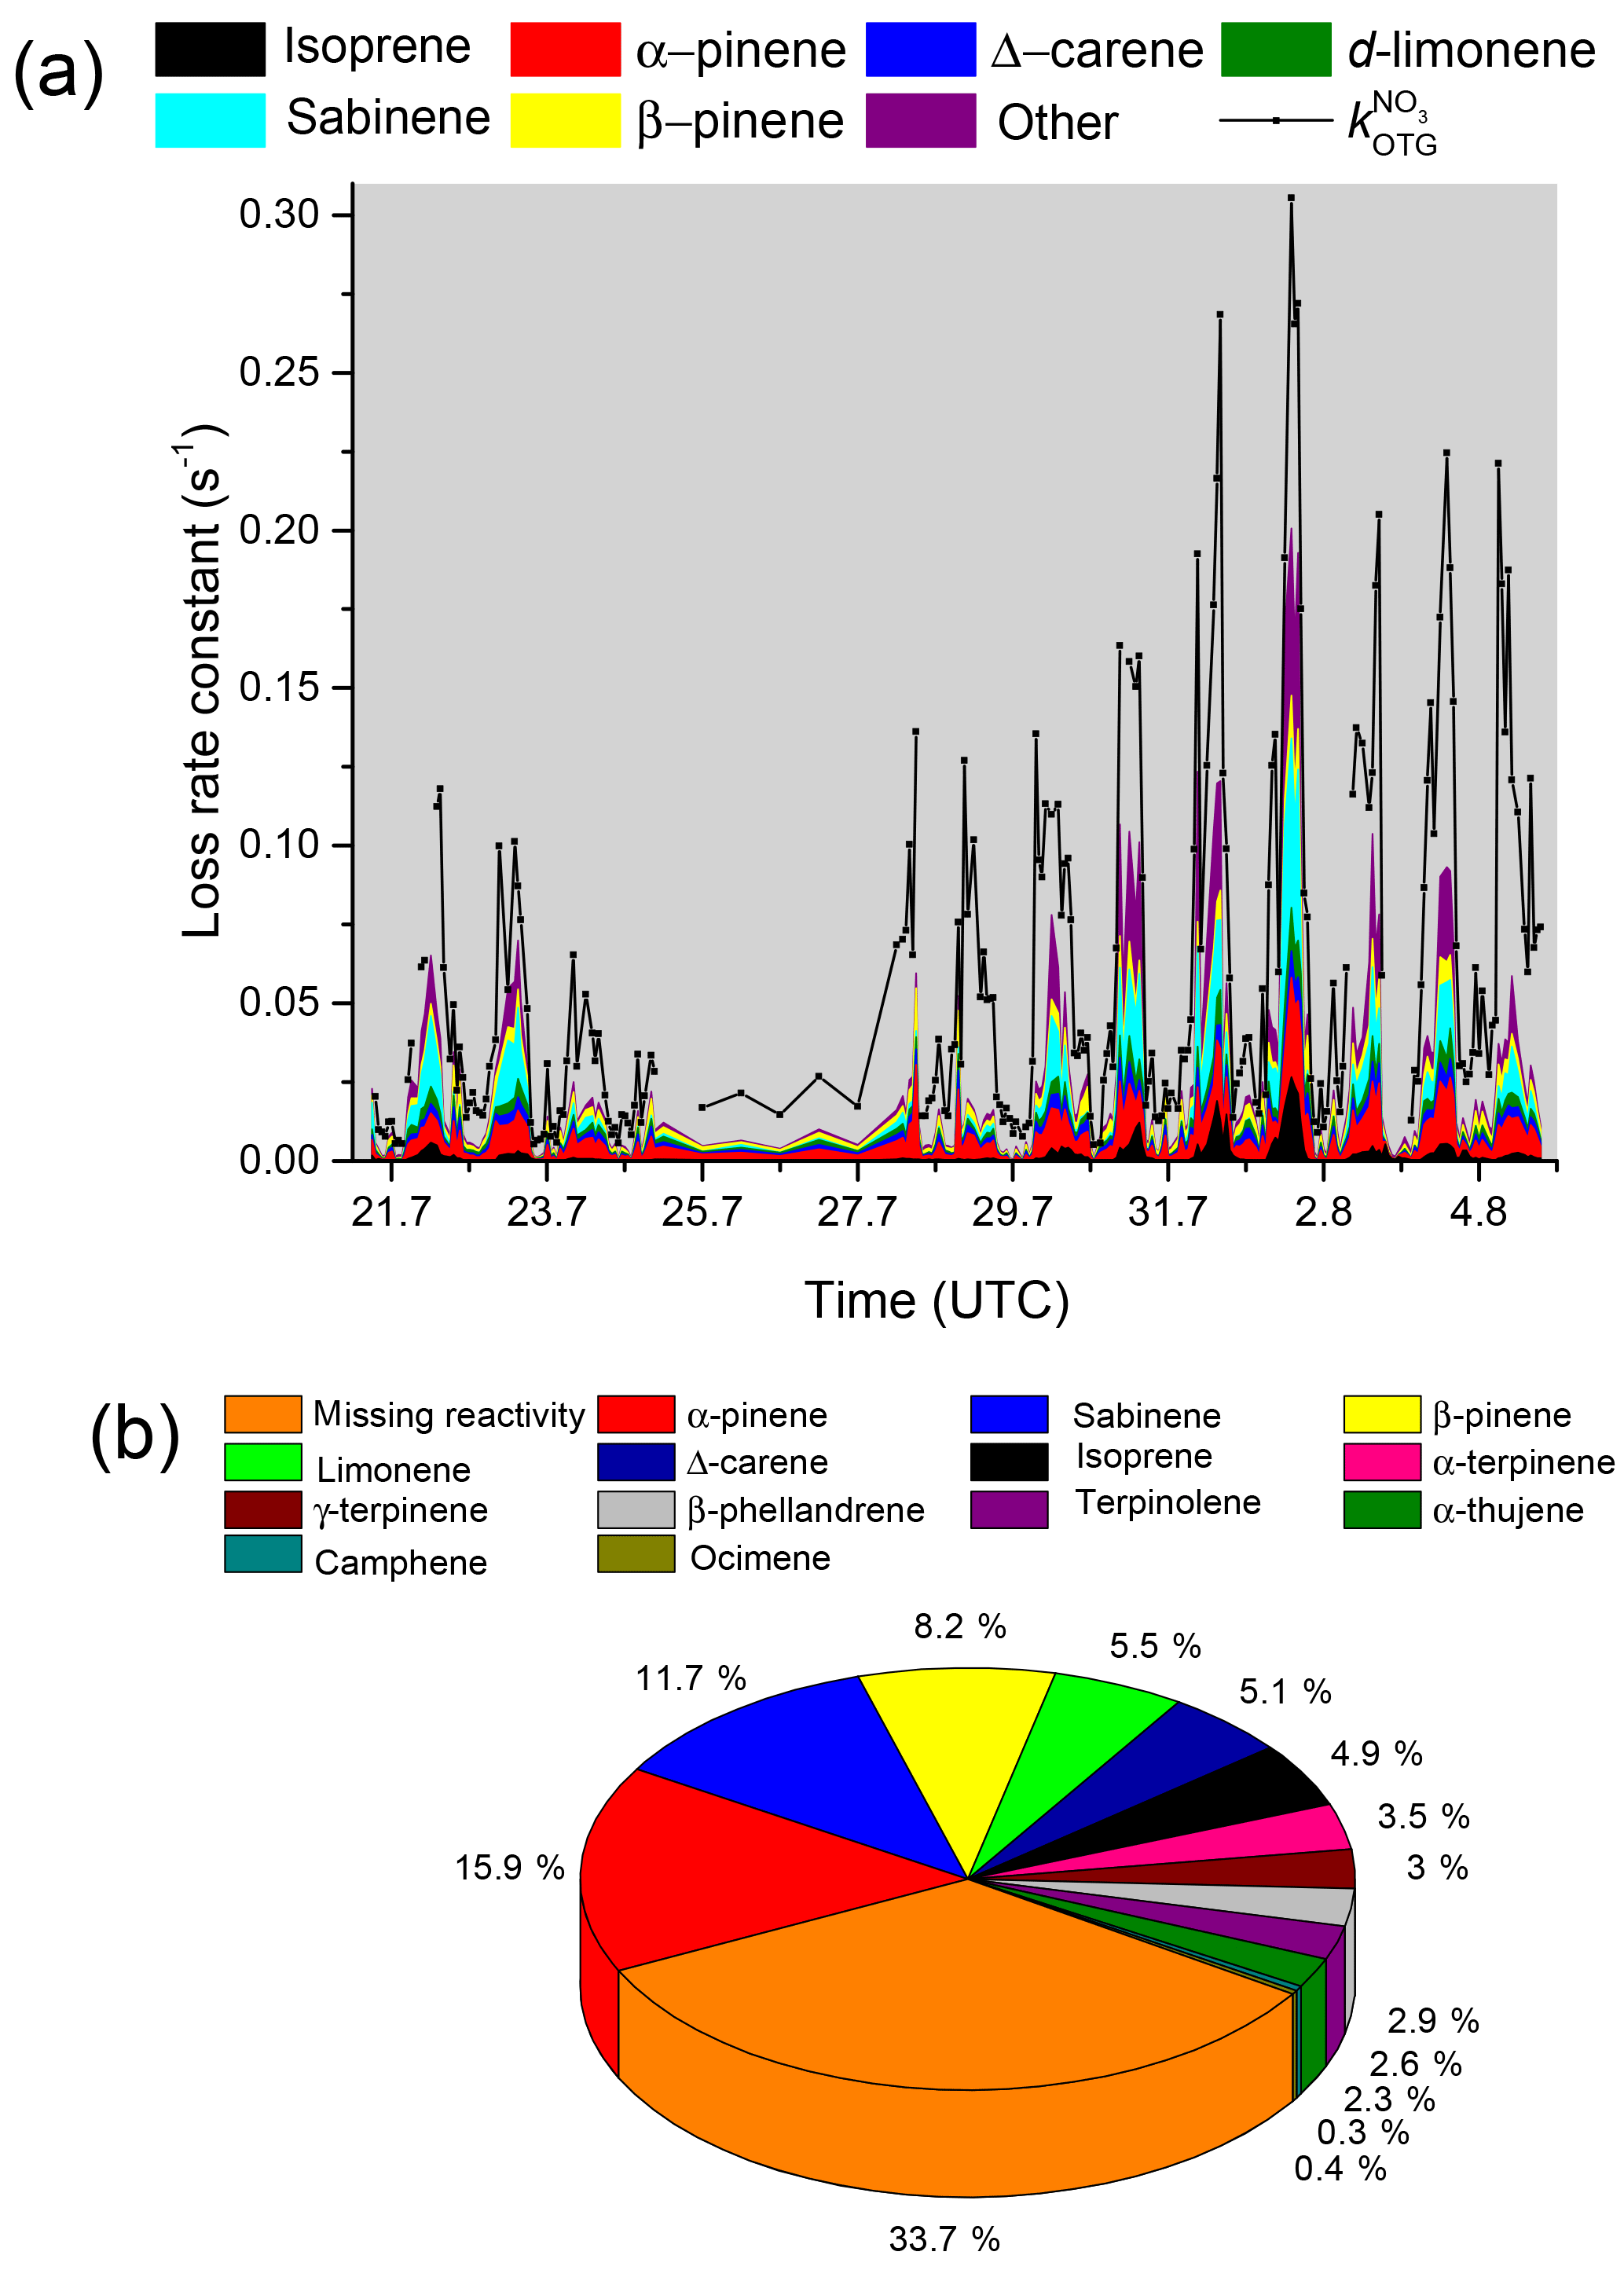
Figure 4(a) Measured values of (black) compared to the loss rate constant attributed to individual VOCs. The term “other” includes terpinolene, β-phellandrene, α-terpinene, γ-terpinene, α-thujene, and camphene. Myrcene and α-phellandrene were also measured but below the detection limit during the whole campaign. The pie chart (panel b) indicates the campaign-averaged contribution of each measured VOC to the NO3 loss rate as well as reactivity that could not be attributed to measured VOCs (“unassigned reactivity”).
Type 1 nights were characterized by very low BVOC mixing ratios, sometimes below the detection limit, whereas isoprene was still present. This observation is consistent with a long lifetime for isoprene in the residual layer at night (Brown et al., 2007a) as the OH concentration is too low and the NO3 reaction too slow to remove it efficiently. Under conditions of very low NO3 reactivity, the fractional contribution of isoprene to the overall reactivity could increase to ≈100 % (from typically 20 % during the day). During type 2 nights (those with non-zero NO3 reactivity) isoprene and monoterpenes were always detected and monoterpenes were the dominant reaction partners for NO3.
The difference between and (i.e. the NO3 reactivity not accounted for by measured VOCs) is defined as unassigned reactivity (s−1).
A plot of versus (see Fig. S5 of the Supplement) has a slope of 1.55 and an intercept of 0.005. This implies, on average, an unassigned reactivity of ≈34 % when s−1 and a unassigned reactivity of ≈50 % when s−1. However, both and are associated with uncertainty, which needs to be rigorously assessed to test whether the unassigned reactivity is significant. To do this we propagated uncertainty in each of the terms (mainly related to VOC measurements and assuming 15 % uncertainty in the rate coefficients) and derived mean diel profiles of and for the whole campaign (hour averages). We note that IUPAC-listed uncertainties for each VOC are generally larger than 15 % (especially when only few studies are available) and the use thereof would substantially increase the uncertainty in . The results are shown as a time series and a campaign-averaged diel profile in Fig. 5. For the time series, we plot data points only when values of both and were available. The time series illustrates that, within combined uncertainty, the data overlap so that unassigned reactivity is not significantly distinct from zero apart from a few isolated data points. This contrasts with the conclusions of a previous campaign (boreal forest) with this instrument (Liebmann et al., 2018) in which up to 40 %–60 % of the measured reactivity could not be accounted for by measured VOCs.

Figure 5(a) Time series of and . The error bars on the measurements are total uncertainty calculated as described by Liebmann et al. (2017). The uncertainty in (shaded red area) is dominated by uncertainty in the mixing ratios of the VOCs. Panel (b) is a campaign-averaged diel profile of the same parameters, whereby the uncertainties also include variability.
The comparison of measured NO3 reactivity with that calculated from VOC measurements suffers from substantial uncertainties in both parameters. For this campaign, the uncertainty in NO3 reactivity was larger than previously reported (Liebmann et al., 2018) due to reduced stability of the NO3 source, which will be improved in future versions of the instrument. A further obstacle to the calculation of unassigned reactivity was the uncertainty in the measurements of biogenic VOCs and the associated rate constants for the NO3 reaction. The latter could be reduced by more plentiful and more accurate data on NO3 rate coefficients with some of the more important biogenic species.
3.3 NO3 measurements and comparison with stationary-state calculations
Although rough estimates of NO3 concentrations at the Hohenpeissenberg have been made (Handisides et al., 2003; Bartenbach et al., 2007), no direct NO3 measurement had been previously made. For this reason, on just one night during the intensive (2–3 August), the instrument was modified to enable measurement of ambient NO3 mixing ratios rather than NO3 reactivity. The NO3, O3, and NO2 mixing ratios and meteorological data are plotted in Fig. 6.
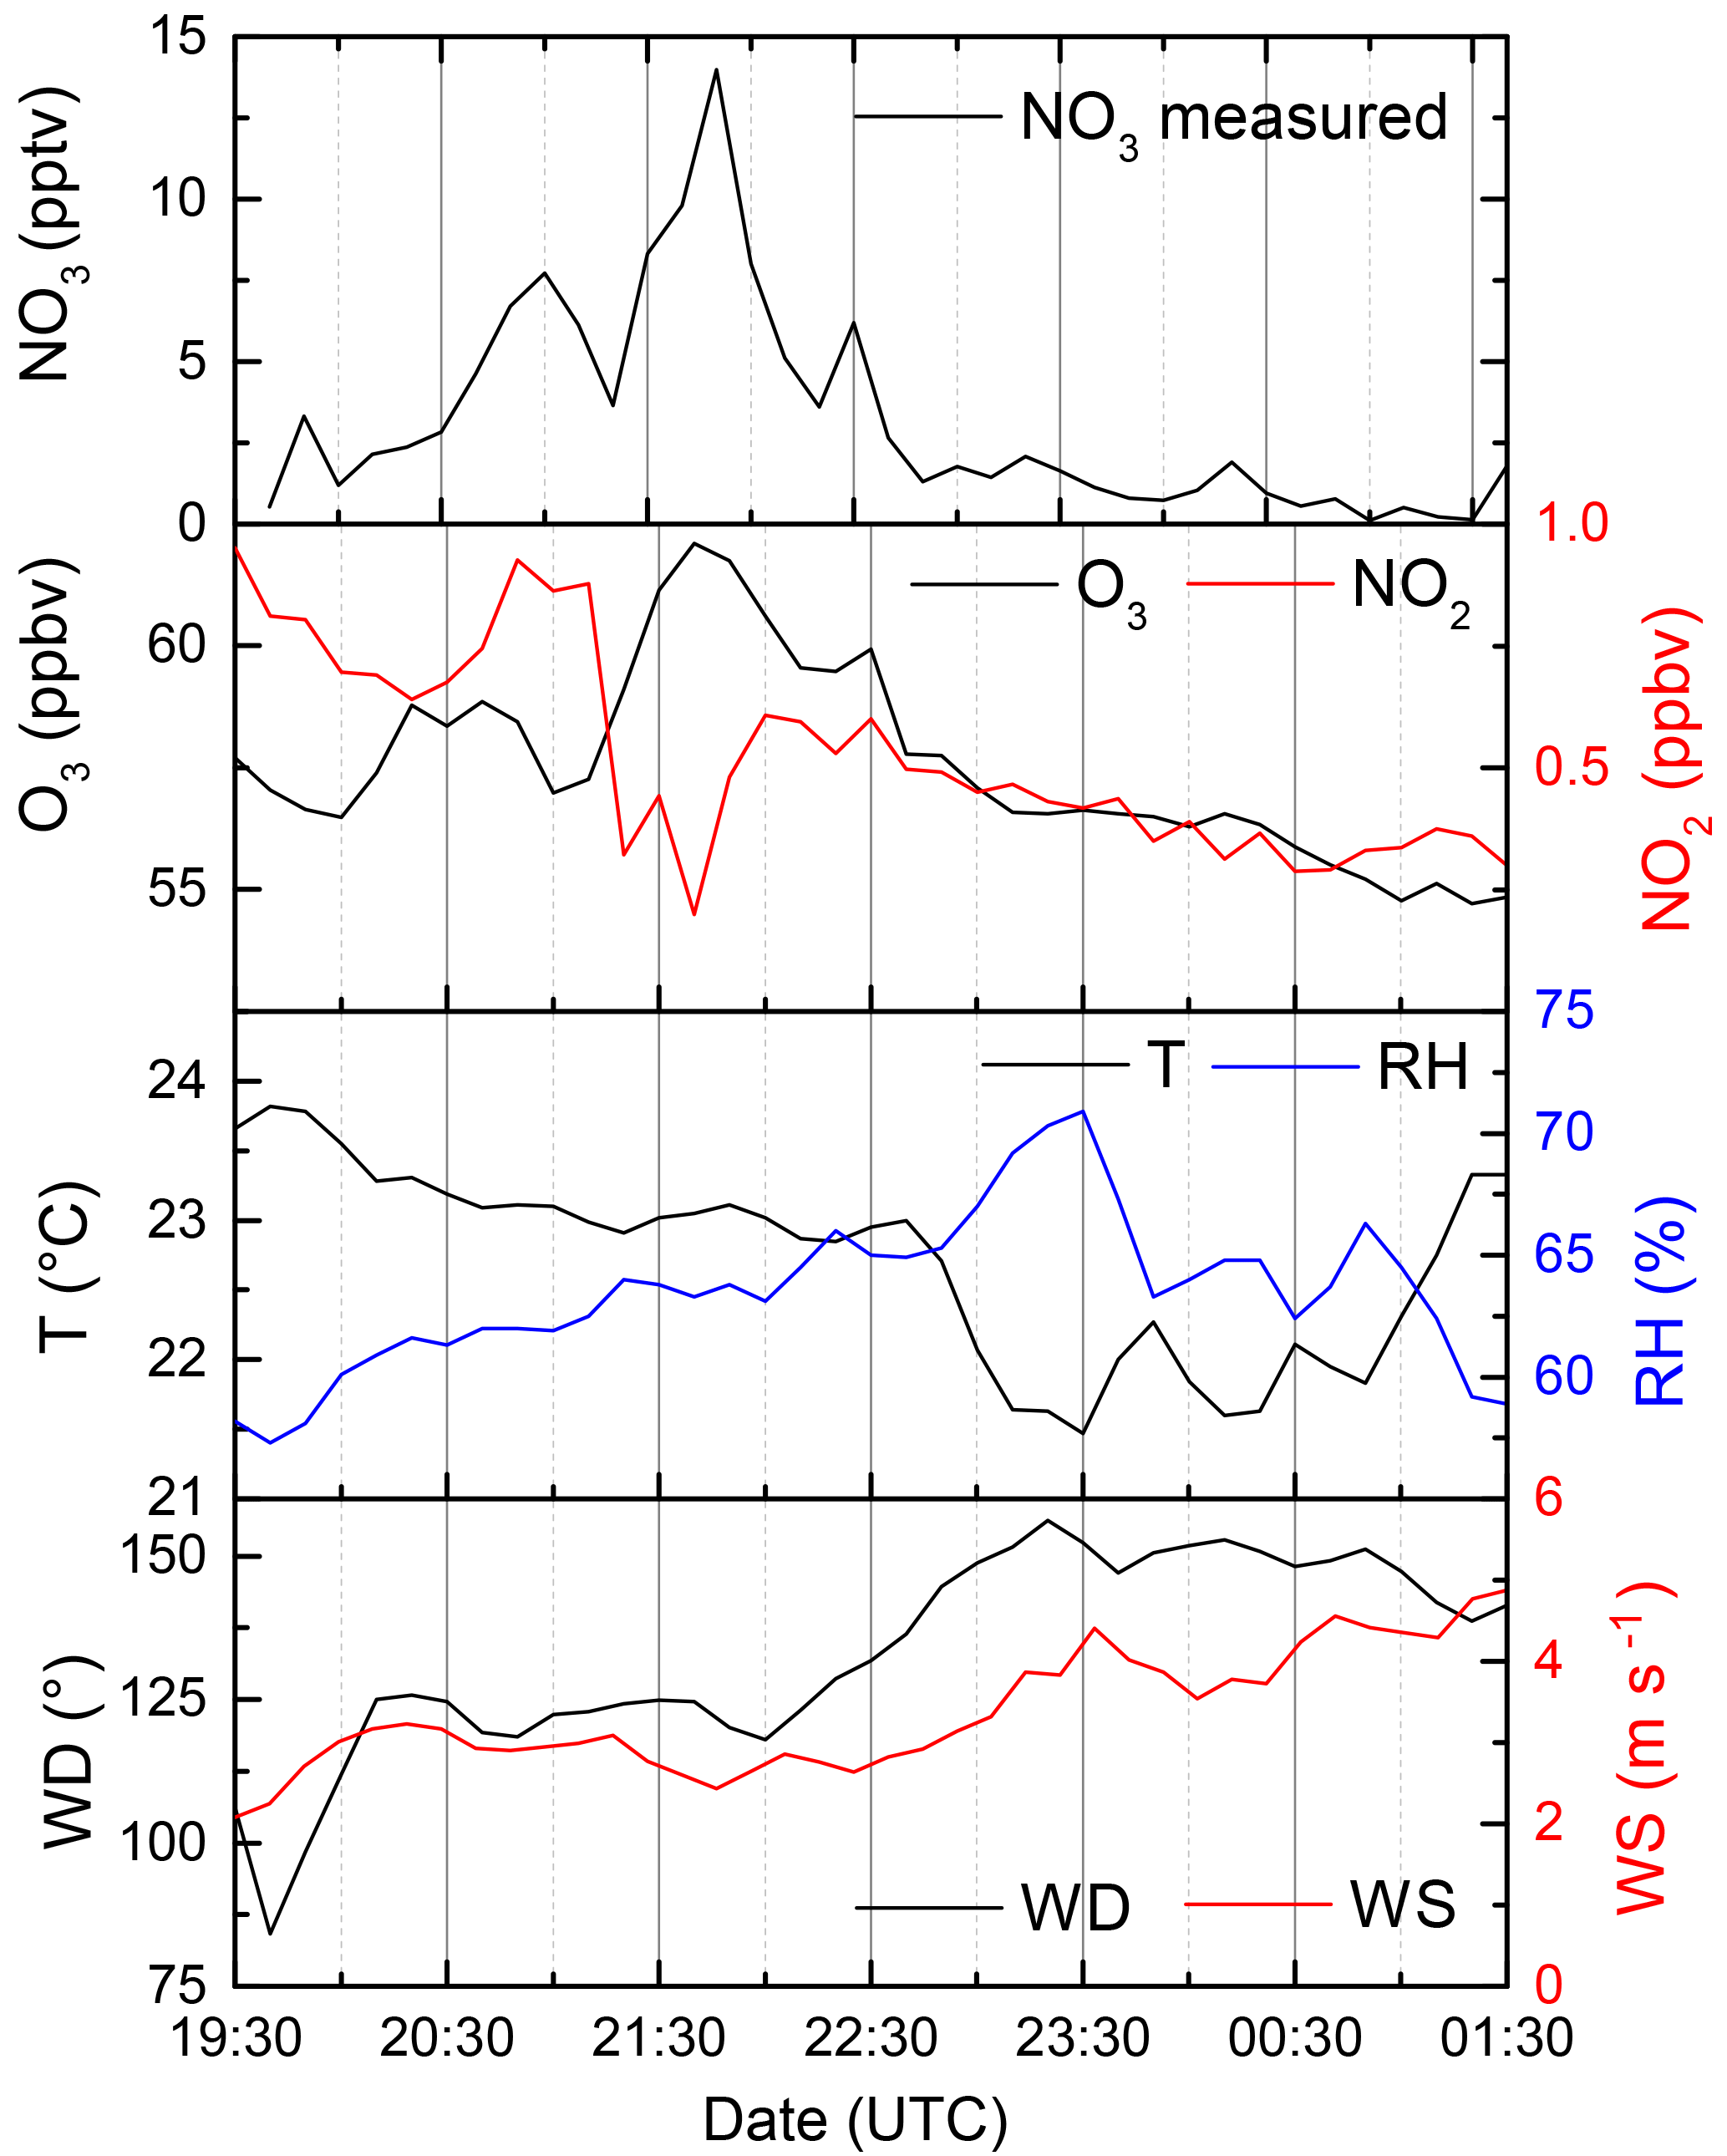
Figure 6NO3 mixing ratios measured in the night from 2–3 August as well as NO2 and O3 (which define the NO3 production rate). T: temperature, RH: relative humidity, WD: wind directions, WS: wind speed.
NO3 mixing ratios slowly increased in the first half of the night, reaching a maximum of 13 pptv around 21:40 UTC. At this time the O3 mixing ratios were also the largest and highly variable. After ≈22:30, O3 was slowly removed, and the NO3 decreased by a factor of 10 or more, indicating that the instrument was sampling more reactive boundary layer air. This is also evident in the increase in relative humidity and decrease in the temperature until about 01:30.
Given sufficient time, stationary state can be reached for NO3 at night in which the production and loss terms are approximately balanced (Brown et al., 2003a; Crowley et al., 2010, 2011). In this case NO3 mixing ratios can be described by the ratio of their production rate and loss rate (Eq. 3).
The production rate is governed by the [NO2] and [O3] mixing ratio and the corresponding rate constant k2. If the loss processes are due to reaction with VOCs only, this expression becomes
During this night was not measured so was used to account for NO3 losses.
Figure 7 shows the measured NO3 mixing ratios (black) compared to those derived from Eq. (4) using the measured VOC concentrations (red curve). Clearly, the predicted stationary-state NO3 concentrations are too high (by a factor of up to 3–4), implying that other NO3 loss processes must be considered. As the directly measured reactivity, , agrees rather well with that derived from VOC measurements () calculated on other campaign nights, it would seem unlikely that unmeasured VOCs contribute sufficiently to NO3 losses to explain this large factor. Stationary-state concentrations of NO3 are influenced not only by VOCs but also by NO (if present at night) and also indirectly via the heterogeneous loss of N2O5. Equation (5) can be extended to include these processes (Martinez et al., 2000; Geyer et al., 2001; Brown et al., 2003a, b, 2009; Crowley et al., 2010; Sobanski et al., 2016).
where K5 is the equilibrium constant for the forward and reverse Reactions (R4) and (R5). The loss frequency due to the heterogeneous uptake of N2O5 to particles (fhet) can be calculated by Eq. (6):
which is approximately valid if the particles are less than ≈1 µm in diameter. In this expression, A is the aerosol surface area density (cm2 cm−3), is the mean molecular velocity of N2O5 (26 233 cm s−1 at 298 K), and γ is the dimensionless uptake coefficient. If we assume a large value for the uptake coefficient of 0.03 as characteristic for aerosol with low organic content (Bertram and Thornton, 2009; Bertram et al., 2009; Crowley et al., 2011; Phillips et al., 2016) and use the aerosol surface area density of 1.25– cm2 cm−3 (measured by a scanning mobility particle sizer for 10–890 nm), we obtain values for fhet of 2.4– s−1. Incorporation of the heterogeneous loss of N2O5 reduces the predicted NO3 by only about 5 pptv as shown in Fig. 7 and cannot reproduce the observed NO3 mixing ratios. The efficient reaction of NO with NO3 means that low mixing ratios of NO can contribute to NO3 reactivity, and we calculate that ≈5 pptv NO would approximately align the calculated NO3 mixing ratio with that measured for much of the night. This value is, however, below the detection limit of the CLD (11 pptv) used to measure NO and we cannot conclude that NO at such levels was responsible for the reduction in NO3 levels required to bring observations and steady-state calculations into agreement.
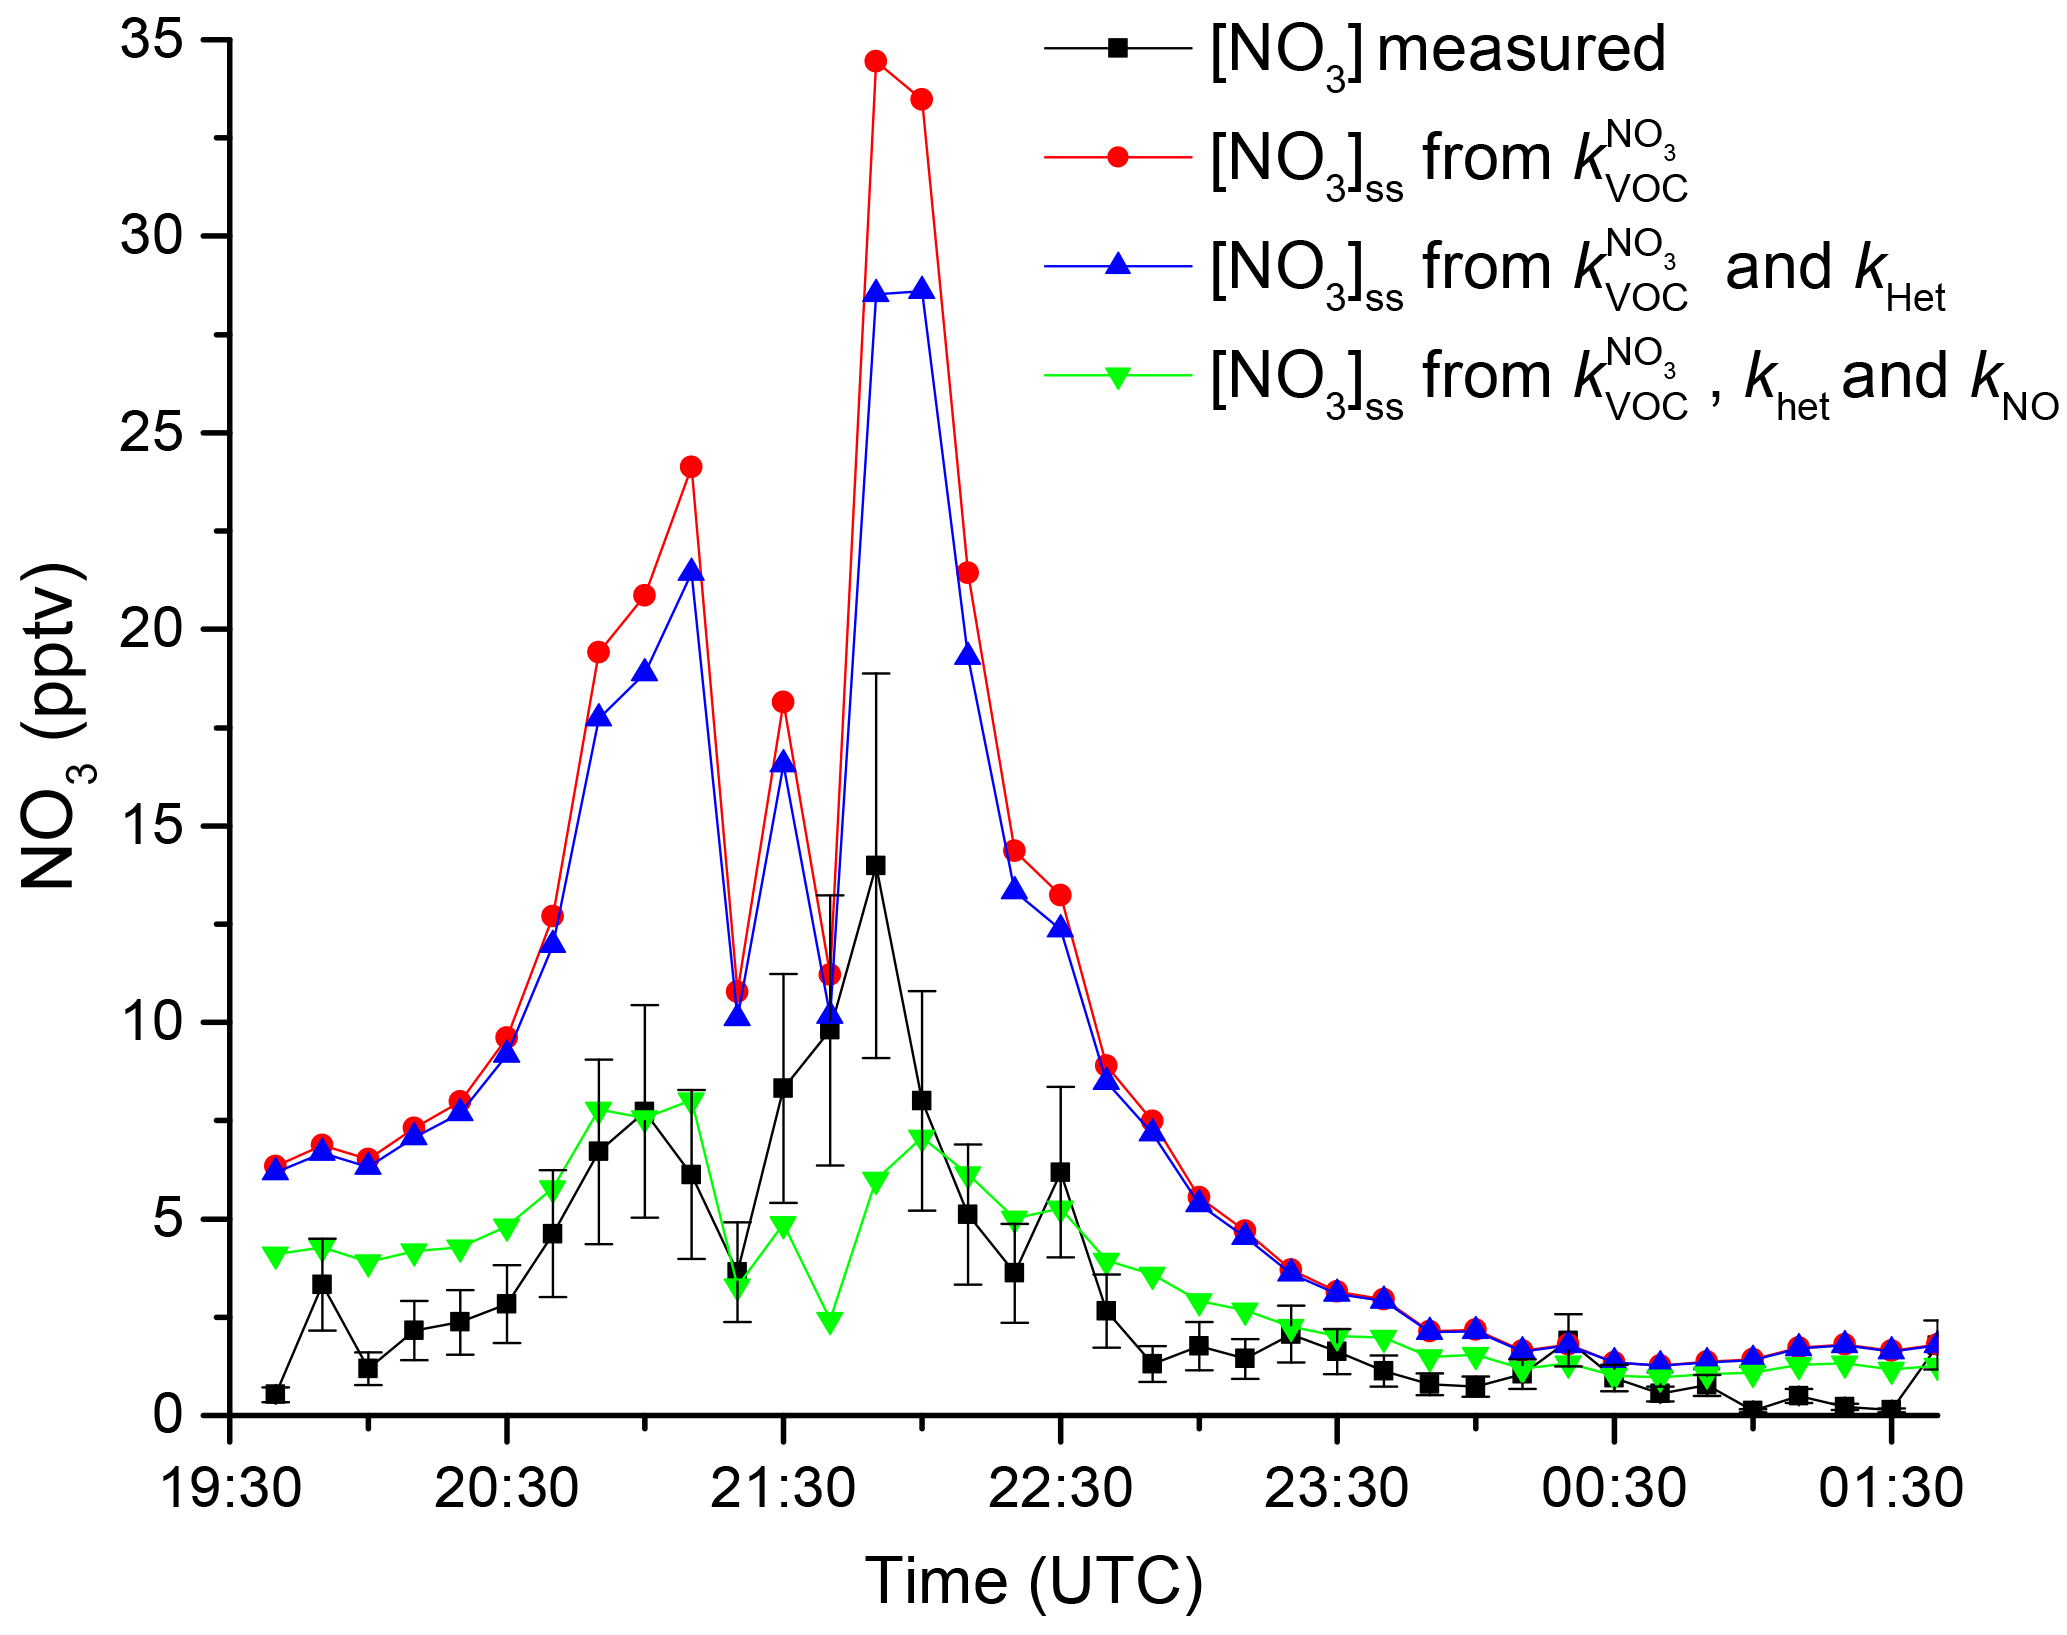
Figure 7Comparison of measured NO3 mixing ratio (black) with calculated stationary-state mixing ratios using (red), (blue), and , (green).
The discussion above demonstrates that the calculation of NO3 reactivity from stationary-state calculations can be precarious and subject to large cumulative uncertainty from e.g. measurement uncertainty in NO3 mixing ratios, uptake coefficients, aerosol surface area, and NO mixing ratios close to instrumental detection limits.
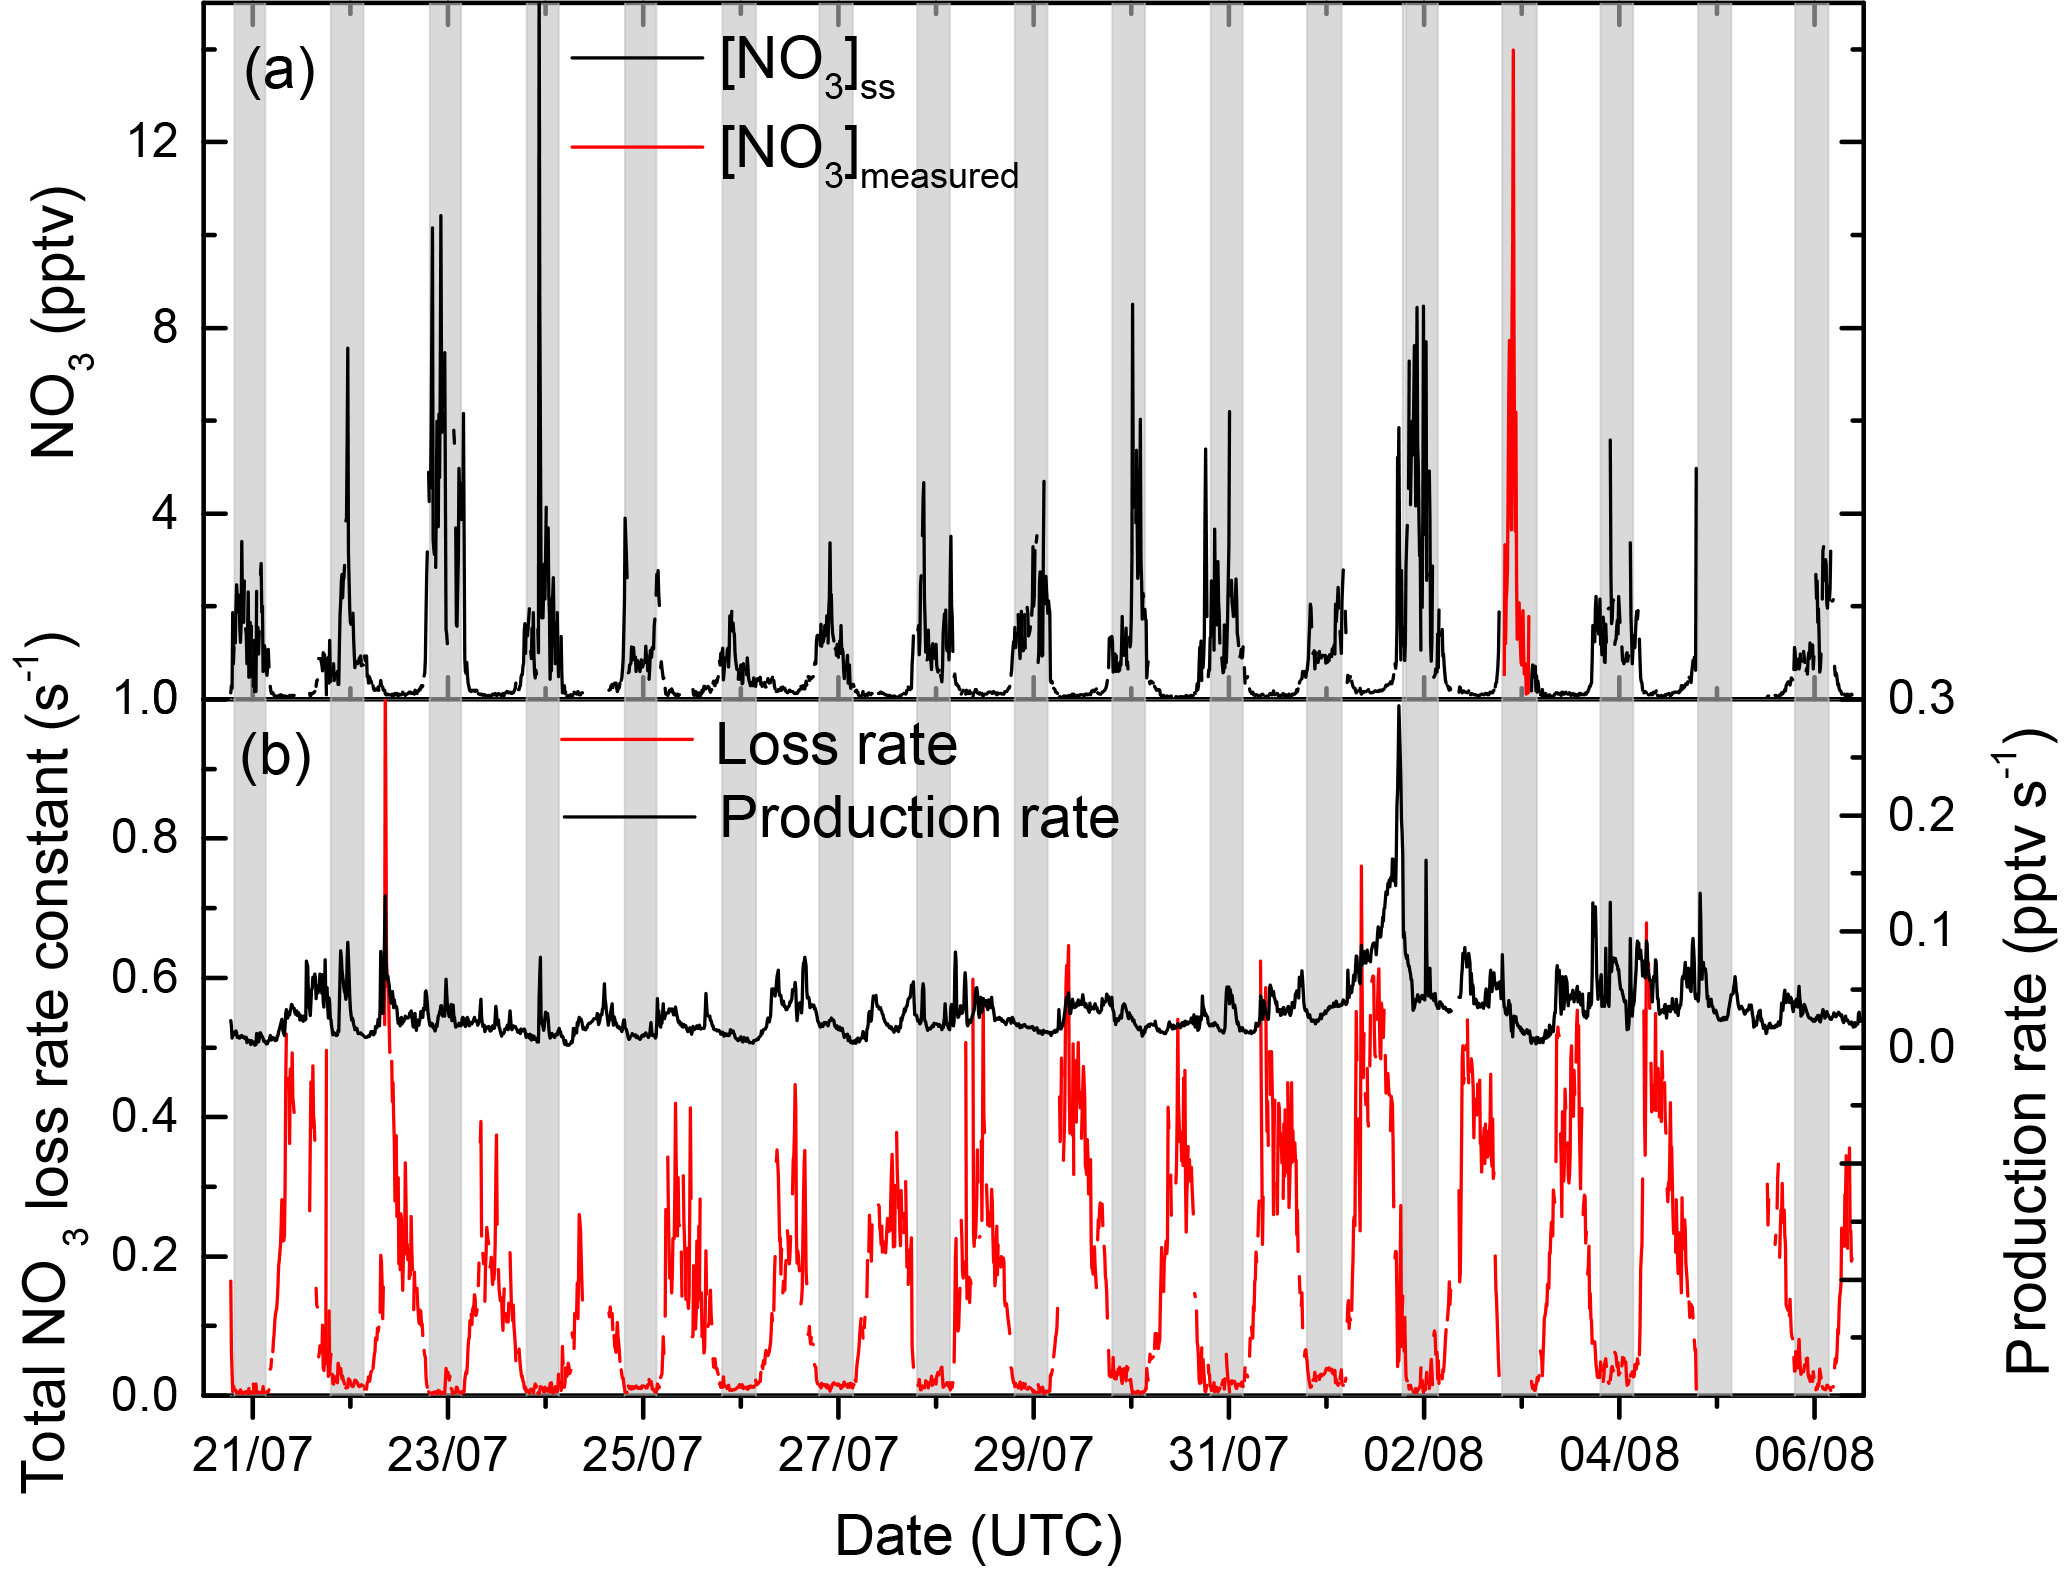
Figure 8(a) Stationary-state NO3 mixing ratios calculated using , [NO]k3, K5[NO2]fhet, and for the entire campaign and comparison with the measured NO3 mixing ratios (3 August). Panel (b) plots the time series of production and loss rates used for the calculation of [NO3]ss.
To assess the NO3 mixing ratios for the rest of the intensive, Eq. (6) can be augmented by adding the loss rate constant for NO3 photolysis and substituting for .
In the absence of a direct measurement of , the diel cycle of the relative NO3-to-NO2 photolysis rate constant () was calculated using the TUV (tropospheric ultraviolet and visible radiation) model (https://www2.acom.ucar.edu/modeling/tropospheric-ultraviolet-and-visible-tuv-radiation-model, last access: March 2018) and then put on an absolute basis using measured values.
Figure 8 shows the NO3 production rate (panel b, black curve) and total loss rate (panel b, red curve) as well as the stationary-state NO3 mixing ratios for the entire intensive period (Fig. 8a, black curve). During nights on which the reactivity fell below the detection limit of the instrument was set to 0.005 s−1. Calculated NO3 mixing ratios were in the sub-pptv range during daytime and around 1–15 pptv during night-time. The NO3 mixing ratios thus derived are comparable to those measured on a single night (Fig. 8, red curve) and are broadly consistent with previous estimates for this site (Handisides et al., 2003; Bartenbach et al., 2007).
3.4 Contribution of NO3 reactivity to NOx loss
At night-time, in the absence of NO and sunlight, each NO3 radical formed in the reaction of NO2 with O3 will either be removed indirectly via the uptake of N2O5 onto particles or will react with a biogenic hydrocarbon. The latter results in the formation of an organic nitrate at a yield of between 20 and 100 %, depending on the specific VOC (Ng et al., 2017) and hence the removal of NOx. The large daytime values for obtained in this study suggest that even during sunlight hours (when NO3 is generally considered to be of little importance owing to its rapid photolysis) significant amounts of NO3 form organic nitrates rather than reforming NO2 by reaction with NO or photolysis.
The fraction, f, of NO3 that will react with organic trace gases is given by
where the denominator sums all loss processes for NO3. Mixing ratios of NO below the 11 pptv detection limit were set to zero. Figure 9 illustrates this via a diel cycle of the median for f. At night-time, ≈99 % of the NO3 will be lost to reaction with BVOCs, with indirect heterogeneous losses representing the remaining 1 %. Note that the presence of NO at 5–10 pptv levels during the night would significantly reduce this value (see Sect. 3.3).
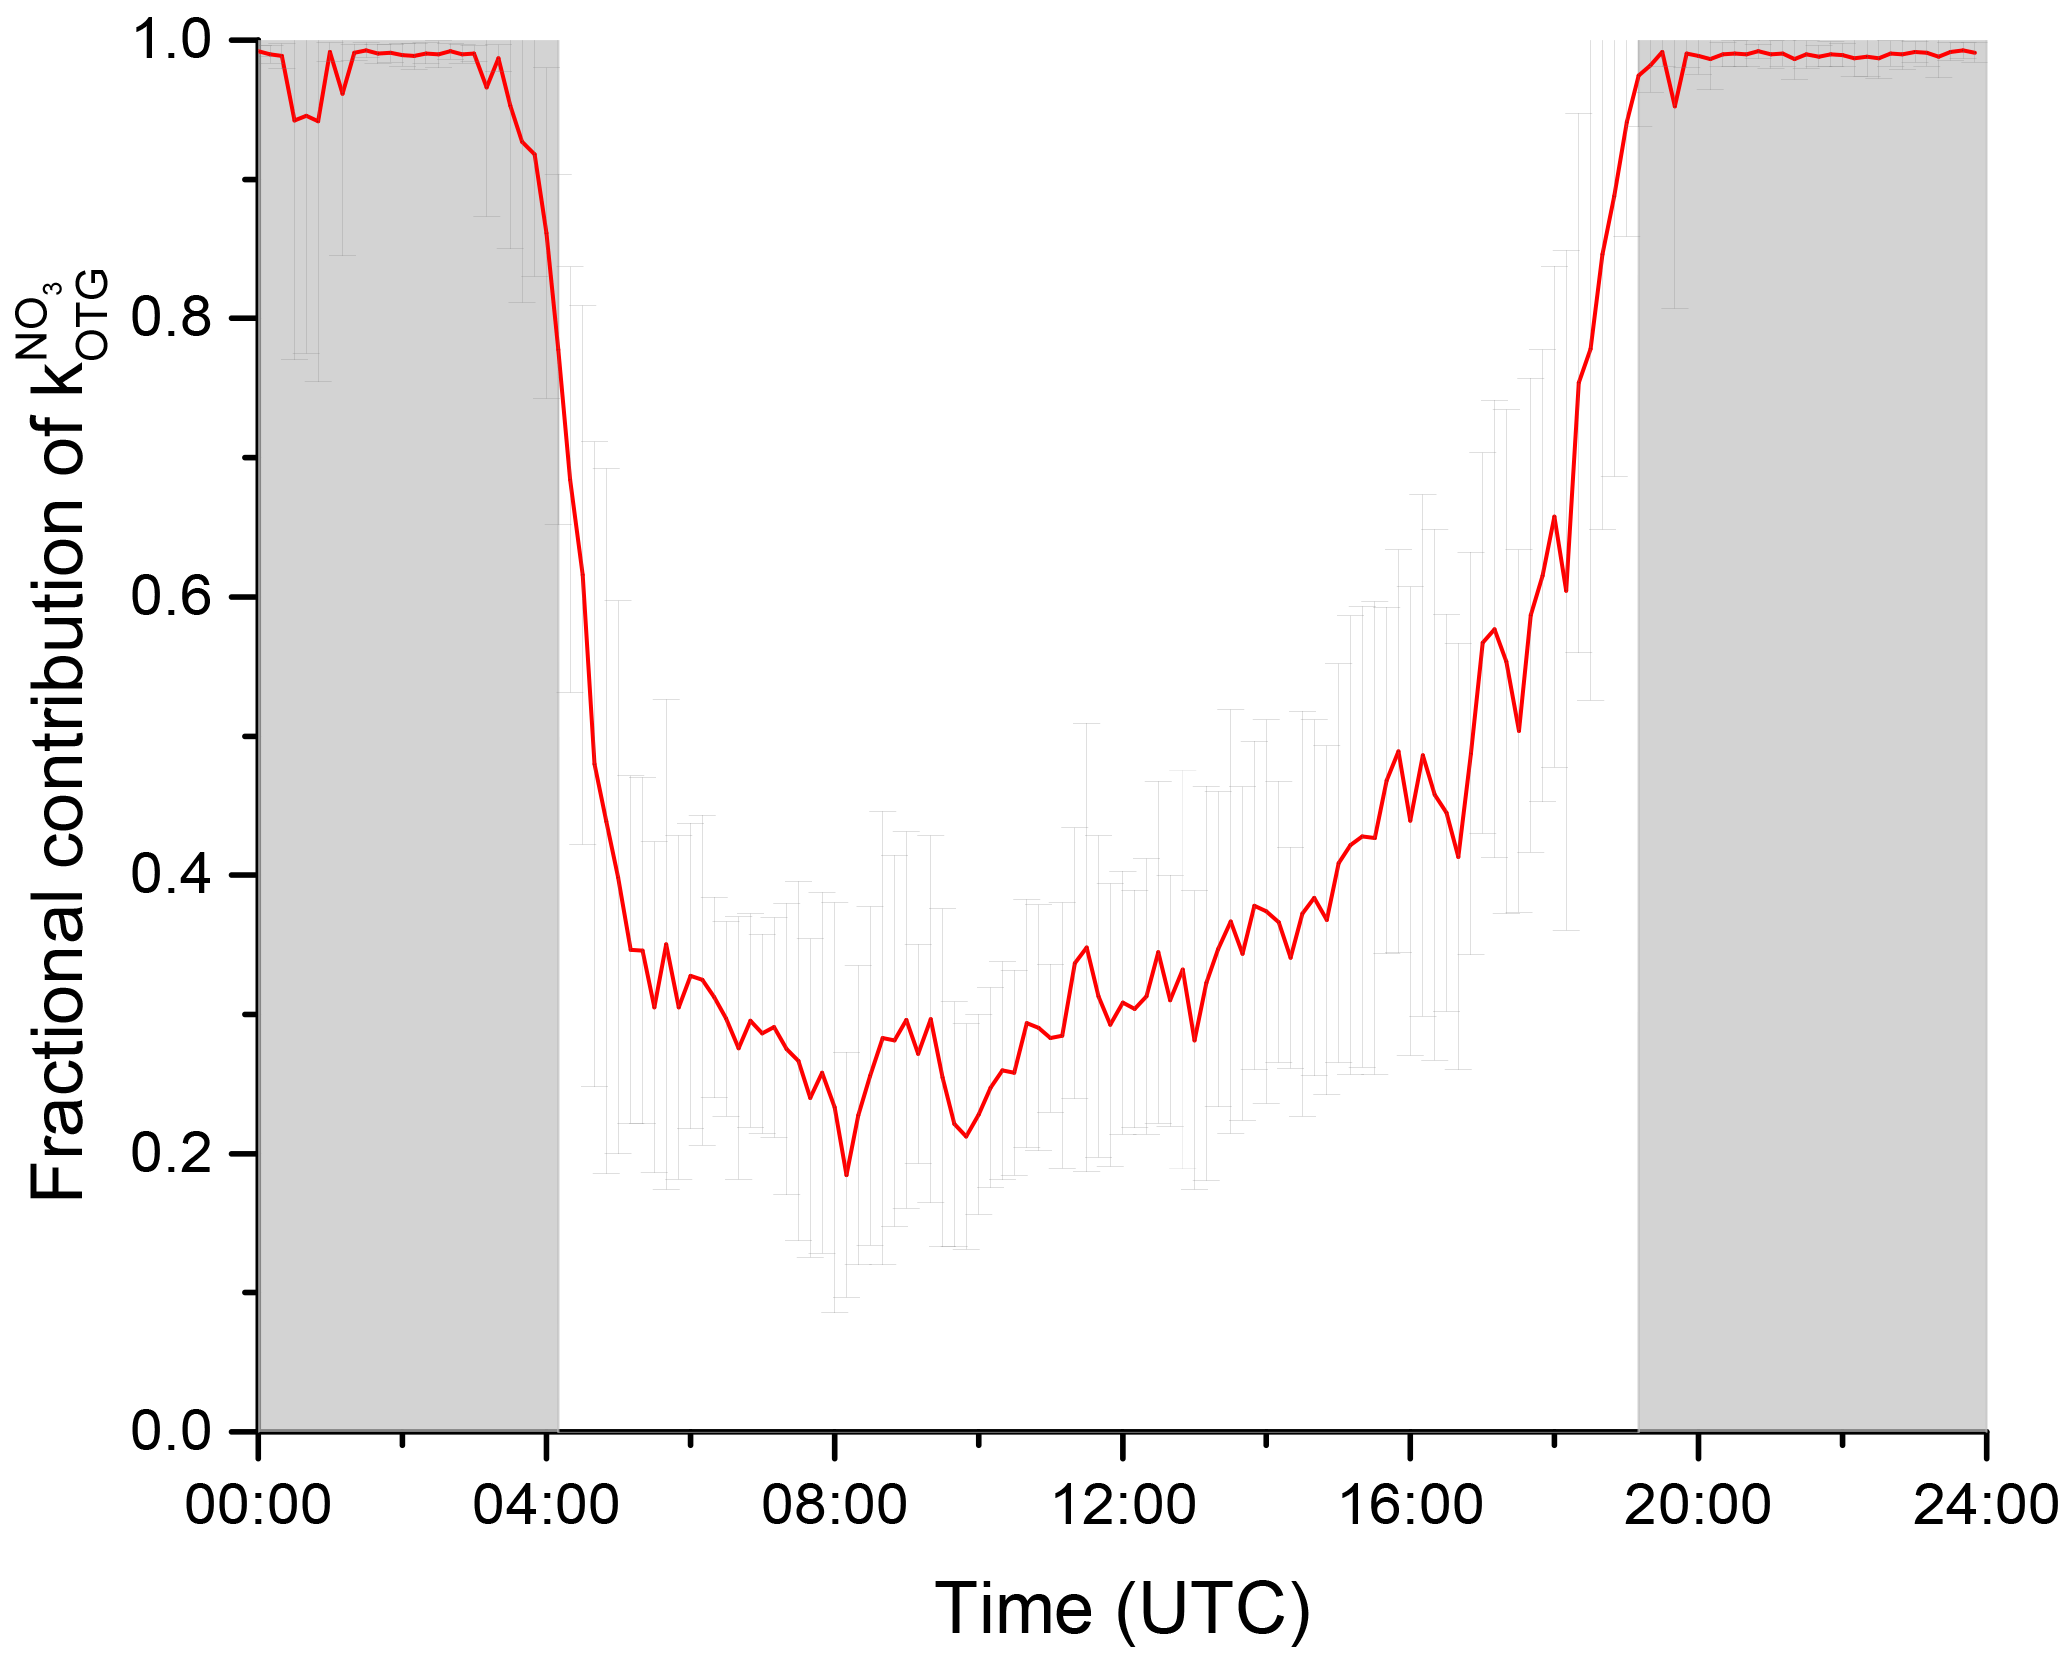
Figure 9The fraction, f, of the total NO3 loss with organic trace gases as a campaign mean diel cycle where . The error bars reflect variability only and do not consider systematic uncertainty.
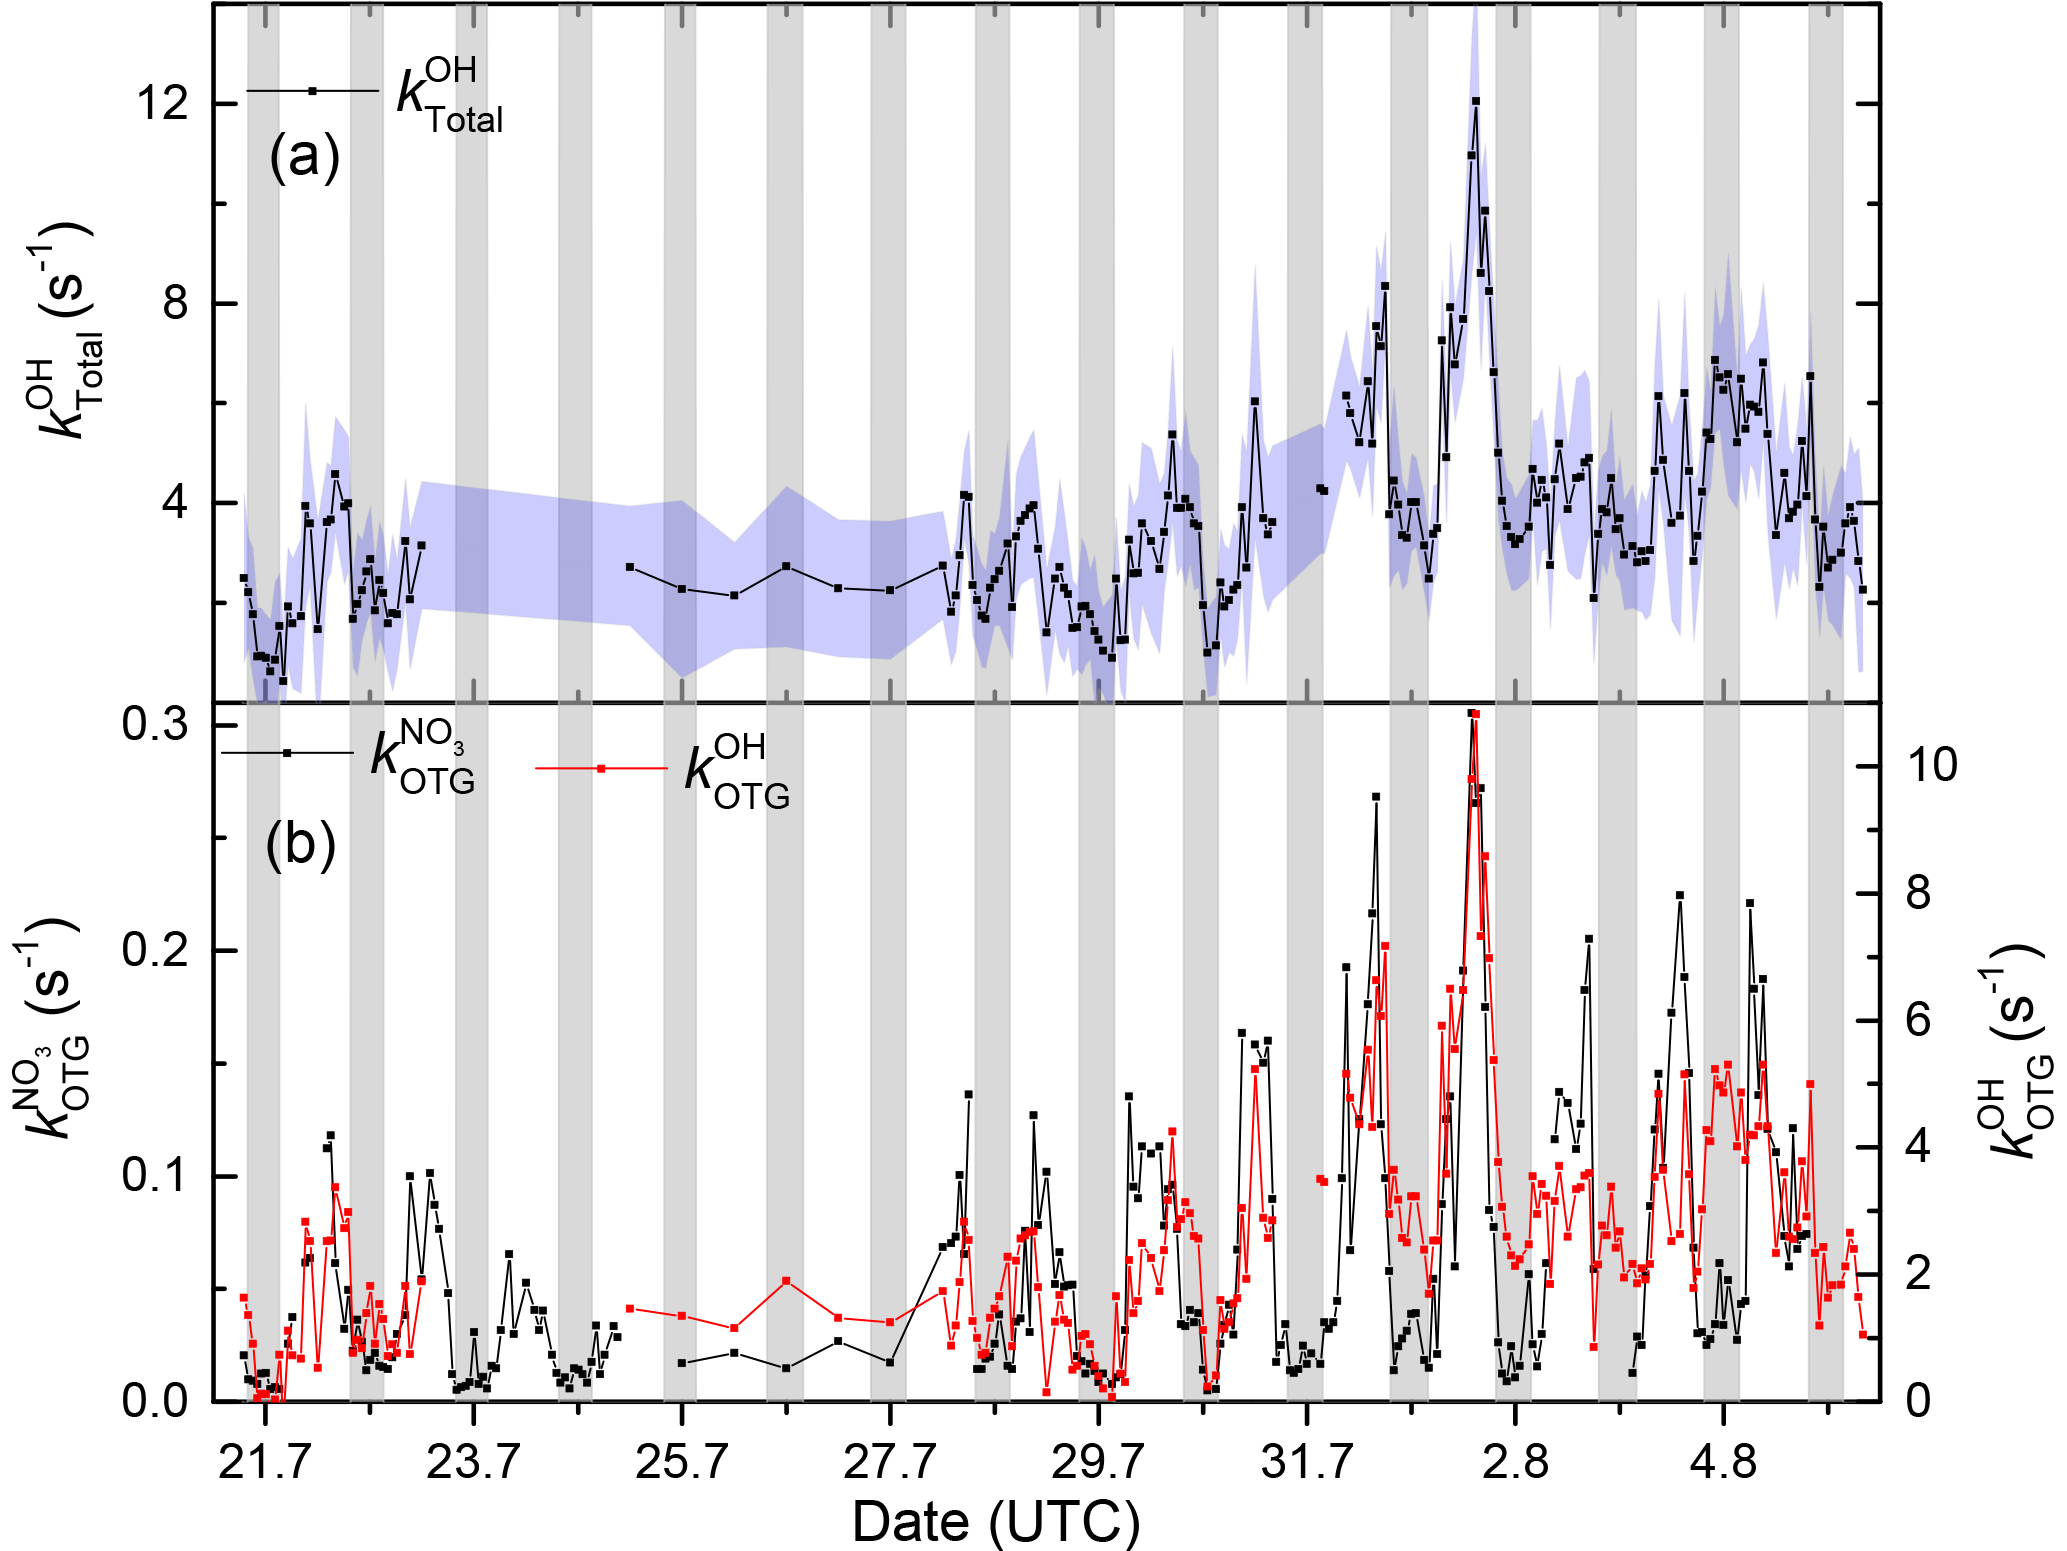
Figure 10(a) Time series of (shaded region is 1σ uncertainty). (b) Time series of and . The data are plotted so that the curves overlap at the peak reactivity (1 August).
During daytime, at the peak of the actinic flux (max s−1) and correspondingly high levels of NO (kNO=0.1–0.2 s−1), 20 % of the formed NO3 was lost due to reaction with organic trace gases, increasing up to 40 % in the late afternoon. This result is comparable with reactivity measurements in a boreal forest in Finland during IBAIRN 2016 in which a very similar diel profile for f was determined (Liebmann et al., 2018). The NO3 reactivity data from these measurements indicate that the role of NO3 as a daytime oxidant of biogenic VOCs in forested regions may so far have been underestimated, which in turn has implications for understanding the diel cycle of organic nitrate and secondary organic aerosol formation in such environments.
As mentioned above NO3 radicals and OH radicals react with atmospheric trace gases via different mechanisms, resulting in profoundly different rate coefficients and thus reactivities. By combining continuous, on-site measurements of OH reactivity with the NO3 reactivity measurements during the intensive period, we were able to generate the first dataset of the simultaneous, direct measurement of OH reactivity, , and NO3 reactivity at any location.
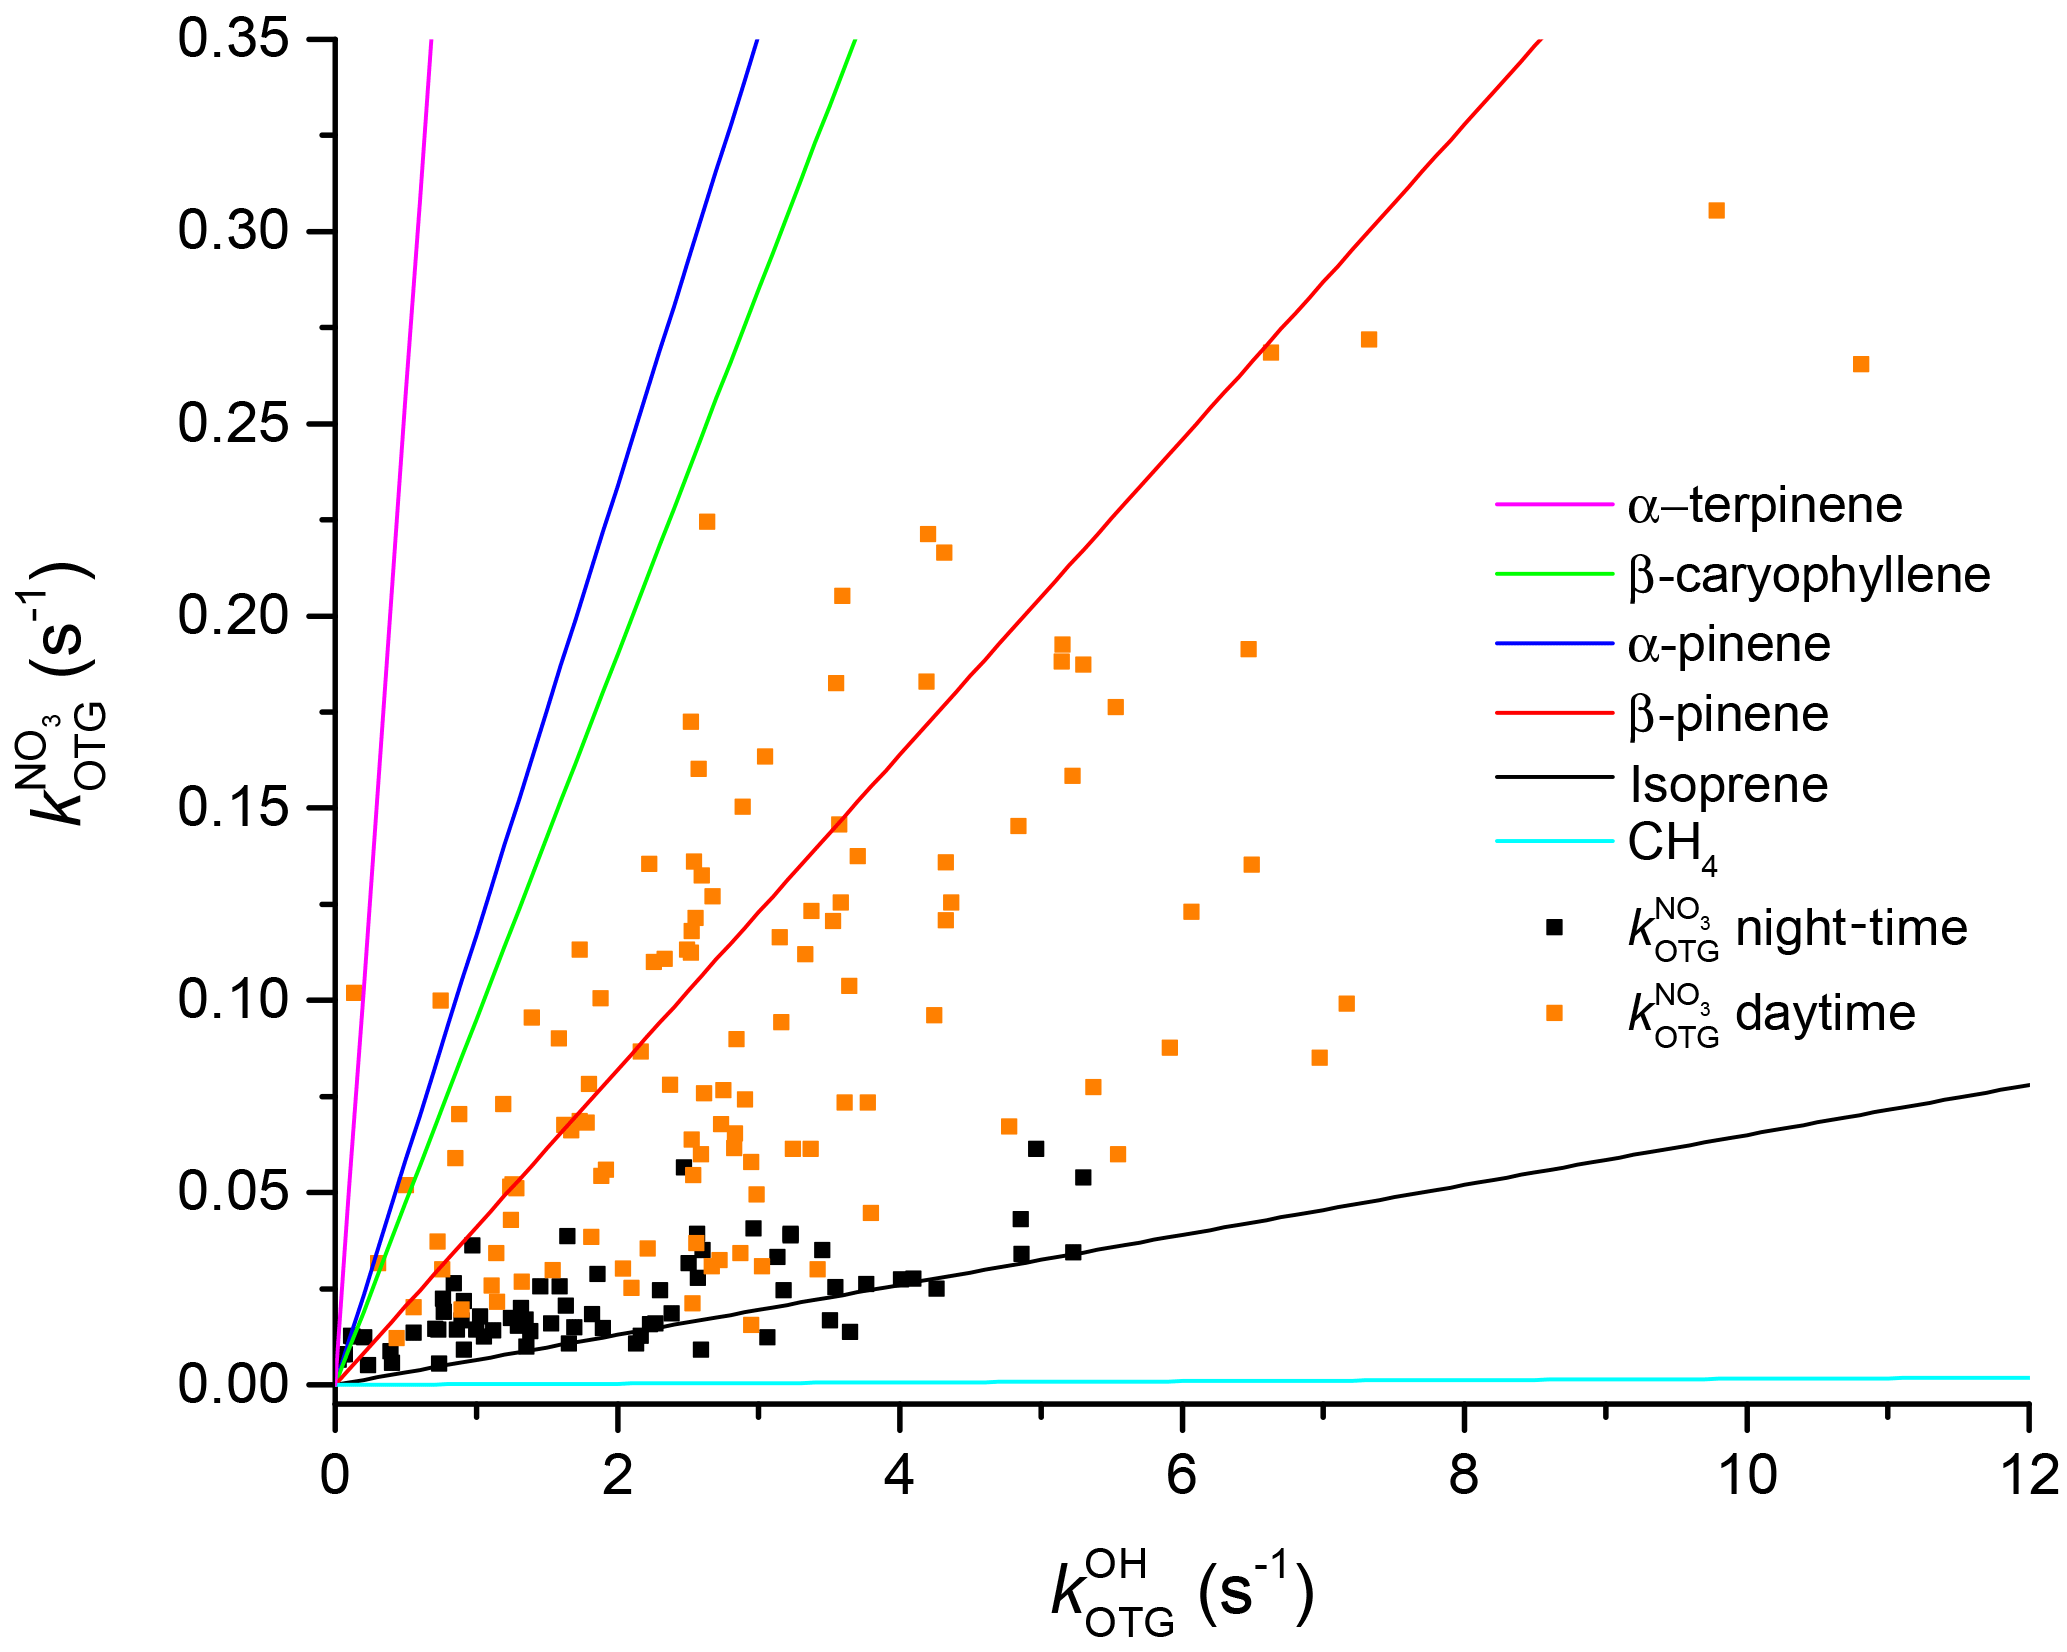
Figure 11Correlation between OH reactivity and NO3 reactivity. The coloured lines are relative NO3 and OH reactivity for single VOCs. The measured NO3 and OH reactivities are depicted as black (night-time) and orange data points (daytime).
To aid comparison, we subtracted the contributions of several inorganic and organic trace gases (NO, NO2, SO2, CO, CH4) that are not included in or do not react to a significant extent with NO3 from the total OH reactivity and thus derived .
Figure 10 depicts the time series of , , and . All display maximum values close to midday, though values averaged over the intensive are larger by a factor of 44 than , reflecting generally larger rate coefficients for OH. The blue shaded areas for represent the 1σ uncertainty of the measurements. Total uncertainty in and is not shown to preserve clarity of presentation. The time series of can be found in the Supplement (Fig. S6) where it is compared to that calculated from individual VOCs at the corresponding rate coefficient, . As is often the case for OH, there are periods in which the calculated reactivity significantly underestimates (up to a factor of ≈4) the measured values. A detailed comparison of measured and calculated OH reactivity at this location and including data over a much longer time period will be the subject of future publications.
The measured reactivities of both radicals show a clear diel profile, with higher daytime and lower night-time values. Figure 11 shows a correlation plot of OH and NO3 reactivity divided into day (red) and night-time (black) data. During the day, the data are highly scattered, which can be understood when one considers the highly variable organic content of the air masses being sampled. To illustrate this, we have drawn the expected correlation lines (based on the known relative rate coefficients) for single-component organic trace gases including isoprene and terpenes. The expected slopes for these individual VOCs are very different and encompass the full scatter in the observations, which is the result of changing atmospheric composition (i.e. the mix of reactive organic species) owing to changes in air mass age and source region (wind direction) during the campaign. The extremes are represented by α-terpinene (which favours NO3) and CH4 (which favours OH).
During night-time (black points) the plot of versus is less scattered, indicating that the air masses sampled (often from the residual layer) are chemically less complex and variable. The data lay close to the line that marks the expected correlation if isoprene were the dominant sink of both NO3 and OH at night-time once molecules such as CO and CH4 have been removed from the term describing OH reactivity. This is in broad agreement with our observation that isoprene is the main sink of NO3 during nights when the measurement site was decoupled from direct boundary layer emissions.
Direct measurements of the NO3 reactivity towards organic trace gases, , were conducted at the top of the Hohenpeissenberg (988 m a.s.l.) during an intensive measurement campaign in the summer of 2017. NO3 reactivities had a distinct diel profile with values as large as 0.3 s−1 during daytime but close to or below the detection limit of the instrument during night-time when the measurement site was frequently in the residual layer and free troposphere. Within experimental uncertainty, the high daytime NO3 reactivity was accounted for by BVOCs that were measured at the site and was dominated by monoterpenes, especially α-pinene and sabinene. On average, and assuming NO levels below the 11 ppt detection limit to be zero, the reaction with VOCs accounted for ≈99 % of the loss of NO3 during night-time and an average of 20 % at noon, increasing to 30 %–50 % during early morning and late evening. The reaction of NO3 with BVOCS therefore represents a significant NOx loss not only during the night but also during daytime and implies significant formation of organic nitrates via NO3 reactions throughout the diel cycle. Stationary-state daytime and night-time NO3 mixing ratios were calculated using the production term and and were broadly consistent with direct measurement made on one night. A comparison between directly measured OH and NO3 reactivities was performed, indicating a weak correlation during the day when chemically reactive, complex, and variable air masses were encountered. A tighter correlation, consistent with isoprene dominating the (low) NO3 reactivities, was observed at night.
The MOHp intensive data will be released at the end of 2020 when they can be obtained from the owners by request (via John Crowley).
The supplement related to this article is available online at: https://doi.org/10.5194/acp-18-12045-2018-supplement.
JML, DK, CPD, JL, and JNC designed and planned the intensive campaign. JML, JBAM, AC, and RH took and analysed data. JML and JNC analysed data and wrote the paper.
The authors declare that they have no conflict of interest.
We would like to thank the DWD for hosting and supporting this measurement
campaign. We would like to thank the DWD personnel for the data evaluation,
most notably Katja Michl for NMHCs, Jennifer Englert for OVOCs, and
Harald Flentje for the SMPS data as well as the great technical support; we
are particularly grateful to Erasmus Tensing, Thomas Elste, and Georg Stange.
We thank Chemours for provision of the FEP sample used to coat the
CRD cavities.
The article processing charges
for this open-access
publication were covered by the Max
Planck Society.
Edited by: James
Roberts
Reviewed by: two anonymous referees
Aliwell, S. R. and Jones, R. L.: Measurements of tropospheric NO3 at midlatitude, J. Geophys. Res.-Atmos., 103, 5719–5727, 1998.
Allan, B. J., Plane, J. M. C., Coe, H., and Shillito, J.: Observations of NO3 concentration profiles in the troposphere, J. Geophys. Res.-Atmos., 107, 4588, https://doi.org/10.1029/2002jd002112, 2002.
Atkinson, R.: Atmospheric chemistry of VOCs and NOx, Atmos. Environ., 34, 2063–2101, 2000.
Atkinson, R. and Arey, J.: Gas-phase tropospheric chemistry of biogenic volatile organic compounds: a review, Atmos. Environ., 37, S197–S219, 2003a.
Atkinson, R. and Arey, J.: Atmospheric degradation of volatile organic compounds, Chem. Rev., 103, 4605–4638, https://doi.org/10.1021/cr0206420, 2003b.
Bannan, T. J., Booth, A. M., Bacak, A., Muller, J. B. A., Leather, K. E., Le Breton, M., Jones, B., Young, D., Coe, H., Allan, J., Visser, S., Slowik, J. G., Furger, M., Prevot, A. S. H., Lee, J., Dunmore, R. E., Hopkins, J. R., Hamilton, J. F., Lewis, A. C., Whalley, L. K., Sharp, T., Stone, D., Heard, D. E., Fleming, Z. L., Leigh, R., Shallcross, D. E., and Percival, C. J.: The first UK measurements of nitryl chloride using a chemical ionization mass spectrometer in central London in the summer of 2012, and an investigation of the role of Cl atom oxidation, J. Geophys. Res.-Atmos., 120, 5638–5657, https://doi.org/10.1002/2014jd022629, 2015.
Bartenbach, S., Williams, J., Plass-Dülmer, C., Berresheim, H., and Lelieveld, J.: In-situ measurement of reactive hydrocarbons at Hohenpeissenberg with comprehensive two-dimensional gas chromatography (GC × GC-FID): use in estimating HO and NO3, Atmos. Chem. Phys., 7, 1–14, https://doi.org/10.5194/acp-7-1-2007, 2007.
Bastin, J.-F., Berrahmouni, N., Grainger, A., Maniatis, D., Mollicone, D., Moore, R., Patriarca, C., Picard, N., Sparrow, B., Abraham, E. M., Aloui, K., Atesoglu, A., Attore, F., Bassüllü, Ç., Bey, A., Garzuglia, M., García-Montero, L. G., Groot, N., Guerin, G., Laestadius, L., Lowe, A. J., Mamane, B., Marchi, G., Patterson, P., Rezende, M., Ricci, S., Salcedo, I., Diaz, A. S.-P., Stolle, F., Surappaeva, V., and Castro, R.: The extent of forest in dryland biomes, Science, 356, 635–638, https://doi.org/10.1126/science.aam6527, 2017.
Berresheim, H., Elste, T., Plass-Dülmer, C., Eiseleb, F. L., and Tannerb, D. J.: Chemical ionization mass spectrometer for long-term measurements of atmospheric OH and H2SO4, Int. J. Mass Spectrom., 202, 91–109, https://doi.org/10.1016/S1387-3806(00)00233-5, 2000.
Bertram, T. H. and Thornton, J. A.: Toward a general parameterization of N2O5 reactivity on aqueous particles: the competing effects of particle liquid water, nitrate and chloride, Atmos. Chem. Phys., 9, 8351–8363, https://doi.org/10.5194/acp-9-8351-2009, 2009.
Bertram, T. H., Thornton, J. A., Riedel, T. P., Middlebrook, A. M., Bahreini, R., Bates, T. S., Quinn, P. K., and Coffman, D. J.: Direct observations of N2O5 reactivity on ambient aerosol particles, Geophys. Res. Lett., 36, L19803, https://doi.org/10.1029/2009GL040248, 2009.
Birmili, W., Berresheim, H., Plass-Dülmer, C., Elste, T., Gilge, S., Wiedensohler, A., and Uhrner, U.: The Hohenpeissenberg aerosol formation experiment (HAFEX): a long-term study including size-resolved aerosol, H2SO4, OH, and monoterpenes measurements, Atmos. Chem. Phys., 3, 361–376, https://doi.org/10.5194/acp-3-361-2003, 2003.
Birmili, W., Weinhold, K., Rasch, F., Sonntag, A., Sun, J., Merkel, M., Wiedensohler, A., Bastian, S., Schladitz, A., Löschau, G., Cyrys, J., Pitz, M., Gu, J., Kusch, T., Flentje, H., Quass, U., Kaminski, H., Kuhlbusch, T. A. J., Meinhardt, F., Schwerin, A., Bath, O., Ries, L., Gerwig, H., Wirtz, K., and Fiebig, M.: Long-term observations of tropospheric particle number size distributions and equivalent black carbon mass concentrations in the German Ultrafine Aerosol Network (GUAN), Earth Syst. Sci. Data, 8, 355–382, https://doi.org/10.5194/essd-8-355-2016, 2016.
Brown, S. S. and Stutz, J.: Nighttime radical observations and chemistry, Chem. Soc. Rev., 41, 6405–6447, 2012.
Brown, S. S., Stark, H., and Ravishankara, A. R.: Applicability of the steady state approximation to the interpretation of atmospheric observations of NO3 and N2O5, J. Geophys. Res.-Atmos., 108, 4539, https://doi.org/10.1029/2003JD003407, 2003a.
Brown, S. S., Stark, H., Ryerson, T. B., Williams, E. J., Nicks, D. K., Trainer, M., Fehsenfeld, F. C., and Ravishankara, A. R.: Nitrogen oxides in the nocturnal boundary layer: Simultaneous in situ measurements of NO3, N2O5, NO2, NO, and O3, J. Geophys. Res.-Atmos., 108, 4299, https://doi.org/10.1029/2002JD002917, 2003b.
Brown, S. S., Dube, W. P., Osthoff, H. D., Stutz, J., Ryerson, T. B., Wollny, A. G., Brock, C. A., Warneke, C., De Gouw, J. A., Atlas, E., Neuman, J. A., Holloway, J. S., Lerner, B. M., Williams, E. J., Kuster, W. C., Goldan, P. D., Angevine, W. M., Trainer, M., Fehsenfeld, F. C., and Ravishankara, A. R.: Vertical profiles in NO3 and N2O5 measured from an aircraft: Results from the NOAA P-3 and surface platforms during the New England Air Quality Study 2004, J. Geophys. Res.-Atmos., 112, D22304, https://doi.org/10.1029/2007jd008893, 2007a.
Brown, S. S., Dubé, W. P., Osthoff, H. D., Wolfe, D. E., Angevine, W. M., and Ravishankara, A. R.: High resolution vertical distributions of NO3 and N2O5 through the nocturnal boundary layer, Atmos. Chem. Phys., 7, 139–149, https://doi.org/10.5194/acp-7-139-2007, 2007b.
Brown, S. S., Dube, W. P., Fuchs, H., Ryerson, T. B., Wollny, A. G., Brock, C. A., Bahreini, R., Middlebrook, A. M., Neuman, J. A., Atlas, E., Roberts, J. M., Osthoff, H. D., Trainer, M., Fehsenfeld, F. C., and Ravishankara, A. R.: Reactive uptake coefficients for N2O5 determined from aircraft measurements during the Second Texas Air Quality Study: Comparison to current model parameterizations, J. Geophys. Res.-Atmos., 114, D00F10, https://doi.org/10.1029/2008JD011679, 2009.
Brown, S. S., Dube, W. P., Peischl, J., Ryerson, T. B., Atlas, E., Warneke, C., de Gouw, J. A., Hekkert, S. t. L., Brock, C. A., Flocke, F., Trainer, M., Parrish, D. D., Feshenfeld, F. C., and Ravishankara, A. R.: Budgets for nocturnal VOC oxidation by nitrate radicals aloft during the 2006 Texas Air Quality Study, J. Geophys. Res.-Atmos., 116, D24305, https://doi.org/10.1029/2011jd016544, 2011.
Brown, S. S., Dube, W. P., Tham, Y. J., Zha, Q., Xue, L., Poon, S., Wang, Z., Blake, D. R., Tsui, W., Parrish, D. D., and Wang, T.: Nighttime chemistry at a high altitude site above Hong Kong, J. Geophys. Res.-Atmos., 121, 2457–2475, https://doi.org/10.1002/2015jd024566, 2016.
Crowley, J. N., Schuster, G., Pouvesle, N., Parchatka, U., Fischer, H., Bonn, B., Bingemer, H., and Lelieveld, J.: Nocturnal nitrogen oxides at a rural mountain-site in south-western Germany, Atmos. Chem. Phys., 10, 2795–2812, https://doi.org/10.5194/acp-10-2795-2010, 2010.
Crowley, J. N., Thieser, J., Tang, M. J., Schuster, G., Bozem, H., Beygi, Z. H., Fischer, H., Diesch, J.-M., Drewnick, F., Borrmann, S., Song, W., Yassaa, N., Williams, J., Pöhler, D., Platt, U., and Lelieveld, J.: Variable lifetimes and loss mechanisms for NO3 and N2O5 during the DOMINO campaign: contrasts between marine, urban and continental air, Atmos. Chem. Phys., 11, 10853–10870, https://doi.org/10.5194/acp-11-10853-2011, 2011.
Dentener, F. J. and Crutzen, P. J.: Reaction of N2O5 on tropospheric aerosols – Impact on the global distributions of NOx, O3, and OH, J. Geophys. Res.-Atmos., 98, 7149–7163, 1993.
Fry, J. L., Draper, D. C., Barsanti, K. C., Smith, J. N., Ortega, J., Winkle, P. M., Lawler, M. J., Brown, S. S., Edwards, P. M., Cohen, R. C., and Lee, L.: Secondary Organic Aerosol Formation and Organic Nitrate Yield from NO3 Oxidation of Biogenic Hydrocarbons, Environ. Sci. Technol., 48, 11944–11953, https://doi.org/10.1021/es502204x, 2014.
Geyer, A., Alicke, B., Konrad, S., Schmitz, T., Stutz, J., and Platt, U.: Chemistry and oxidation capacity of the nitrate radical in the continental boundary layer near Berlin, J. Geophys. Res.-Atmos., 106, 8013–8025, 2001.
Guenther, A. B., Jiang, X., Heald, C. L., Sakulyanontvittaya, T., Duhl, T., Emmons, L. K., and Wang, X.: The Model of Emissions of Gases and Aerosols from Nature version 2.1 (MEGAN2.1): an extended and updated framework for modeling biogenic emissions, Geosci. Model Dev., 5, 1471–1492, https://doi.org/10.5194/gmd-5-1471-2012, 2012.
Hakola, H., Tarvainen, V., Laurila, T., Hiltunen, V., Hellén, H., and Keronen, P.: Seasonal variation of VOC concentrations above a boreal coniferous forest, Atmos. Environ., 37, 1623–1634, https://doi.org/10.1016/S1352-2310(03)00014-1, 2003.
Hakola, H., Hellén, H., Hemmilä, M., Rinne, J., and Kulmala, M.: In situ measurements of volatile organic compounds in a boreal forest, Atmos. Chem. Phys., 12, 11665–11678, https://doi.org/10.5194/acp-12-11665-2012, 2012.
Handisides, G. M., Plass-Dülmer, C., Gilge, S., Bingemer, H., and Berresheim, H.: Hohenpeissenberg Photochemical Experiment (HOPE 2000): Measurements and photostationary state calculations of OH and peroxy radicals, Atmos. Chem. Phys., 3, 1565–1588, https://doi.org/10.5194/acp-3-1565-2003, 2003.
Hock, N., Schneider, J., Borrmann, S., Römpp, A., Moortgat, G., Franze, T., Schauer, C., Pöschl, U., Plass-Dülmer, C., and Berresheim, H.: Rural continental aerosol properties and processes observed during the Hohenpeissenberg Aerosol Characterization Experiment (HAZE2002), Atmos. Chem. Phys., 8, 603–623, https://doi.org/10.5194/acp-8-603-2008, 2008.
Hoerger, C. C., Claude, A., Plass-Dülmer, C., Reimann, S., Eckart, E., Steinbrecher, R., Aalto, J., Arduini, J., Bonnaire, N., Cape, J. N., Colomb, A., Connolly, R., Diskova, J., Dumitrean, P., Ehlers, C., Gros, V., Hakola, H., Hill, M., Hopkins, J. R., Jäger, J., Junek, R., Kajos, M. K., Klemp, D., Leuchner, M., Lewis, A. C., Locoge, N., Maione, M., Martin, D., Michl, K., Nemitz, E., O'Doherty, S., Pérez Ballesta, P., Ruuskanen, T. M., Sauvage, S., Schmidbauer, N., Spain, T. G., Straube, E., Vana, M., Vollmer, M. K., Wegener, R., and Wenger, A.: ACTRIS non-methane hydrocarbon intercomparison experiment in Europe to support WMO GAW and EMEP observation networks, Atmos. Meas. Tech., 8, 2715–2736, https://doi.org/10.5194/amt-8-2715-2015, 2015.
Holzke, C., Hoffmann, T., Jaeger, L., Koppmann, R., and Zimmer, W.: Diurnal and seasonal variation of monoterpene and sesquiterpene emissions from Scots pine (Pinus sylvestris L.), Atmos. Environ., 40, 3174–3185, https://doi.org/10.1016/j.atmosenv.2006.01.039, 2006.
IUPAC: Task Group on Atmospheric Chemical Kinetic Data Evaluation (Ammann, M., Cox, R. A., Crowley, J. N., Herrmann, H., Jenkin, M. E., McNeill, V. F., Mellouki, A., Rossi, M. J., Troe, J., and Wallington, T. J.), available at: http://iupac.pole-ether.fr/index.html (last access: March 2018), 2018.
Jaoui, M., Kleindienst, T. E., Docherty, K. S., Lewandowski, M., and Offenberg, J. H.: Secondary organic aerosol formation from the oxidation of a series of sesquiterpenes: alpha-cedrene, beta-caryophyllene, alpha-humulene and alpha-farnesene with O3, OH and NO3 radicals, Environ. Chem., 10, 178–193, https://doi.org/10.1071/en13025, 2013.
Lee, A. K. Y., Abbatt, J. P. D., Leaitch, W. R., Li, S.-M., Sjostedt, S. J., Wentzell, J. J. B., Liggio, J., and Macdonald, A. M.: Substantial secondary organic aerosol formation in a coniferous forest: observations of both day- and nighttime chemistry, Atmos. Chem. Phys., 16, 6721–6733, https://doi.org/10.5194/acp-16-6721-2016, 2016.
Lelieveld, J., Dentener, F. J., Peters, W., and Krol, M. C.: On the role of hydroxyl radicals in the self-cleansing capacity of the troposphere, Atmos. Chem. Phys., 4, 2337–2344, https://doi.org/10.5194/acp-4-2337-2004, 2004.
Lelieveld, J., Butler, T. M., Crowley, J. N., Dillon, T. J., Fischer, H., Ganzeveld, L., Harder, H., Lawrence, M. G., Martinez, M., Taraborrelli, D., and Williams, J.: Atmospheric oxidation capacity sustained by a tropical forest, Nature, 452, 737–740, 2008.
Lelieveld, J., Gromov, S., Pozzer, A., and Taraborrelli, D.: Global tropospheric hydroxyl distribution, budget and reactivity, Atmos. Chem. Phys., 16, 12477–12493, https://doi.org/10.5194/acp-16-12477-2016, 2016.
Liebmann, J. M., Schuster, G., Schuladen, J. B., Sobanski, N., Lelieveld, J., and Crowley, J. N.: Measurement of ambient NO3 reactivity: design, characterization and first deployment of a new instrument, Atmos. Meas. Tech., 10, 1241–1258, https://doi.org/10.5194/amt-10-1241-2017, 2017.
Liebmann, J., Karu, E., Sobanski, N., Schuladen, J., Ehn, M., Schallhart, S., Quéléver, L., Hellen, H., Hakola, H., Hoffmann, T., Williams, J., Fischer, H., Lelieveld, J., and Crowley, J. N.: Direct measurement of NO3 radical reactivity in a boreal forest, Atmos. Chem. Phys., 18, 3799–3815, https://doi.org/10.5194/acp-18-3799-2018, 2018.
Mannschreck, K., Gilge, S., Plass-Dülmer, C., Fricke, W., and Berresheim, H.: Assessment of the applicability of NO-NO2-O3 photostationary state to long-term measurements at the Hohenpeissenberg GAW Station, Germany, Atmos. Chem. Phys., 4, 1265–1277, https://doi.org/10.5194/acp-4-1265-2004, 2004.
Martinez, M., Perner, D., Hackenthal, E. M., Kulzer, S., and Schutz, L.: NO3 at Helgoland during the NORDEX campaign in October 1996, J. Geophys. Res.-Atmos., 105, 22685–22695, 2000.
Ng, N. L., Brown, S. S., Archibald, A. T., Atlas, E., Cohen, R. C., Crowley, J. N., Day, D. A., Donahue, N. M., Fry, J. L., Fuchs, H., Griffin, R. J., Guzman, M. I., Herrmann, H., Hodzic, A., Iinuma, Y., Jimenez, J. L., Kiendler-Scharr, A., Lee, B. H., Luecken, D. J., Mao, J., McLaren, R., Mutzel, A., Osthoff, H. D., Ouyang, B., Picquet-Varrault, B., Platt, U., Pye, H. O. T., Rudich, Y., Schwantes, R. H., Shiraiwa, M., Stutz, J., Thornton, J. A., Tilgner, A., Williams, B. J., and Zaveri, R. A.: Nitrate radicals and biogenic volatile organic compounds: oxidation, mechanisms, and organic aerosol, Atmos. Chem. Phys., 17, 2103–2162, https://doi.org/10.5194/acp-17-2103-2017, 2017.
Nölscher, A. C., Williams, J., Sinha, V., Custer, T., Song, W., Johnson, A. M., Axinte, R., Bozem, H., Fischer, H., Pouvesle, N., Phillips, G., Crowley, J. N., Rantala, P., Rinne, J., Kulmala, M., Gonzales, D., Valverde-Canossa, J., Vogel, A., Hoffmann, T., Ouwersloot, H. G., Vilà-Guerau de Arellano, J., and Lelieveld, J.: Summertime total OH reactivity measurements from boreal forest during HUMPPA-COPEC 2010, Atmos. Chem. Phys., 12, 8257–8270, https://doi.org/10.5194/acp-12-8257-2012, 2012.
Nölscher, A. C., Bourtsoukidis, E., Bonn, B., Kesselmeier, J., Lelieveld, J., and Williams, J.: Seasonal measurements of total OH reactivity emission rates from Norway spruce in 2011, Biogeosciences, 10, 4241–4257, https://doi.org/10.5194/bg-10-4241-2013, 2013.
Novelli, A., Hens, K., Tatum Ernest, C., Martinez, M., Nölscher, A. C., Sinha, V., Paasonen, P., Petäjä, T., Sipilä, M., Elste, T., Plass-Dülmer, C., Phillips, G. J., Kubistin, D., Williams, J., Vereecken, L., Lelieveld, J., and Harder, H.: Estimating the atmospheric concentration of Criegee intermediates and their possible interference in a FAGE-LIF instrument, Atmos. Chem. Phys., 17, 7807–7826, https://doi.org/10.5194/acp-17-7807-2017, 2017.
Noxon, J. F., Norton, R. B., and Henderson, W. R.: Observation of Atmospheric NO3, Geophys. Res. Lett., 5, 675–678, 1978.
Osthoff, H. D., Roberts, J. M., Ravishankara, A. R., Williams, E. J., Lerner, B. M., Sommariva, R., Bates, T. S., Coffman, D., Quinn, P. K., Dibb, J. E., Stark, H., Burkholder, J. B., Talukdar, R. K., Meagher, J., Fehsenfeld, F. C., and Brown, S. S.: High levels of nitryl chloride in the polluted subtropical marine boundary layer, Nat. Geosci., 1, 324–328, 2008.
Phillips, G. J., Tang, M. J., Thieser, J., Brickwedde, B., Schuster, G., Bohn, B., Lelieveld, J., and Crowley, J. N.: Significant concentrations of nitryl chloride observed in rural continental Europe associated with the influence of sea salt chloride and anthropogenic emissions, Geophys. Res. Lett., 39, L10811, https://doi.org/10.1029/2012GL051912, 2012.
Phillips, G. J., Thieser, J., Tang, M., Sobanski, N., Schuster, G., Fachinger, J., Drewnick, F., Borrmann, S., Bingemer, H., Lelieveld, J., and Crowley, J. N.: Estimating N2O5 uptake coefficients using ambient measurements of NO3, N2O5, ClNO2 and particle-phase nitrate, Atmos. Chem. Phys., 16, 13231–13249, https://doi.org/10.5194/acp-16-13231-2016, 2016.
Plass-Dülmer, C., Michl, K., Ruf, R., and Berresheim, H.: C-2-C-8 hydrocarbon measurement and quality control procedures at the Global Atmosphere Watch Observatory Hohenpeissenberg, J. Chromatogr. A, 953, 175–197, 2002.
Schlosser, E., Brauers, T., Dorn, H.-P., Fuchs, H., Häseler, R., Hofzumahaus, A., Holland, F., Wahner, A., Kanaya, Y., Kajii, Y., Miyamoto, K., Nishida, S., Watanabe, K., Yoshino, A., Kubistin, D., Martinez, M., Rudolf, M., Harder, H., Berresheim, H., Elste, T., Plass-Dülmer, C., Stange, G., and Schurath, U.: Technical Note: Formal blind intercomparison of OH measurements: results from the international campaign HOxComp, Atmos. Chem. Phys., 9, 7923–7948, https://doi.org/10.5194/acp-9-7923-2009, 2009.
Schuster, G., Labazan, I., and Crowley, J. N.: A cavity ring down/cavity enhanced absorption device for measurement of ambient NO3 and N2O5, Atmos. Meas. Tech., 2, 1–13, https://doi.org/10.5194/amt-2-1-2009, 2009.
Shorees, B., Atkinson, R., and Arey, J.: Kinetics of the gas-phase reactions of β-phellandrene with OH and NO3 radicals and O3 at 297±2 K, Int. J. Chem. Kinet., 23, 897–906, https://doi.org/10.1002/kin.550231005, 1991.
Sobanski, N., Tang, M. J., Thieser, J., Schuster, G., Pöhler, D., Fischer, H., Song, W., Sauvage, C., Williams, J., Fachinger, J., Berkes, F., Hoor, P., Platt, U., Lelieveld, J., and Crowley, J. N.: Chemical and meteorological influences on the lifetime of NO3 at a semi-rural mountain site during PARADE, Atmos. Chem. Phys., 16, 4867–4883, https://doi.org/10.5194/acp-16-4867-2016, 2016.
Stutz, J., Alicke, B., Ackermann, R., Geyer, A., White, A., and Williams, E.: Vertical profiles of NO3, N2O5, O3, and NOx in the nocturnal boundary layer: 1. Observations during the Texas Air Quality Study 2000, J. Geophys. Res.-Atmos., 109, D12306, https://doi.org/10.1029/2003JD004209, 2004.
Thieser, J., Schuster, G., Schuladen, J., Phillips, G. J., Reiffs, A., Parchatka, U., Pöhler, D., Lelieveld, J., and Crowley, J. N.: A two-channel thermal dissociation cavity ring-down spectrometer for the detection of ambient NO2, RO2NO2 and RONO2, Atmos. Meas. Tech., 9, 553–576, https://doi.org/10.5194/amt-9-553-2016, 2016.
Voigt, S., Orphal, J., and Burrows, J. P.: The temperature and pressure dependence of the absorption cross-sections of NO2 in the 250–800 nm region measured by Fourier-transform spectroscopy, J. Photoch. Photobio. A, 149, 1–7, https://doi.org/10.1016/s1010-6030(01)00650-5, 2002.
von Friedeburg, C., Wagner, T., Geyer, A., Kaiser, N., Vogel, B., Vogel, H., and Platt, U.: Derivation of tropospheric NO3 profiles using off-axis differential optical absorption spectroscopy measurements during sunrise and comparison with simulations, J. Geophys. Res.-Atmos., 107, ACH 5-1–ACH 5-20, https://doi.org/10.1029/2001JD000481, 2002.
Wayne, R. P., Barnes, I., Biggs, P., Burrows, J. P., Canosamas, C. E., Hjorth, J., Lebras, G., Moortgat, G. K., Perner, D., Poulet, G., Restelli, G., and Sidebottom, H.: The Nitrate Radical – Physics, Chemistry, and the Atmosphere, Atmos. Environ., 25, 1–203, 1991.
Wiedensohler, A., Birmili, W., Nowak, A., Sonntag, A., Weinhold, K., Merkel, M., Wehner, B., Tuch, T., Pfeifer, S., Fiebig, M., Fjäraa, A. M., Asmi, E., Sellegri, K., Depuy, R., Venzac, H., Villani, P., Laj, P., Aalto, P., Ogren, J. A., Swietlicki, E., Williams, P., Roldin, P., Quincey, P., Hüglin, C., Fierz-Schmidhauser, R., Gysel, M., Weingartner, E., Riccobono, F., Santos, S., Grüning, C., Faloon, K., Beddows, D., Harrison, R., Monahan, C., Jennings, S. G., O'Dowd, C. D., Marinoni, A., Horn, H.-G., Keck, L., Jiang, J., Scheckman, J., McMurry, P. H., Deng, Z., Zhao, C. S., Moerman, M., Henzing, B., de Leeuw, G., Löschau, G., and Bastian, S.: Mobility particle size spectrometers: harmonization of technical standards and data structure to facilitate high quality long-term observations of atmospheric particle number size distributions, Atmos. Meas. Tech., 5, 657–685, https://doi.org/10.5194/amt-5-657-2012, 2012.