the Creative Commons Attribution 4.0 License.
the Creative Commons Attribution 4.0 License.
 | 17 Aug 2018
Assessment of global navigation satellite system (GNSS) radio occultation refractivity under heavy precipitation
Ramon Padullés
Estel Cardellach
Kuo-Nung Wang
Chi O. Ao
F. Joseph Turk
Manuel de la Torre-Juárez
A positive bias at heights between 3 and 8 km has been observed when comparing the radio-occultation (RO)-retrieved refractivity with that of meteorological analyses and reanalyses in cases where heavy precipitation is present. The effect of precipitation in RO retrievals has been investigated as a potential cause of the bias, using precipitation measurements interpolated into the actual three-dimensional RO ray paths to calculate the excess phase induced by precipitation. The study consisted of comparing the retrievals when such extra delay is removed from the actual measurement and when it is not. The results show how precipitation itself is not the cause of the positive bias. Instead, we show that the positive bias is linked to high specific-humidity conditions regardless of precipitation. This study also shows a regional dependence of the bias. Furthermore, different analyses and reanalyses show a disagreement under high specific-humidity conditions and, in consequence, heavy precipitation.


The radio occultation (RO) technique uses opportunistic global navigation satellite system (GNSS) signals to sound the atmosphere. The signal trajectory, traveling from GNSS satellites to low Earth orbiters (LEOs), is bent due to the index of refraction gradients of the atmosphere. Such bending can be inferred using the phase derivative observable (Doppler shift) obtained by dedicated receivers in the LEOs. Under the assumption of a spherically symmetric atmosphere, the bending angle profile can be integrated to a vertical profile of the refractive index, n(h), through Abel inversion (e.g., Kursinski et al., 1997; Hajj et al., 2002).
Refractivity is defined to account for the deviations of the index of refraction from unity and is related to geophysical parameters by (e.g., Thayer, 1974; Kursinski et al., 1997):
where P is the total pressure (mbar), T is temperature (K), e is the partial water vapor pressure (mbar), ne is the electron density (m−3), f is the frequency (Hz), and Ww, i is the liquid and ice water contents (g m−3). These terms are classified as dry, wet, ionospheric, and scattering terms. The dry term is dominant below 60–90 km, while the wet term becomes significant in the lower troposphere. The ionospheric term becomes dominant above 60–90 km, and its leading contribution is removed by a combination of two frequencies used by GNSS satellites (L1=1.575 GHz; L2=1.228 GHz) (Vorob'ev and Krasil'nikova, 1994). The scattering terms (i.e., Ww, i) are generally much smaller compared to the other refractivity terms in the lower troposphere. Therefore, they are usually neglected in the retrieval of the atmospheric variables, and when RO measurements are assimilated into numerical weather prediction (NWP) models.
A commonly used method to retrieve temperature, pressure, and water vapor from RO observations is the one-dimensional variational retrieval (1DVAR). It consists of obtaining the most probable atmospheric variable combining a priori atmospheric information with the observations in a statistically optimal way (Healy and Eyre, 2000). Usually, these a priori values are obtained from global meteorological analyses or reanalyses. On the other hand, bending angle and refractivity profiles are directly assimilated into NWP (e.g., Healy et al., 2005; Cucurull et al., 2007), with a high positive impact in the weather forecasts (Cardinali and Healy, 2014).
An unavoidable link exists between NWP models and RO-retrieved temperature, pressure, and moisture, due to the fact that RO products use a priori information from the models, and models assimilate RO observations. Yet differences exist between their products, and understanding them is important in order to detect weaknesses and potentially improve the performance of models.
In this study we compare RO refractivity observations with the global weather analyses and reanalyses, in the presence of precipitation. These analyses have coarse spatial resolution, which has a direct impact in the treatment of heavy precipitation. At these scales, convective processes need to be parameterized. In turn, convective parameterization (CP) has been identified as one of the major source of errors in the modeling of heavy precipitation (e.g., Arakawa, 2004). The RO technique offers unique potential to study the interaction between heavy precipitation and vertical thermodynamic processes within the atmosphere, since RO signals can penetrate into thick clouds and RO products have high vertical resolution. Recent investigations by Cardellach et al. (2014, 2017) and Padullés et al. (2016) have shown potential to retrieve vertical precipitation information adapting RO receivers to collect polarimetric observables (Pol-ROs). Therefore, Pol-ROs emerge as a technique that could provide relevant simultaneous information of precipitation and thermodynamics (e.g., moisture) to advance the understanding of the processes linking the vertical structure of moisture and heavy precipitation.
While such products are not yet available, in this study we investigate precipitation-induced features in standard (non-polarimetric) RO products using collocations (i.e., space and time coincidences) between the COSMIC/FORMOSAT-3 mission (Anthes et al., 2008) and the Tropical Rainfall Measurement Mission (TRMM) (Kummerow et al., 2000) and Global Precipitation Measurement (GPM) mission (Hou et al., 2014), and we compare such features with those of analyses and reanalyses. The refractivity from analyses and reanalyses is derived using the temperature, pressure, and moisture that they provide and Eq. (1).
A clear positive bias in the RO refractivity with respect to that of some weather analyses and reanalyses is observed between 3 and 8 km height when precipitation is present in the surroundings of the observation. Previous studies have noted similar biases, for example Lin et al. (2010), Yang and Zou (2012, 2016), and Zou et al. (2012). These studies linked the bias with the liquid and ice water content present at the observation site, suggesting that the scattering term from Eq. (1) should not be neglected but used to correct RO refractivity observations instead. However, our approach in this study is different and takes into account the 3-D structure of the precipitating medium. Here, the impact of precipitation is assessed directly in the Doppler shift observable, using three-dimensional collocations of precipitation structures and realistic RO ray trajectories, together with computational simulations of the effect of the scattering of the propagating signal by liquid and solid water particles. Afterwards, the causes of the observed bias are discussed, with a focus on the performance of the used analyses and reanalyses, especially under high specific-humidity conditions. The reason to proceed this way is because solely comparing the RO observations with data from analyses and reanalyses, one could not make a clear distinction on whether the bias is due to the observation technique limitations or the weather analyses limitations.
This paper is structured in the following way. The details of the data and collocations used for this study are explained in Sect. 2. In Sect. 3 the bias in the comparison between RO observations and analyses and reanalyses is introduced. Section 4 presents the results of the assessment of the precipitation-induced delay in the RO observables. In Sect. 5 the specific humidity is assessed as the source of the refractivity bias. Finally, Sect. 6 contains a discussion of the results.
The COSMIC/FORMOSAT-3 RO products are obtained from the University Corporation for Atmospheric Research (UCAR) COSMIC Data Analysis and Archive Center (CDAAC). The observed RO refractivity is obtained from the Level-2 wetPrf products, along with the retrieved temperature, pressure, and water vapor partial pressure at every 0.1 km of altitude, between the surface level and 20 km. The observed refractivity included in the wetPrf files is the same product as in the atmPrf files, provided here at the same height levels as the other thermodynamic products. These observations are collocated with the European Center for Medium range Weather Forecast (ECMWF) ERA-Interim (e.g., Dee et al., 2011), the ECMWF high-resolution operational analysis, and the National Centers for Environmental Prediction (NCEP) operational analysis, the Global Forecast System (GFS) (NOAA/NCEP, 2003). These collocated profiles are obtained also at the CDAAC in the Level-2 eraPrf, echPrf, and gfsPrf products. The RO products are interpolated into the analyses height levels when the comparisons are performed.
Data from the TRMM and GPM precipitation missions are obtained from the NASA Goddard Earth Sciences Data and Information Services Center (GES DISC). The TRMM data used here are the Level-2 orbital 2B31 products, which provide vertical structure information of precipitation and have a limited swath coverage. The GPM data used are the final run of the Integrated Multi-satellitE Retrievals for GPM (IMERG) products (Huffman et al., 2018), which provide a surface rain rate for the region comprised between ±60∘ latitude. In order to assess the precipitation intensity and structural characteristics, data from the vertically profiling TRMM radar are used, while the GPM IMERG data are used to increase the statistics. The TRMM 2B31 products provide precipitation information for the region sensed by the TRMM Precipitation Radar (PR), such as rain rate, with a swath of approximately 250 km, a horizontal resolution of 5×5 km, and a vertical resolution of 250 m. The IMERG product provides an estimate of the global surface precipitation every 30 min with a horizontal resolution of 0.1∘ latitude × 0.1∘ longitude.
For this study, the precipitation information comes solely from the TRMM and GPM-retrieved products, and no precipitation information is used nor assumed from the analyses and reanalyses. Therefore, the analyses and the reanalysis products might or might not be associated with different precipitation conditions when their products are generated. However, it is not the aim of this work to assess the ability of analyses to reproduce precipitation but to evaluate and compare the RO products with their provided thermodynamic fields for a given location and time in the actual presence or absence of precipitation. Nevertheless, we consider that this could solely lead to minor effects, since the water vapor field is spatiotemporally smoother than the cloud water content field.
2.1 Collocations with the TRMM PR
The COSMIC/FORMOSAT-3 RO products between 2006 and 2015 were collocated with TRMM orbital products. A total of 16 881 COSMIC RO soundings are identified to be within the swath of the TRMM precipitation measurements (250 km) and within ±15 min. After 2013, the number of COSMIC/FORMOSAT-3 RO observations dropped significantly. However, the quality and distribution of the observations was not affected. These events were then classified depending on the presence or not of precipitation and its intensity. Henceforth, each event is linked to the number of pixels of the TRMM radar with a reflectivity (Z) larger than 30 dBZ, used as a proxy for heavy precipitation events, in the surroundings (100 km) of the occultation location within the radar swath.
For each event with evidence of precipitation in its surroundings, the approximated RO ray trajectories have been simulated using ray-tracing techniques and geo-located together with the radar-retrieved three-dimensional reflectivity observations. Therefore, it is possible to interpolate the precipitation information into the set of RO ray trajectories. An example of such interpolation is shown in Fig. 1. We can therefore estimate the amount of precipitation crossed by each of the rays, estimate its effect, and compare it with the actual RO observables such as the excess phase (or the Doppler shift), the signal-to-noise ratio (SNR), or the atmospheric vertical retrievals. We use this information to assess the impact of precipitation on the RO signal propagation and its retrievals, as described in Sect. 4.

Figure 1Three-dimensional collocation of an RO event with a TRMM PR precipitation measurement. It corresponds to the coincidence between the C004.2006.329.22.20.G19 RO event and the 2B31.20061125.51450 TRMM PR product. Here, the precipitation structure is shown in a three-dimensional grid, along with the set of RO ray trajectories (in gray). Black stars indicate the tangent point of the rays. Only a few rays are shown for illustration purposes. The orange dashed lines indicate the edges of the TRMM PR swath. The precipitation information (rain rate) interpolated into the RO plane is shown in the two-dimensional projection in the latitude–height plane.
It is worth mentioning that in this study, we focus on the effect of rain and hydrometeors large enough to exhibit a significant reflectivity signature in the TRMM radar retrievals (working at Ku band), which in its turn are the ones we expect to have the largest impact on RO retrievals. The scattering effects of smaller particles, especially above the melting layer, have larger uncertainty and must be treated carefully.
2.2 Collocations with GPM IMERG
In order to improve the statistics of collocated profiles we have performed a larger-scale collocation using the GPM IMERG products (every 30 min with spatial coverage between 60∘ S and 60∘ N) and all the COSMIC/FORMOSAT-3 RO products of 2015 and 2016. We can greatly expand the number of collocations by considering only the surface precipitation rate. For each of the COSMIC/FORMOSAT-3 RO events, the corresponding IMERG product has been identified, and the precipitation retrieval has been linked to the RO event. This results in 481 252 RO events of which the surface precipitation in their surroundings has been identified with a time resolution of ±15 min. For each event, the mean rain rate, the maximum rain rate, and the number of pixels with a non-zero rain rate, in a region of , are stored along with the vertical RO profiles of refractivity, temperature, pressure, water vapor pressure, and the corresponding collocated weather analyses and reanalyses products.
A clear positive refractivity bias is observed between ∼3 and ∼8 km of altitude when precipitation is present in the occultation position, with respect to the refractivity from weather analyses and reanalyses. In Fig. 2 the bias is shown, for the comparison between the GPM IMERG collocated RO products and the three different analyses and reanalyses introduced in Sect. 2. In this case, the data are separated according to the amount of rain in the surroundings: events with no rain (no-rain profiles) and events where 〈R〉>10 (mm h−1) in the surrounding area.
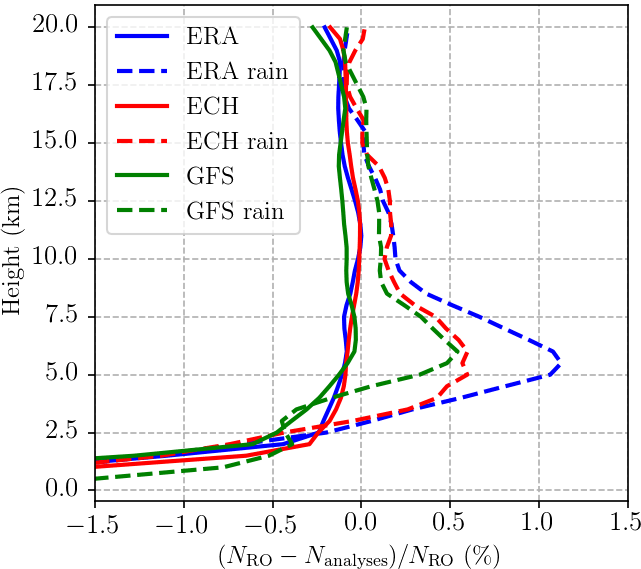
Figure 2Fractional difference between the RO-observed refractivity and that from (blue) ERA-Interim, (red) ECMWF high-resolution analysis, and (green) NCEP GFS operational analysis. The RO profiles are divided into no rain (solid) and heavy rain (dashed) based on the collocated GPM IMERG precipitation measurements (see Sect. 2.2). These data correspond to 2016.
While the bias is clearly seen for the two analyses and one reanalysis used in the comparison, their performance within heavy precipitation is also different. When precipitation is not present close by the RO sounding, the RO refractivity and that of analyses and reanalyses agree with each other (i.e., no significant bias) as well as among themselves.
In Fig. 3 we show the regional dependence of the bias, at a height of 6 km. Through the paper we focus on the height range around 6 km because this is where the bias is maximal, as seen in Fig. 2. Here, the globe is divided in hexagons with a diameter of approximately 20∘, and the events are separated according to their 〈R〉: 〈R〉=0 mm h−1; mm h−1; and 〈R〉>2.5 mm h−1. This separation is shown at each different column, while the rows separate the analyses or reanalyses used in the comparison. The size of the hexagons is chosen so that all of them contain a significant number of observations, and spatial patterns are clearly seen. Only those bins with a minimum of 25 observations inside them are shown, and the typical range of observations inside the bins is between 1000 and 7000 observations per bin for the no-rain scenarios, between 200 and 1600 observations per bin in the low-rain regime, and between 25 and 150 observations per bin in the heavy-rain regime. This figure shows how the positive bias is present globally under heavy precipitation, although it is larger in certain regions and it depends on the analysis in use. Common features for all three reanalyses are, for example, the positive bias under heavy precipitation that is present in the west Pacific warm pool, the eastern part of the Pacific, the Indian Ocean, the equatorial part of the Atlantic, and over South America and central Africa. These regions are associated with extreme precipitation features (Liu and Zipser, 2015), either to large extension precipitation events or to precipitation systems with a high deep convective cores.
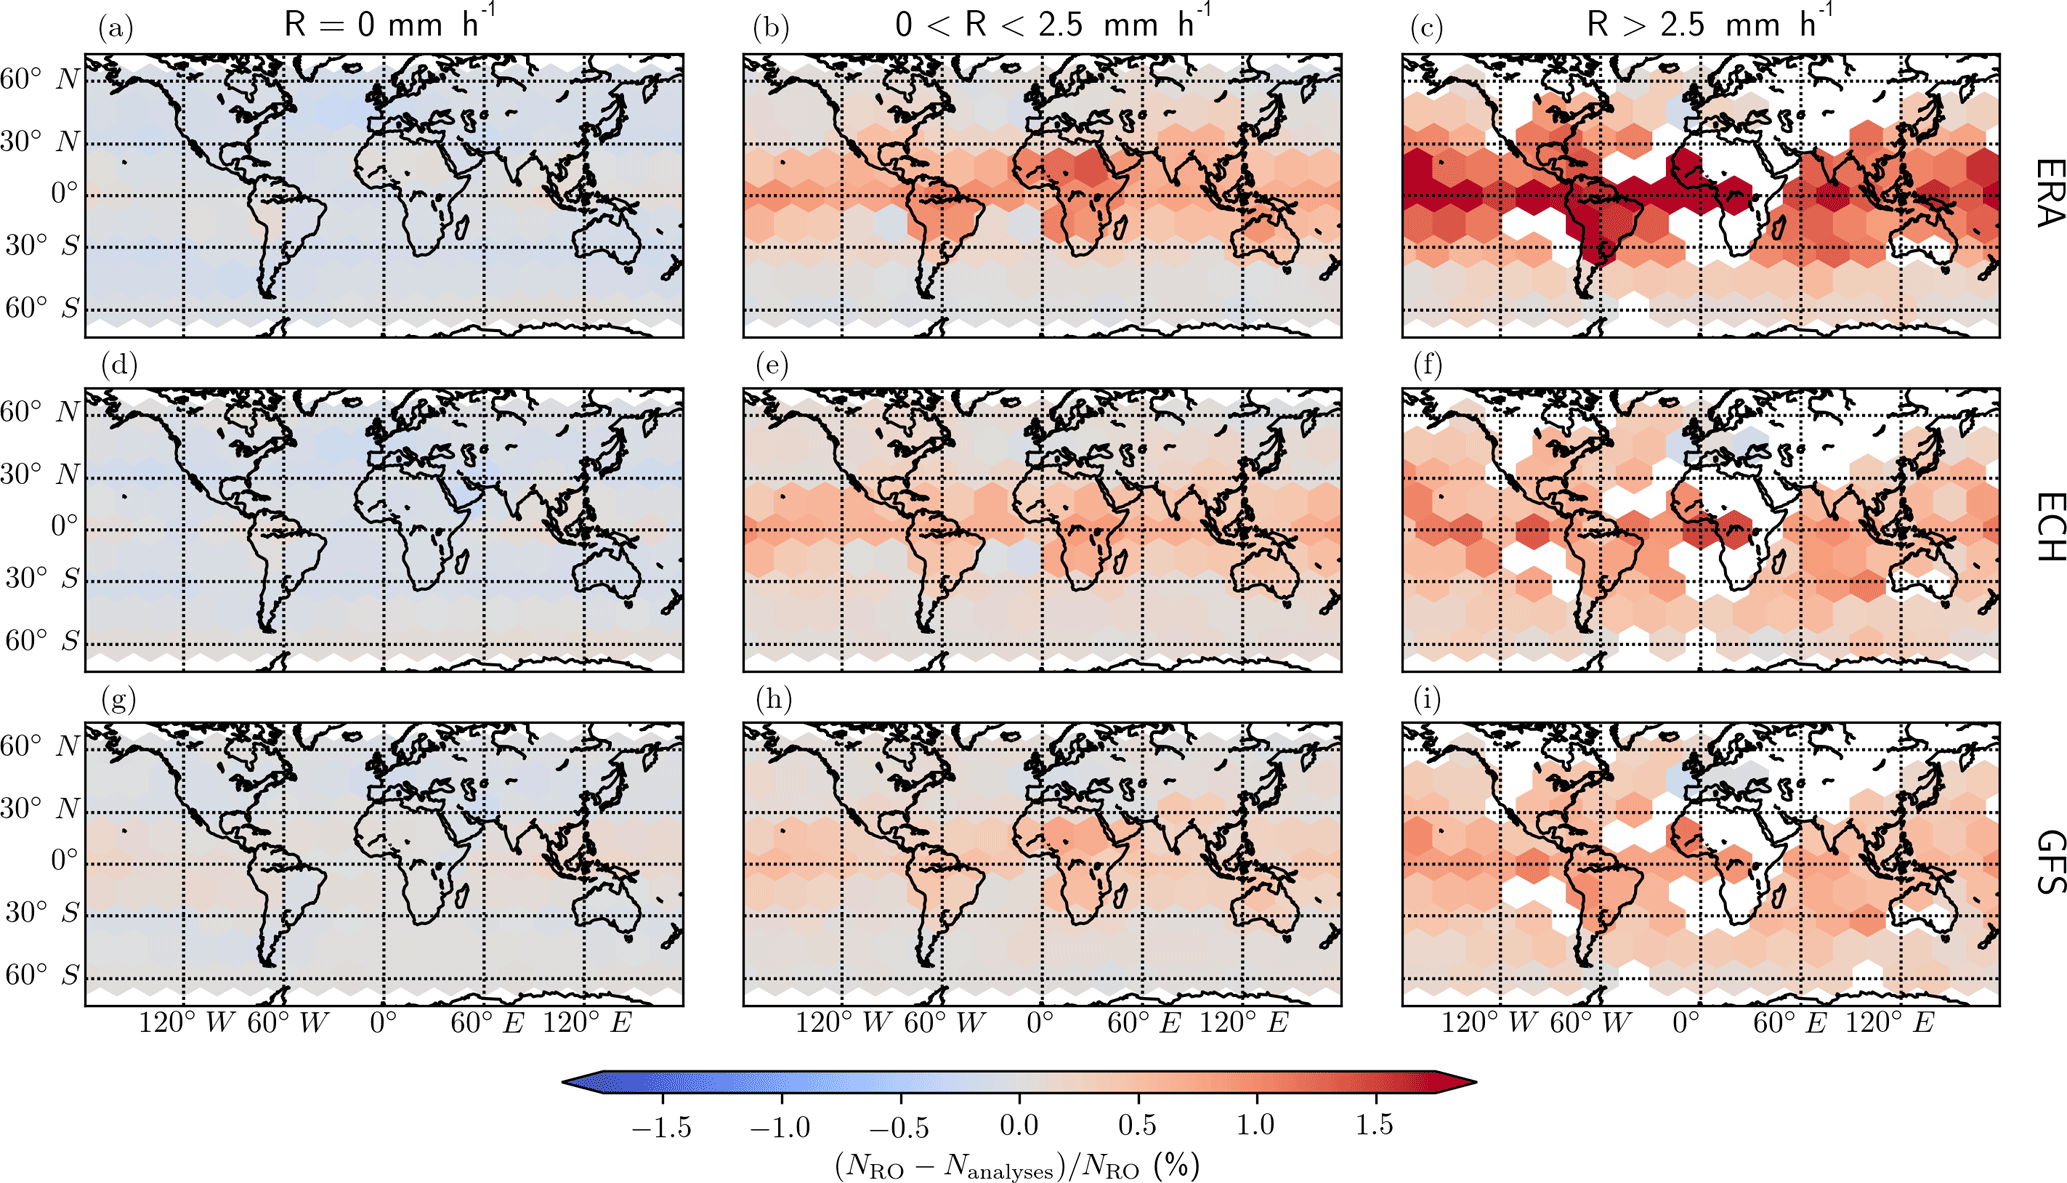
Figure 3Regional averaged fractional difference between the RO-observed refractivity and that from (a, b, c) ERA-Interim: (d, e, f) ECMWF high-resolution analysis and (g, h, i) NCEP GFS operational analysis for a height of 6 km. The compared profiles are classified as belonging to no-rain profiles (a, d, g; 〈R〉=0 mm h−1), low and moderate precipitation (b, e, h; mm h−1), and heavy-rain profiles (c, f, i; 〈R〉>2.5 mm h−1). The grid corresponds to hexagons with a diameter of about 20∘. Only those with a minimum of 25 observations inside them are shown.
Besides the positive bias in the region above an altitude of 4 km, a negative bias is also clearly observed below 3 km, both for the rainy and no-rain events. This bias is not assessed here, since it has already been discussed previously in other studies (e.g., Ao et al., 2003; Sokolovskiy, 2003; Xie et al., 2006, 2012; Wang et al., 2017). Similarly, other potential sources of bias have been checked, for example, the angle of incidence of the occultation ray to the receiver, with respect to the transmitter position. The larger the angle, the larger the tangent point drift. This implies that the theoretical spherically symmetric atmosphere could depart from a realistic approximation and induce errors in the retrievals (Foelsche et al., 2011). Also, large incident angles correspond to low SNRs, which could be introducing positive biases (Sokolovskiy et al., 2010). Therefore, the positive bias has been checked grouping the occultation events according to its azimuth angle, in addition to rain variables. The results (not shown) reveal no significant changes to the positive N bias and confirm that the RO observation geometry is not a contributing factor to the positive bias.
Once other known observational issues are discarded as plausible sources of the bias, the influence of the scattering term in Eq. (1) is assessed. In order to further investigate its importance, we have directly simulated the contribution of the liquid and solid water to the excess phase. This is accomplished using three-dimensional collocations between the COSMIC/FORMOSAT-3 RO observations and the TRMM PR measurements, which have allowed us to perform realistic simulations of the effects of precipitation in actual RO observables (see Fig. 1). This represents a novel approach to the assessment of the positive refractivity bias with respect to previous studies.
The contribution from precipitation on the phase delay of the signal is due to the scattering of the propagating wave by nonspherical raindrops. The delay induced by raindrops (or frozen hydrometeors) with respect to that of free space can be linked to the scattering term of refractivity in Eq. (1). For the case in this study, the coherent propagation of plane waves is described as the sum of the effects of all the raindrops in a unit volume with various sizes. Formally, the scattered field can be expressed as
where Ei is the incident field, Es is the scattered field, and T is the “transmission matrix” describing the characteristics of the rain medium (Oguchi, 1983). The propagation through rain can be considered as a propagation through an effective medium with two characteristic axes, characterized by the two eigenvalues of T, λ1 and λ2:
where l is the propagated distance.
Raindrops fall following gravity and are flattened due to the air drag, becoming approximately oblate-shaped (e.g., Pruppacher and Beard, 1970; Beard and Chuang, 1987). Here, we do not take into account the canting angle effect (raindrops being tilted by wind), for simplicity and because in this situation its effect is secondary. Therefore, , where the keff is the effective propagation constant of the medium, that is, a complex number, and 1 and 2 indicate the characteristic axes of the medium. For the case in this study, the two characteristic axes correspond to h and v (horizontal and vertical).
The effective propagation constant can be expressed as (e.g., Bringi and Chandrasekar, 2001)
where k0 is the propagation constant in the homogeneous atmosphere, np is the number of particles per unit volume, ei indicates the unit polarization vector for the linear states, and is the scattering amplitude vector in the forward-scattering configuration. The real part of the effective propagation constant induces a phase shift, while the imaginary part induces an attenuation. At L band, the attenuation due to the scattering by rain can be neglected. The expression of keff is defined for a number of identical particles but can be generalized to a size distribution of particles defined by N(D). Also, the can be expressed as the scattering amplitude matrix, S, using the Jones notation (Jones, 1941). The scattering amplitude matrix (2×2) relates the scattered field components to the incident field components in the far-field approximation. For a right-hand circularly polarized (RHCP) propagating field, as it correspond to GNSS-transmitted signals, a mean effective propagation constant can be defined by
Hence, the specific phase shift induced only by the raindrops to a circularly polarized incident wave is
in units of mm km−1, where λ is the wavelength (mm), Shh, vv is the co-polar components of the forward-scattering amplitude matrix in a linear base of polarization, N(D) is the particle size distribution (mm−1 m−3), and D is the diameter of the particles (mm). The forward-scattering amplitude matrix is computed for each scatterer and depends on the scatterer's size, composition, orientation, and shape (see Bringi and Chandrasekar, 2001, for a detailed explanation). For this study, the T-matrix code is used in order to compute S for raindrops of all sizes between 0.1 and 8 mm of diameter (Mishchenko et al., 1996). For the particle shapes, the Beard and Chuang (1987) model is used, which relates the diameter of the each particle to the relationship between its two characteristic dimensions (i.e., its axis ratio). The complex permittivity for liquid water is obtained from Liebe et al. (1991). The N(D) is obtained at each point from the TRMM products using the same one used to retrieve rain rate from the TRMM PR reflectivity measurements, which is usually approximated with a gamma model (e.g., Kozu et al., 2009).
Using the three-dimensional collocations, we can therefore compute the phase delay that is solely due to precipitation in the following way:
-
For each collocated event, we have the precipitation information interpolated into the set of RO ray trajectories. The precipitation information (for example, rain rate, water content) is used, directly or indirectly, to infer the N(D) at each point of these trajectories.
-
With the N(D), we can compute the specific ΔΦrain along each ray using Eq. (6) and integrate this quantity along each ray path:
in units of millimeters, where L is the ray-path length in kilometers.
For each occultation event that has been 3-D-collocated with the TRMM PR, we can have the approximate vertical profiles of precipitation-induced delay along with all the currently provided information, such as the total excess phase delay, the strength of the signal, and the retrieved vertical thermodynamic products. To give the reader context, ray-path length below 15 km can be of the order of hundreds of kilometers, and therefore the amount of liquid water content that is crossed is significant. In big precipitating systems, the total integrated liquid water content along the ray paths can exceed 50 kg m−2.
4.1 Precipitation-induced phase delay impact
In this section we want to assess the impact that the precipitation-induced phase delay has on RO retrievals. To do so we have designed a study that consists of retrieving the bending angle (phase matching method; Jensen et al., 2003) and refractivity (inverse Abel transform; Fjeldbo et al., 1971) profiles from the total excess phase delay to compare it with the retrieval results when the precipitation-induced delays are removed from the original total excess phase. Therefore, the precipitation-induced delays obtained in the previous section are removed from the actually observed phase delays, obtaining two profiles called rain (original) and rain-free (where the precipitation-induced delay has been removed).
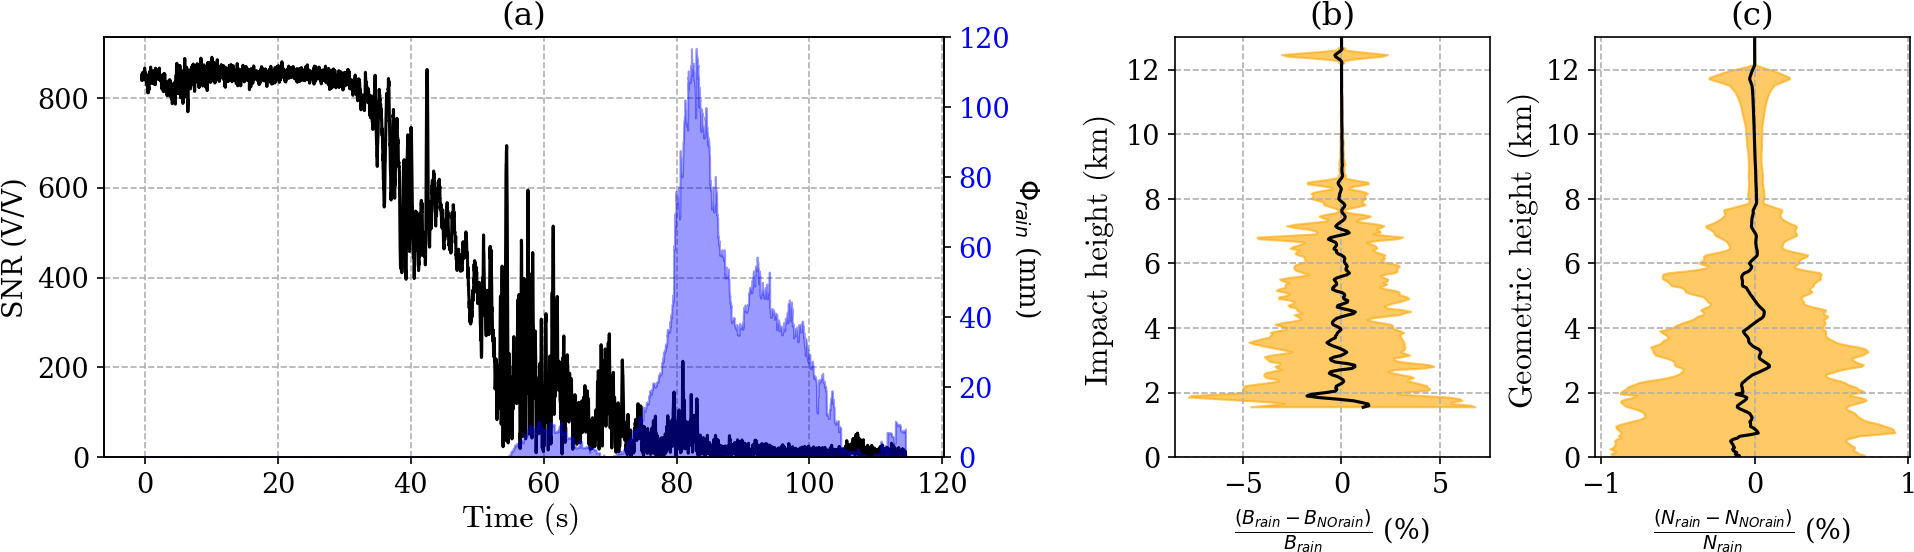
Figure 4(a) Actual SNR (black) corresponding to the RO event C001.2008.345.00.43.G03 (UCAR ID), along with the simulated precipitation-induced phase delay (blue) as a function of time; (b, c) fractional bending angle and refractivity differences between the outputs from the retrieval using the rain-affected profiles and the rain-removed ones, as a function of the impact height (bending angle) and of the geometric height (refractivity). Black lines represent the mean of the 65 cases, while orange shading is the standard deviation.
The bending angle and refractivity retrieval were attempted on both rain and rain-free excess phases from a total of 65 cases collocated with heavy precipitation events. The bending angle profiles calculated by phase matching were smoothed with 200 m windows and compared at the same impact height (corresponding impact parameter minus the collocated radius of Earth).
An example of 1 of the 65 collocated cases is shown in Fig. 4. In panel (a) of Fig. 4 we show an example of the actual occultation SNR (black) together with the precipitation-induced phase delay (blue shaded), as a function of time with respect to the start of the occultation. Note that the maximum precipitation-induced phase delay is of the order of hundreds of millimeters, while the total excess phase at the lower layers of the atmosphere is of the order of kilometers. This case corresponds to a precipitating cell in the Indian Ocean (11∘ N, 72∘ E), with an approximate extension of 10 000 km2 and rain rate exceeding 20 mm h−1. The combination of extension and intensity makes this case an interesting one, inducing an excess phase larger than 110 mm. The cases selected for this work are those with the largest precipitation-induced excess phase and are all around 100 mm. They are representative of the variety of collocated cases, combining different intensities and extensions.
In panels (b) and (c) of Fig. 4, we show the mean (black line) and standard deviation (orange shading) of the difference between the retrieval using the actual measurements and those after removing the precipitation-induced excess phase, both for the bending angle (panel b) as a function of the impact height and for refractivity (panel c) as a function of geometric height. Because of the integration nature of the inverse Abel transform, the standard deviation (orange shading in panels b and c of Fig. 4) in the retrieved refractivity is much smoother than the one in bending angle profiles. If precipitation had a systematic effect on RO phase delays, a positive bias would be observed in the rain-affected bending angle and refractivity when compared with the rain-free bending and refractivity for the same case. However, this effect is absent in Fig. 4b and c.
The results of the nonexistent mean positive bias shown in Fig. 4b and c suggest that the positive bias found in the retrieved refractivity compared to the weather analyses and reanalyses is not due to neglecting the scattering term in the refractivity. Furthermore, it can be seen how, on average, the impact of taking/not taking into account the precipitation-induced delays when assessing the retrieval increases the variability, implying that the changes in removing precipitation contribution from the signal propagation can be both positive and negative rather than only negative. Since the bending angle and refractivity retrieval process depends mostly on the vertical gradient of the excess phase, the precipitation-induced excess Doppler, which can be positive or negative, will on average lead to unbiased retrieval results. This extra-excess Doppler can be seen as the result of local horizontal inhomogeneity in the refractivity field.
Differently from temperature and pressure, the liquid and ice water content is localized in a small region (compared to the ray travel distance) and might not be contributing along the whole propagation ray path of an occultation. Furthermore, the region where liquid and ice water is present might be far from the tangent point. Yet the refractivity retrieved from an RO observation is located around the RO tangent point and is considered to have horizontal resolution of about 200 km (e.g., Kursinski et al., 1997). Even though the RO observations are integral quantities, most of the contribution from dry and wet air in the bending angle comes from near the tangent point.
In addition, the RO retrievals rely on the spherical symmetric atmosphere approximation. While it has been proven to work properly for the standard RO thermodynamic products, liquid and ice water content contributions to the excess phase cannot be well captured under such an assumption. In consequence, the effect of liquid/ice water content on RO refractivity retrieval results in small errors (e.g., less than 1 % in refractivity standard deviation), which does not introduce obvious biases in either the bending angle or the refractivity (Fig. 4). Thus, the scattering terms in Eq. (1) should not be the cause for the positive N bias in the presence of heavy precipitation.
In the previous section we have shown that the scattering term in Eq. (1) should not be the main cause for the refractivity bias. In this section we test another hypothesis: the bias comes from the problems of large-scale analyses and reanalyses in representing the thermodynamics of precipitation scenarios, especially under high specific-humidity conditions.
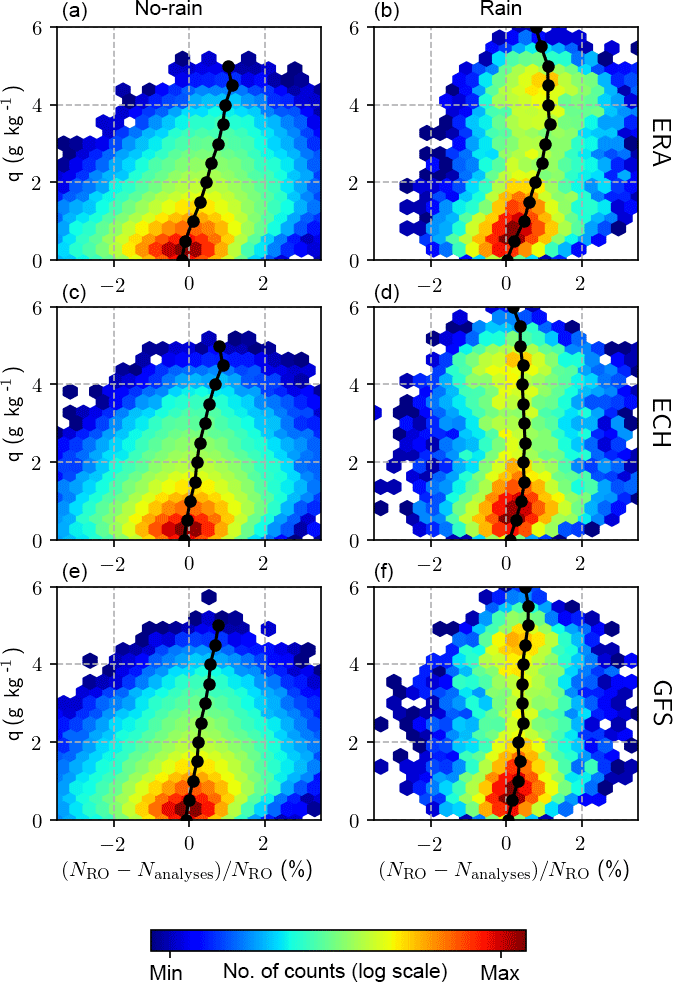
Figure 5Fractional refractivity difference between the observations and analyses as a function of the observed specific humidity at a height of 6 km. Panels (a), (c), (e) correspond to the no-rain cases, and panels (b), (d), (f) correspond to the rain cases. Panels (a) and (b) show the results for the comparison of observations and ERA-Interim, panels (c) and (d) show the results for ECMWF high-resolution analysis, and panels (e) and (f) show the results for the GFS.
We have used the data described in Sect. 2.2 to assess the refractivity bias as a function of the RO-retrieved specific humidity for precipitating and non-precipitating scenarios. In Fig. 5 we show the results for the two analyses (ECMWF high-resolution and GFS operational analyses) and one reanalysis (ERA-Interim). We can see how the fractional refractivity difference increases with specific humidity regardless of precipitation. Therefore, the refractivity bias is more correlated with increasing specific humidity than with precipitation itself. However, high specific-humidity conditions are associated with precipitation.
We further classify the collocated COSMIC RO profiles as belonging to four different categories: no rain with low specific-humidity conditions; no rain with high specific humidity; rain with low specific humidity; and rain with high specific humidity. In this case, the threshold for low and high specific humidity is that the RO-retrieved q is lower than 0.5 g kg−1 and higher than 2.7 g kg−1, respectively, in the cases with no rain and that the RO-retrieved q is lower than 0.5 g kg−1 and higher than 2.7 g kg−1, respectively, in the cases with rain. The q and the fractional refractivity difference are evaluated at a height of 6.5 km. These thresholds are based on the lower and higher 20th and 80th percentiles of data with no rain and rain. For these four classifications, the regional fractional refractivity differences are shown in Fig. 6, for the comparison with ERA-Interim, ECMWF high-resolution analysis, and the GFS analysis. Here, the globe is divided in hexagons of a diameter of 30∘, and only those with a minimum of 15 observations inside are shown. The typical range of observations per bin is between 800 and 10 000 for the no rain with low specific-humidity scenarios, between 15 and 600 for the no rain and high specific-humidity regimes, between 15 and 80 for the rain with low specific humidity, and between 15 and 250 for the rain and high specific-humidity regimes.
The results in Fig. 6 confirm the results anticipated in Fig. 5, i.e., that the fractional refractivity bias can be linked to high specific-humidity conditions rather than to precipitation itself. From the regional dependence of the fractional refractivity bias, some other conclusions can be extracted. The first one is that when there is no rain and the specific humidity is low, the fractional refractivity difference is very small regardless of location and the analyses in use.
The second conclusion one can extract from Fig. 6 is that when specific humidity is high, the fractional refractivity difference is positive and reaches large values (>1 %) for all the analyses in use and regardless of the presence of precipitation. In particular, high specific-humidity observations are concentrated in the tropics, so the largest positive refractivity biases are in this region, in agreement with Fig. 3.
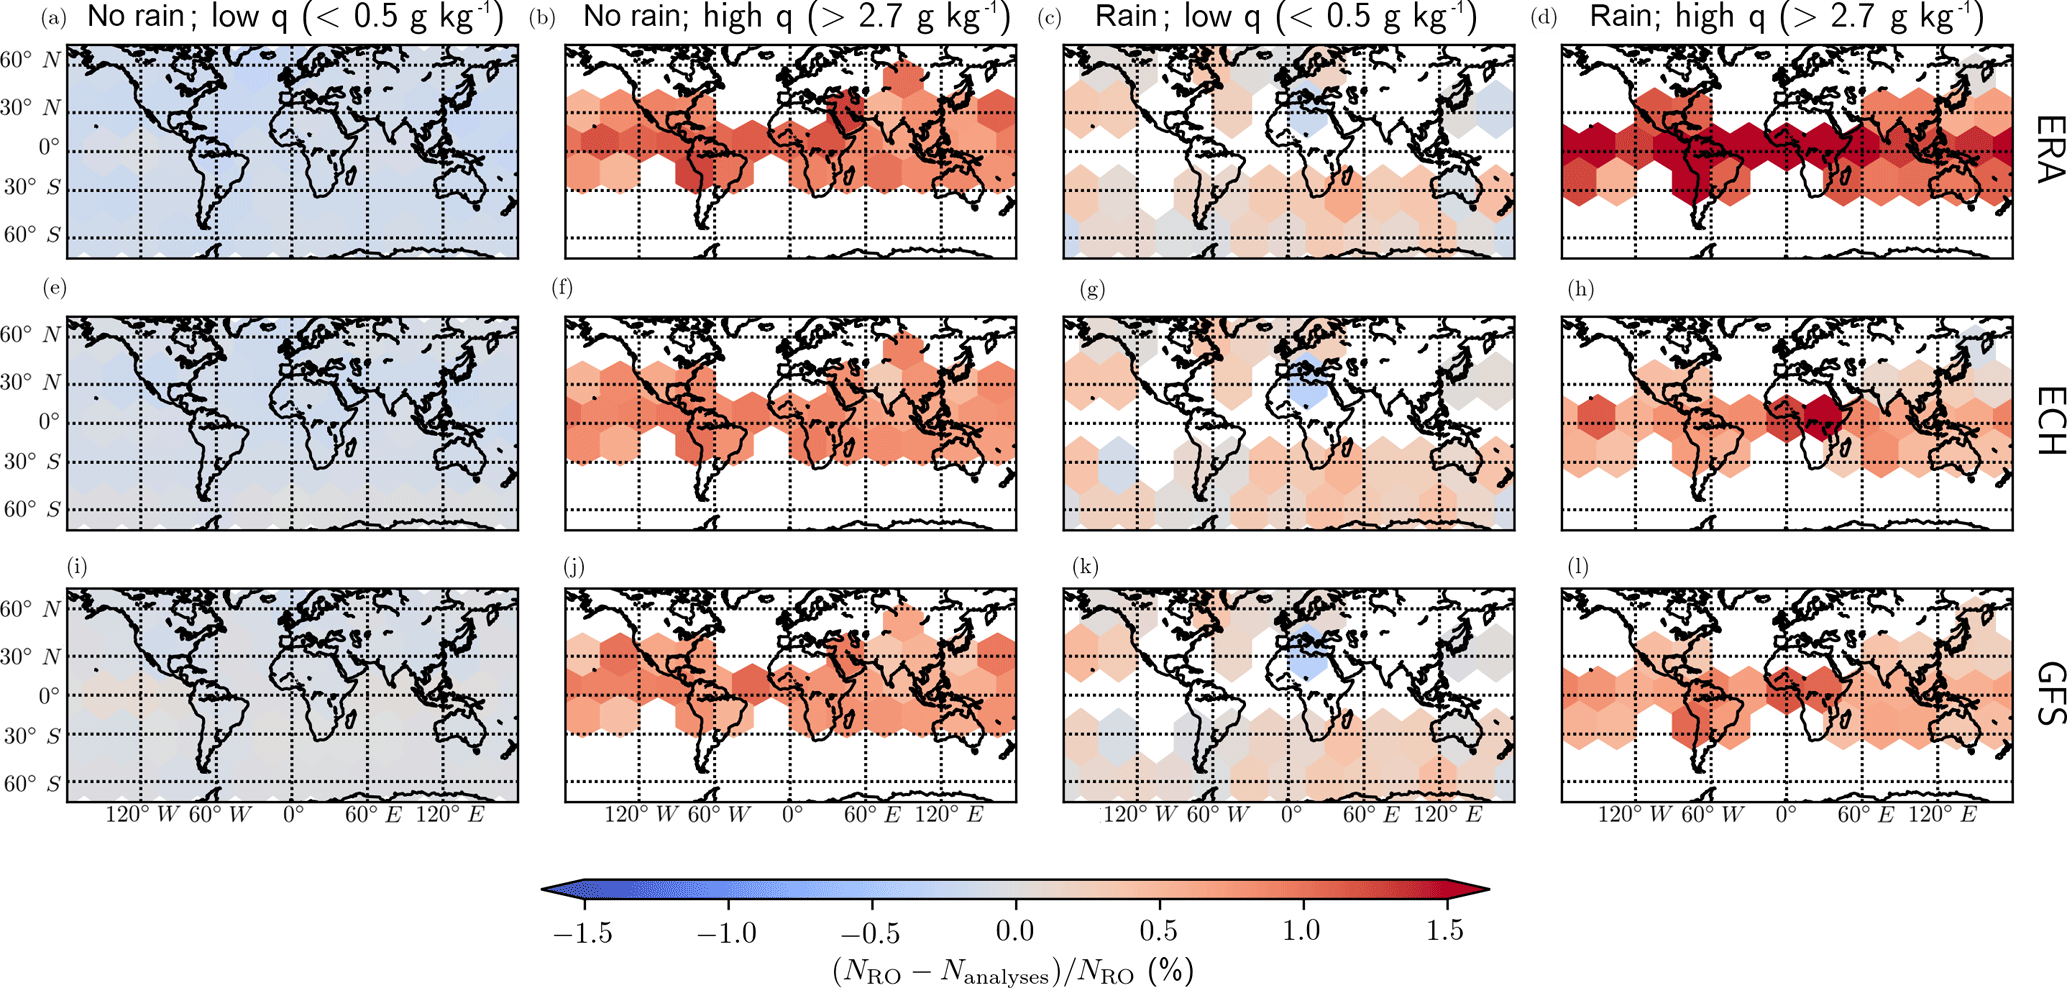
Figure 6Regional averaged differences (color scale) between the observed and the analysis refractivity. Panels (a)–(d) correspond to ERA Interim, panels (e)–(h) correspond to ECMWF high-resolution, and panels (i)–(l) correspond to the GFS. Panels (a), (e), (i), (b), (f), and (j) correspond to the free-of-rain data, where in (a), (e), and (i) the observed specific humidity at a height of 6.5 km is lower than 0.5 g kg−1 and in (b), (f), and (j) is larger than 2.7 g kg−1. Panels (c), (g), (k), (d), (h), and (l) represent rain-affected data, where in (c), (g), and (k) the observed specific humidity at a height of 6.5 km is lower than 0.5 g kg−1 and in (d), (h), and (l) is larger than 2.7 g kg−1. The grid here corresponds to hexagons with a diameter of 30∘. Only those with a minimum of 15 observations are shown.
The third conclusion is that precipitation under low specific-humidity conditions is rarely observed in the tropics. Under these conditions, the fractional refractivity difference has a more complicated behavior and no clear positive bias is observed, but there is variability depending on the location of the observations.
Finally, in addition to the positive fractional refractivity difference bias linked to high specific-humidity conditions, we show that it is also dependent on the analysis in use. For example, the bias is larger in ERA-Interim than in ECMWF high-resolution analysis and GFS operational analysis, showing the different performance of the analyses and the reanalysis, with a smaller bias for the higher-resolution analyses. On the other hand, for no rain and low specific humidity, the performance of the different analyses and the reanalysis is similar. Overall, the fact that the bias is positive is an indication that models tend to be biased dry. This is in agreement with Hersbach et al. (2015), who noticed a dry bias in ERA-Interim which was attributed to a problem in assimilating microwave radiances affected by rain.
A systematic positive bias in the fractional refractivity difference has been identified when comparing RO-retrieved refractivity with that of weather analysis and reanalysis when heavy precipitation was present in the surroundings of the observation. In this paper, the bias has been shown to be linked to the performance of models under high specific-humidity conditions rather than with precipitation itself.
This conclusion has been reached after (1) assessing the impact of precipitation directly on the RO observables (e.g., Doppler shift and bending angle), simulating the contribution of realistic three-dimensional precipitation structures to the actual RO ray trajectories, and comparing the retrievals after such a contribution is removed, and (2) evaluating the refractivity bias between RO observations and weather analyses under different humidity and precipitation conditions. This approach is novel with respect to previous studies assessing the same bias.
First, precipitation has been shown to have little impact on the positive fractional refractivity bias between RO observations and analyses and reanalyses. Differences in bending angle and refractivity between rain and rain-removed profiles can be both positive and negative, with no clear bias on average (see Fig. 4b, c). If precipitation, through the scattering term in Eq. (1), had a systematic positive impact on the RO-retrieved refractivity with respect to when precipitation is not present, the study performed in Sect. 4.1 would have shown a positive bias as well. Therefore, precipitation itself does not explain such an impact, but the combination of thermodynamic variables associated with heavy precipitation might. This statement does not mean that precipitation does not enhance the local refractivity where it occurs (which it does) but that such local enhancements do not necessarily lead to a bias.
The fractional refractivity bias between RO observations and analyses has been linked to high specific-humidity conditions. The bias appears both in rain and no-rain conditions, and it depends on the analyses and on the geographic region. The spatial resolution of the analyses and reanalyses may also be a factor, since ERA-Interim shows a larger bias than ECMWF high-resolution analysis, although they should be based on the same physical model. However, both ECMWF high-resolution and GFS operational analyses still exhibit a significant N bias with increasing humidity. The fact that the bias is not seen in Fig. 2 for the no-rain cases is because most of the no-rain cases have low specific-humidity conditions, and they have much greater weight for the mean value of the fractional refractivity difference. On the other hand, the rain cases have a larger contribution in the high specific-humidity region (see Fig. 5), contributed mostly by tropical precipitation. This is also seen in the right panels in Fig. 6d, h, and l, where precipitation with very high specific-humidity conditions is mostly observed around the equator.
The bias in fractional refractivity between observations and analyses implies that the retrieved temperature and moisture will be also biased with respect to models. The positive refractivity bias is associated with a combination of colder retrieved temperature with respect to analyses and a higher retrieved specific humidity than the one in the analyses. This is consistent with Vergados et al. (2015), who showed that ERA-Interim is systematically drier than RO in the tropics. Also, the fact that a difference exists between the different analyses used for this study and that RO thermodynamic retrievals depend on the analyses or reanalysis in use implies that a difference between the retrievals obtained by different processing centers will exist under such conditions if they use different analyses or reanalyses.
These results stress the need for a better thermodynamic characterization of high specific-humidity scenarios, likely to be associated with heavy precipitation. The heights at which the bias is maximal is also consistent with the findings of, e.g., Holloway and Neelin (2009), who argue that heavy precipitation is controlled by free-tropospheric water vapor, and this dependence is not well captured in large-scale models. These models are known to have issues with the parameterization of convective processes; hence, further investigation in this direction is required. This is the aim of polarimetric radio occultations, which will provide joint products of temperature, pressure, and moisture and an indication of the amount of precipitation (mostly sensitive to the heaviest) at each vertical level (Cardellach et al., 2017) with the objective of advancing the understanding of heavy precipitation events, closely linked with high specific-humidities conditions. Alternatively, further investigations are being conducted with the aim to make the RO retrievals less dependent on models, which would improve the retrievals itself and provide more independent information on such scenarios.
Data sets used for this work are available through third-party repositories. COSMIC RO data are available at the COSMIC Data Analysis and Archive Center at UCAR (https://cdaac-www.cosmic.ucar.edu/cdaac/rest/tarservice/data/cosmic, last access: 13 August 2018). GPM IMERG Final Precipitation L3 Half Hourly 0.1 degree × 0.1 degree V05 files are available at the Goddard Earth Sciences Data and Information Services Center (GES DISC; https://doi.org/10.5067/GPM/IMERG/3B-HH/05, last access: 13 August 2018). Tropical Rainfall Measuring Mission (TRMM) Combined Precipitation Radar and Microwave Imager Rainfall Profile L2 1.5 hours V7 files are available at GES DISC (https://disc.gsfc.nasa.gov/datacollection/TRMM_2B31_7.html, last access: 13 August 2018).
RP and EC led the simulations and data analysis. KNW and COA performed the inversion of the RO profiles. FJT provided the RO-precipitation co-locations. RP, EC, COA, and MTJ performed the RO refractivity and humidity analysis. All the authors contributed to the design of the study, the interpretation of the results, and the writing of the paper.
The authors declare that they have no conflict of interest.
Ramon Padulles and Kuo-Nung Wang's research was supported by an appointment
to the NASA Postdoctoral Program at the Jet Propulsion Laboratory,
administered by Universities Space Research Association under contract with
NASA. The work conducted at ICE-CSIC/IEEC was supported by the Spanish grant
ESP2015-70014-C2-2-R. Part of Cardellach's contribution has been supported by
the Radio Occultation Meteorology Satellite Application Facility (ROM SAF),
which is a decentralized operational RO processing center under EUMETSAT. Chi O. Ao, F. Joseph Turk, and Manuel
de la Torre-Juárez acknowledge support from the NASA US Participating
Investigator (USPI) program. TRMM and GPM data were obtained courtesy of the
NASA Precipitation Processing System (PPS). Part of this work was carried out at the Jet Propulsion
Laboratory, California Institute of Technology, under a contract with the
National Aeronautics and Space Administration.
Edited by: Hailong Wang
Reviewed by: three anonymous referees
Anthes, R. A., Bernhardt, P. A., Chen, Y., Cucurull, L., Dymond, K. F., Ector,D., Healy, S. B., Ho, S. P., Hunt, D. C., Kuo, Y. H., Liu, H., Manning, K., McCormick, C., Meehan, T. K., Randel, W. J., Rocken, C., Schreiner, W. S., Sokolovskiy, S. V., Syndergaard, S., Thompson, D. C., Trenberth, K. E., Wee, T. K., Yen, N. L., and Zeng, Z.: The COSMIC/Formosat-3 mission: Early results, B. Am. Meteorol. Soc., 89, 313–333, https://doi.org/10.1175/BAMS-89-3-313, 2008. a
Ao, C. O., Meehan, T. K., Hajj, G. A., and Mannucci, A. J.: Lower troposphere refractivity bias in GPS occultation retrievals, J. Geophys. Res., 108, 4577, https://doi.org/10.1029/2002JD003216, 2003. a
Arakawa, A.: The cumulus parameterization problem: Past, present, and future, J. Climate, 17, 2493–2525, https://doi.org/10.1175/1520-0442(2004)017<2493:RATCPP>2.0.CO;2, 2004. a
Beard, K. V. and Chuang, C.: A new model for the equilibrium shape of raindrops, J. Atmos. Sci., 44, 1509–1524, https://doi.org/10.1175/1520-0469(1987)044<1509:ANMFTE>2.0.CO;2, 1987. a, b
Bringi, V. N. and Chandrasekar, V.: Polarimetric doppler weather radar; principles and applications, Cambridge University Press, Cambridge, 2001. a, b
Cardellach, E., Tomás, S., Oliveras, S., Padullés, R., Rius, A., de la Torre-Juárez, M., Turk, F. J., Ao, C. O., Kursinski, E. R., Schreiner, W. S., Ector, D., and Cucurull, L.: Sensitivity of PAZ LEO Polarimetric GNSS Radio-Occultation Experiment to Precipitation Events, IEEE T. Geosci. Remote, 53, 190–206, https://doi.org/10.1109/TGRS.2014.2320309, 2014. a
Cardellach, E., Padullés, R., Tomás, S., Turk, F. J., de la Torre-Juárez, M., and Ao, C. O.: Probability of intense precipitation from polarimetric GNSS radio occultation observations, Q. J. Roy. Meteor. Soc., https://doi.org/10.1002/qj.3161, 2017. a, b
Cardinali, C. and Healy, S. B.: Impact of GPS radio occultation measurements in the ECMWF system using adjoint-based diagnostics, Q. J. Roy. Meteor. Soc., 140, 2315–2320, https://doi.org/10.1002/qj.2300, 2014. a
Cucurull, L., Derber, J. C., Treadon, R., and Purser, R. J.: Assimilation of Global Positioning System Radio Occultation Observations into NCEP's Global Data Assimilation System, Mon. Weather Rev., 135, 3174–3193, https://doi.org/10.1175/MWR3461.1, 2007. a
Dee, D. P., Uppala, S. M., Simmons, A. J., Berrisford, P., Poli, P., Kobayashi, S., Andrae, U., Balmaseda, M. A., Balsamo, G., Bauer, P., Bechtold, P., Beljaars, A. C. M., van de Berg, L., Bidlot, J., Bormann, N., Delsol, C., Dragani, R., Fuentes, M., Geer, A. J., Haimberger, L., Healy, S. B., Hersbach, H., Hólm, E. V., Isaksen, L., Kallberg, P. W., Köhler, M., Matricardi, M., Mcnally, A. P., Monge-Sanz, B. M., Morcrette, J. J., Park, B. K., Peubey, C., de Rosnay, P., Tavolato, C., Thépaut, J. N., and Vitart, F.: The ERA-Interim reanalysis: Configuration and performance of the data assimilation system, Q. J. Roy. Meteor. Soc., 137, 553–597, https://doi.org/10.1002/qj.828, 2011. a
Fjeldbo, G., Kliore, A., and Eshleman, V. R.: The Neutral Atmosphere of Venus as Studied with the Mariner V Radio Occultation Experiments, Astron. J., 76, 123–140, https://doi.org/10.1086/111096, 1971. a
Foelsche, U., Syndergaard, S., Fritzer, J., and Kirchengast, G.: Errors in GNSS radio occultation data: relevance of the measurement geometry and obliquity of profiles, Atmos. Meas. Tech., 4, 189–199, https://doi.org/10.5194/amt-4-189-2011, 2011. a
Hajj, G. A., Kursinski, E. R., Romans, L. J., Bertiger, W. I., and Leroy, S. S.: A Technical Description of Atmospheric Sounding By Gps occultation, J. Atmos. Sol.-Terr. Phy., 64, 451–469, https://doi.org/10.1016/S1364-6826(01)00114-6, 2002. a
Healy, S. B. and Eyre, J. R.: Retrieving temperature, water vapour and surface pressure information from refractive index profiles derived by radio occultation: A simulation study, Q. J. Roy. Meteor. Soc., 126, 1661–1683, https://doi.org/10.1002/qj.49712656606, 2000. a
Healy, S. B., Jupp, A. M., and Marquardt, C.: Forecast impact experiment with GPS radio occultation measurements, Geophys. Res. Lett., 32, L03804, https://doi.org/10.1029/2004GL020806, 2005. a
Hersbach, H., Peubey, C., Simmons, A. J., Berrisford, P., Poli, P., and Dee, D.: ERA-20CM: A twentieth-century atmospheric model ensemble, Q. J. Roy. Meteor. Soc., 141, 2350–2375, https://doi.org/10.1002/qj.2528, 2015. a
Holloway, C. E. and Neelin, J. D.: Moisture Vertical Structure, Column Water Vapor, and Tropical Deep Convection, J. Atmos. Sci., 66, 1665–1683, https://doi.org/10.1175/2008JAS2806.1, 2009. a
Hou, A. Y., Kakar, R. K., Neeck, S., Azarbarzin, A. A., Kummerow, C. D., Kojima, M., Oki, R., Nakamura, K., and Iguchi, T.: The global precipitation measurement mission, B. Am. Meteorol. Soc., 95, 701–722, https://doi.org/10.1175/BAMS-D-13-00164.1, 2014. a
Huffman, G. J., Bolvin, D., Braithwaite, D., Hsu, K., Joyce, R., Kidd, C., Nelkin, E. J., Sorooshian, S., Tan, J., and Xie, P.: Algorithm Theoretical Basis Document (ATBD) of Integrated Multi-satellitE Retrievals for GPM (IMERG), version 5.2, Tech. Rep. March, available at: https://pmm.nasa.gov/sites/default/files/document_files/IMERG_ATBD_V5.2.pdf, last access: 8 August 2018. a
Jensen, A. S., Lohmann, M. S., Benzon, H. H., and Nielsen, A. S.: Full spectrum inversion of radio occultation signals, Radio Sci., 38, 1040, https://doi.org/10.1029/2002RS002763, 2003. a
Jones, R. C.: A new calculus for the treatment of optical systems, J. Opt. Soc. Am., 31, 488–493, https://doi.org/10.1364/JOSA.31.000488, 1941. a
Kozu, T., Iguchi, T., Shimomai, T., and Kashiwagi, N.: Raindrop size distribution modeling from a statistical rain parameter relation and its application to the TRMM precipitation radar rain retrieval algorithm, J. Appl. Meteorol. Clim., 48, 716–724, https://doi.org/10.1175/2008JAMC1998.1, 2009. a
Kummerow, C. D., Simpson, J., Thiele, O., Barnes, W., Chang, A. T. C., Stocker, E., Adler, R. F., Hou, A., Kakar, R., Wentz, F., Ashcroft, P., Kozu, T., Hong, Y., Okamoto, K., Iguchi, T., Kuroiwa, H., Im, E., Haddad, Z., Huffman, G., Ferrier, B., Olson, W. S., Zipser, E. J., Smith, E. A., Wilheit, T. T., North, G., Krishnamurti, T., and Nakamura, K.: The Status of the Tropical Rainfall Measuring Mission (TRMM) after Two Years in Orbit, J. Appl. Meteorol., 39, 1965–1982, https://doi.org/10.1175/1520-0450(2001)040<1965:TSOTTR>2.0.CO;2, 2000. a
Kursinski, E. R., Hajj, G. A., Schofield, J. T., Linfield, R. P., and Hardy, K. R.: Observing Earth's atmosphere with radio occultation measurements using the Global Positioning System, J. Geophys. Res., 102, 23429–23465, https://doi.org/10.1029/97JD01569, 1997. a, b, c
Liebe, H. J., Hufford, G. A., and Manabe, T.: A model for the complex permittivity of water at frequencies below 1 THz, Int. J. Infrared Milli., 12, 659–675, https://doi.org/10.1007/BF01008897, 1991. a
Lin, L., Zou, X., Anthes, R. A., and Kuo, Y. H.: COSMIC GPS Radio Occultation Temperature Profiles in Clouds, Mon. Weather Rev., 138, 1104–1118, https://doi.org/10.1175/2009MWR2986.1, 2010. a
Liu, C. and Zipser, E. J.: The global distribution of largest, deepest, and most intense precipitation systems, Geophys. Res. Lett., 42, 3591–3595, https://doi.org/10.1002/2015GL063776, 2015. a
Mishchenko, M. I., Travis, L. D., and Mackowski, D. W.: T-matrix computations of light scattering by nonspherical particles: A review, J. Quant. Spectrosc. Ra., 55, 535–575, https://doi.org/10.1016/0022-4073(96)00002-7, 1996. a
NOAA/NCEP: The GFS Atmospheric Model, NOAA/NCEP/Environmental Modeling Center, NCEP Office Note 442, 14 pp., 2003. a
Oguchi, T.: Electromagnetic wave propagation and scattering in rain and other hydrometeors, Proceedings of the IEEE, 71, 1029–1078, https://doi.org/10.1109/PROC.1983.12724, 1983. a
Padullés, R., Cardellach, E., de la Torre Juárez, M., Tomás, S., Turk, F. J., Oliveras, S., Ao, C. O., and Rius, A.: Atmospheric polarimetric effects on GNSS radio occultations: the ROHP-PAZ field campaign, Atmos. Chem. Phys., 16, 635–649, https://doi.org/10.5194/acp-16-635-2016, 2016. a
Pruppacher, H. R. and Beard, K. V.: A wind tunnel investigation of the internal circulation and shape of water drops falling at terminal velocity in air, Q. J. Roy. Meteor. Soc., 96, 247–256, https://doi.org/10.1002/qj.49709640807, 1970. a
Sokolovskiy, S. V.: Effect of superrefraction on inversions of radio occultation signals in the lower troposphere, Radio Sci., 38, 1058, https://doi.org/10.1029/2002RS002728, 2003. a
Sokolovskiy, S. V., Rocken, C., Schreiner, W. S., and Hunt, D. C.: On the uncertainty of radio occultation inversions in the lower troposphere, J. Geophys. Res., 115, D22111, https://doi.org/10.1029/2010JD014058, 2010. a
Thayer, G. D.: An improved equation for the radio refractive index of air, Radio Sci., 9, 803–807, https://doi.org/10.1029/RS009i010p00803, 1974. a
Tropical Rainfall Measuring Mission (TRMM): TRMM Combined Precipitation Radar and Microwave Imager Rainfall Profile L2 1.5 hours V7, Greenbelt, MD, Goddard Earth Sciences Data and Information Services Center (GES DISC), available at: https://disc.gsfc.nasa.gov/datacollection/TRMM_2B31_7.html (last access: 13 August 2018), 2011.
Vergados, P., Mannucci, A. J., Ao, C. O., Jiang, J. H., and Su, H.: On the comparisons of tropical relative humidity in the lower and middle troposphere among COSMIC radio occultations and MERRA and ECMWF data sets, Atmos. Meas. Tech., 8, 1789–1797, https://doi.org/10.5194/amt-8-1789-2015, 2015. a
Vorob'ev, V. V. and Krasil'nikova, T. G.: Estimation of the accuracy of the atmospheric refractive index recovery from Doppler shift measurements at frequencies used in the NAVSTAR system, Izv. Atmos. Ocean. Phys, 29, 602–609, 1994. a
Wang, K.-N., de la Torre Juárez, M., Ao, C. O., and Xie, F.: Correcting negatively biased refractivity below ducts in GNSS radio occultation: an optimal estimation approach towards improving planetary boundary layer (PBL) characterization, Atmos. Meas. Tech., 10, 4761–4776, https://doi.org/10.5194/amt-10-4761-2017, 2017. a
Xie, F., Syndergaard, S., Kursinski, E. R., and Herman, B. M.: An approach for retrieving marine boundary layer refractivity from GPS occultation data in the presence of superrefraction, J. Atmos. Ocean. Tech., 23, 1629–1644, https://doi.org/10.1175/JTECH1996.1, 2006. a
Xie, F., Wu, D. L., Ao, C. O., Mannucci, A. J., and Kursinski, E. R.: Advances and limitations of atmospheric boundary layer observations with GPS occultation over southeast Pacific Ocean, Atmos. Chem. Phys., 12, 903–918, https://doi.org/10.5194/acp-12-903-2012, 2012. a
Yang, S. and Zou, X.: Assessments of cloud liquid water contributions to GPS radio occultation refractivity using measurements from COSMIC and CloudSat, J. Geophys. Res., 117, D06219, https://doi.org/10.1029/2011JD016452, 2012. a
Yang, S. and Zou, X.: Dependence of positive refractivity bias of GPS RO cloudy profiles on cloud fraction along GPS RO limb tracks, GPS Solutions, 21, 499–509, https://doi.org/10.1007/s10291-016-0541-1, 2016. a
Zou, X., Yang, S., and Ray, P. S.: Impacts of Ice Clouds on GPS RO Measurements, J. Atmos. Sci., 69, 3670–3682, https://doi.org/10.1175/JAS-D-11-0199.1, 2012. a