the Creative Commons Attribution 4.0 License.
the Creative Commons Attribution 4.0 License.
 | 17 Aug 2018
Climatology of mesopause region nocturnal temperature, zonal wind and sodium density observed by sodium lidar over Hefei, China (32° N, 117° E)
Chao Ban
Xin Fang
Jing Li
Zhaopeng Wu
Wuhu Feng
John M. C. Plane
Jiangang Xiong
Daniel R. Marsh
Michael J. Mills
Xiankang Dou
The University of Science and Technology of China narrowband sodium temperature and wind lidar, located in Hefei, China (32∘ N, 117∘ E), has made routine nighttime measurements since January 2012. A total of 154 nights (∼ 1400 h) of vertical profiles of temperature, sodium density, and zonal wind and 83 nights (∼ 800 h) of vertical flux of gravity wave (GW) zonal momentum in the mesopause region (80–105 km) were obtained during the period from 2012 to 2016. For temperature, it is most likely that the diurnal tide dominates below 100 km in spring, while the semidiurnal tide dominates above 100 km throughout the year. A clear semiannual variation in temperature is revealed near 90 km, in phase with the tropical mesospheric semiannual oscillation (MSAO). The variability in sodium density is positively correlated with temperature below 95 km, suggesting that in addition to dynamics, the chemistry also plays an important role in the formation of sodium atoms. The seasonal variability in sodium density observed by both lidar and satellite generally agrees well with a whole atmosphere model simulation using an updated meteoric input function which includes different cosmic dust sources. For zonal wind, the diurnal tide dominates in both spring and fall, while semidiurnal tide dominates in winter. The observed semiannual variation in zonal wind near 90 km is out of phase with that in temperature, consistent with the tropical MSAO. The lidar observations generally agree with satellite and meteor radar observations as well as model simulations at similar latitude. The 50–70 % of zonal momentum flux is induced by short-period (10 min–2 h) GWs. The large zonal momentum flux in summer and winter due to short-period GWs is clearly anticorrelated with eastward zonal wind maxima below 90 km, suggesting the filtering of short-period GWs by the SAO wind.


The temperature and wind in the mesopause region (80–105 km) are key atmospheric parameters for studying the dynamics in this region. Ground-based instruments (e.g., lidars, radars) and spaceborne instruments have been widely used to measure these key parameters over several decades (Vincent and Reid, 1983; She et al., 1998; Wu et al., 2008). Satellites can provide a near-global view of the mesopause region, but their local coverage is usually limited to two local times during the ascending and descending orbits. The lack of continuous coverage in local time makes it difficult to extract information on short-period gravity wave (GW) perturbations from satellite data (Preusse et al., 2009). Ground-based meteor or medium-frequency radars are capable of measuring mesopause wind in a continuous mode but do not provide direct temperature measurements with sufficient accuracy and vertical resolution (Vincent and Reid, 1983). However, a narrowband sodium lidar is able to simultaneously measure mesopause region temperature and horizontal wind by utilizing the sodium high-resolution spectrum (She et al., 1994; Arnold and She, 2003), which provides a unique opportunity to study GW perturbations and their breaking process in the mesopause region (Li et al., 2005, 2007).
The long-term lidar observations have been used to study the seasonal variability in mesopause region temperature (She et al., 1998; Gardner et al., 2002; Xu et al., 2006; Friedman et al., 2007) and horizontal wind (Franke et al., 2005; Gardner et al., 2007), as well as sodium density (She et al., 2000; Gardner et al., 2005; Ejiri et al., 2010; Yi et al., 2009; Yuan et al., 2012), iron density (Yi et al., 2009; Lübken et al., 2011) and potassium density (Friedman et al., 2002; Plane et al., 2015). These datasets are extremely valuable to validate satellite results (Xu et al., 2006; Fan et al., 2007a; Dawkins et al., 2014) and improve general circulation models (Yuan et al., 2008; Feng et al., 2013; Marsh et al., 2013a). When GWs break or dissipate in the mesopause region due to increased amplitudes or approaching critical level (where wave phase speed is equal to horizontal background wind), they tend to deposit wave energy and momentum into the background flow and further modify the temperature and wind near the breaking region (Lindzen et al., 1981; Liu and Hagan, 1998; Li et al., 2007). Therefore, measurements of the GW vertical flux of horizontal momentum and heat are critical for evaluating the GW contribution to the background state in this region, and their key roles in the dynamic coupling between lower and middle–upper atmosphere (Li et al., 2013, 2016).
The vertical flux of horizontal momentum can be directly derived from the vertical wind perturbation and associated horizontal wind perturbation. To ensure accuracy of the GW momentum flux, the wind data must have high temporal and vertical resolutions with good precision and a long time average (Kudeki and Franke, 1998; Thorsen et al., 2000). Several studies of lidar-observed GW momentum flux in the mesosphere–lower thermosphere (MLT) region have been carried out previously (Espy et al., 2004; Gardner and Liu, 2007; Acott et al., 2011).
In this paper, we present the seasonal variation in sodium density, temperature, zonal wind and GW zonal momentum flux observed by the University of Science and Technology of China (USTC) sodium temperature and wind lidar from January 2012 to December 2016 over Hefei, China (32∘ N, 117∘ E). This is the first time simultaneous observations of the seasonal variability in mesopause region temperature, zonal wind and GW momentum flux by sodium lidar over the eastern Asia region have been reported. We compare the lidar results with temperature observed by the Sounding of the Atmosphere Using Broadband Emission Radiometry (SABER) instrument onboard the Thermosphere–Ionosphere–Mesosphere Energetics and Dynamics (TIMED) satellite (Russell III et al., 1999), zonal wind observed by a nearby meteor radar (Xiong et al., 2004), and sodium density observed by the Optical Spectrograph and Infrared Imager System (OSIRIS) onboard the Odin satellite (Llewellyn et al., 2004). These measurements are then compared with simulations from the Whole Atmosphere Community Climate Model version 5 (WACCM) (Marsh et al., 2013a; Mills et al., 2016; Feng et al., 2017) using an updated meteoric input function (MIF) for Na (Cárrillo-Sanchez et al. 2016). The instruments, datasets and data analysis method are described in Sect. 2, followed by the results of temperature and sodium density in Sect. 3, and zonal wind and GW zonal momentum flux in Sect. 4. A summary is provided in Sect. 5.
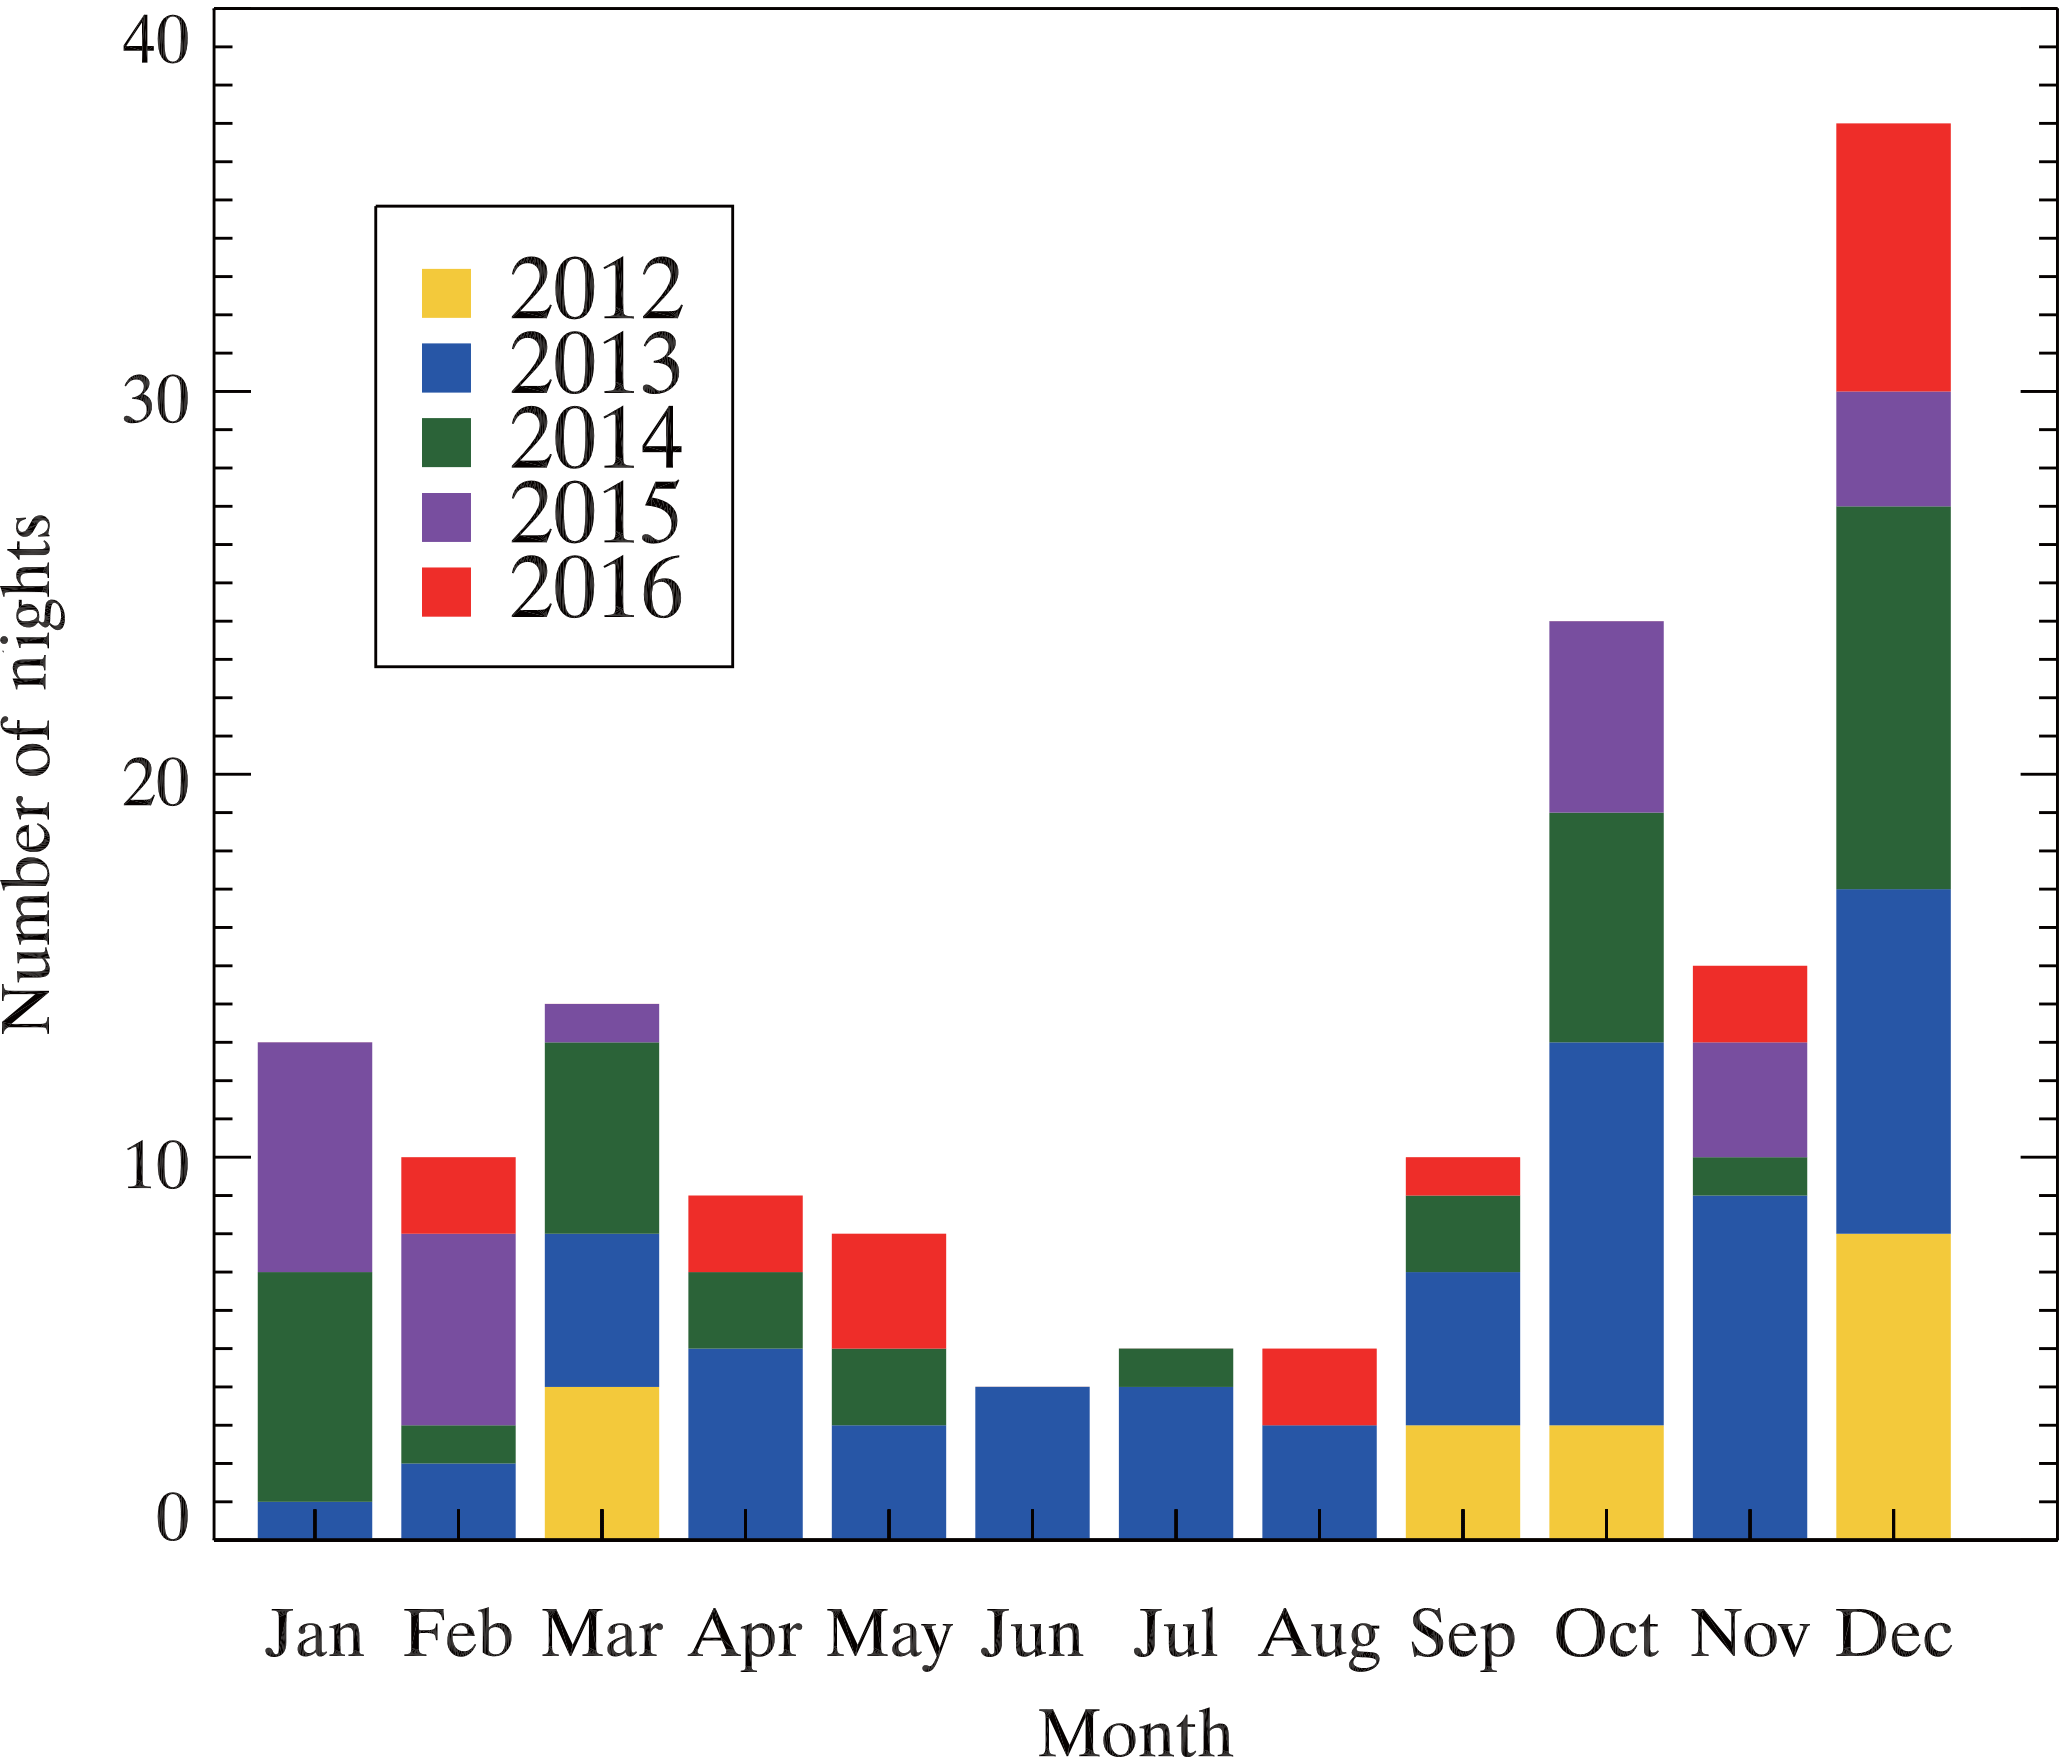
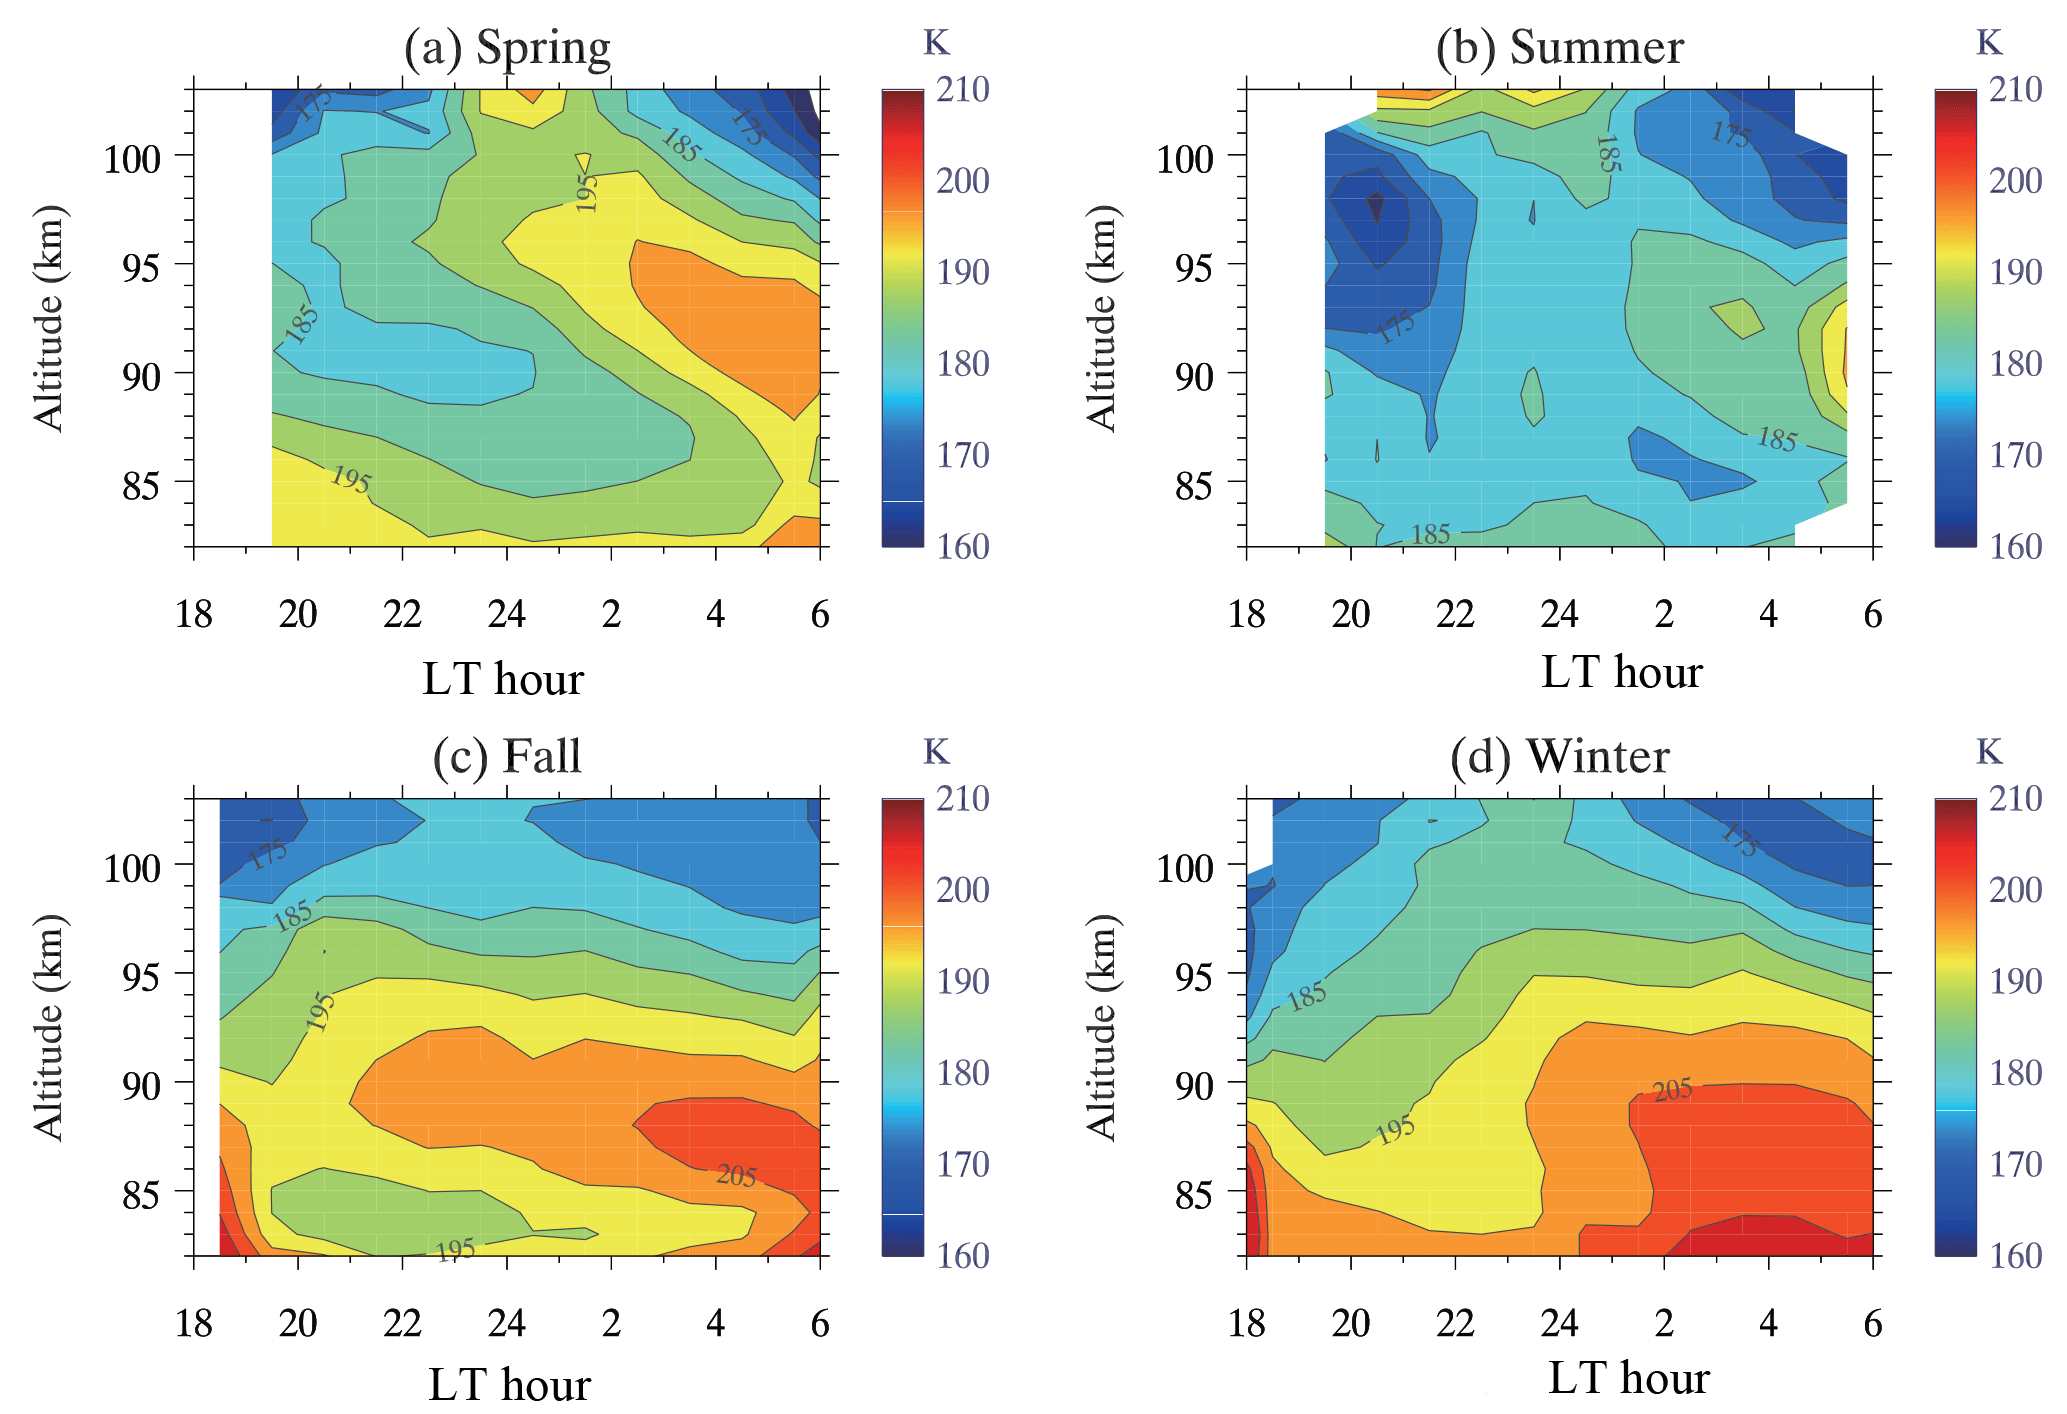
Figure 2Lidar-observed nighttime hourly mean temperature composite in (a) spring, (b) summer, (c) fall and (d) winter.
The USTC sodium temperature and wind lidar, located on campus in Hefei, China (32∘ N, 117∘ E), utilizes a narrowband three-frequency design and can simultaneously observe sodium density, zonal wind and temperature in the mesopause region during nighttime clear-sky conditions (Li et al., 2012). The system was initially set up in October 2011 with two receiving telescopes (30 in. diameter) pointing eastward and northward 30∘ from the zenith for measuring the zonal and meridional wind, respectively. The output laser beam is split into two beams, each aligned parallel to one telescope. Between December 2012 and May 2014 (total of 83 nights), the two receiving telescopes were pointed eastward and westward, each 15∘ from the zenith. This dual-beam setup allows us to derive the GW zonal momentum flux as well as the zonal wind. Since June 2014, the westward telescope has been pointed vertically for measuring the vertical fluxes of heat and sodium atoms, and the eastward telescope has been pointed to 30∘ from the zenith for measuring zonal wind. Between January 2012 and December 2016, we obtained 154 nights (∼ 1400 h) of valid data, which is sufficient to study the seasonal variations in sodium density, temperature, zonal wind and GW momentum flux (83 nights) in the mesopause region over Hefei. Figure 1 shows the number of nights with valid datasets in each month of the different years. It is clear that Hefei has more clear nights in fall and winter than in spring and summer.
The Wuhan (31∘ N, 114∘ E) meteor radar, located ∼ 300 km west of Hefei, has measured mesopause region horizontal wind since January 2002 (Xiong et al., 2004). The vertical and temporal resolutions of radar wind are 3 km and 2 h, respectively. The SABER instrument onboard the TIMED satellite can measure the near-global vertical profile of temperature from the lower stratosphere to the lower thermosphere (Russell III et al., 1999). The SABER temperature dataset used in this paper is Level 2A version 2.0, which has a vertical resolution of 2 km and accuracies of ±1–2 K between 75 and 95 km, increasing to ±4 K at 100 km. The OSIRIS instrument onboard the Odin satellite measures solar-pumped Na resonance fluorescence from a sun-synchronous polar orbit (Llewellyn et al., 2004), and the datasets can be used to retrieve the global vertical profiles of sodium density between 75 and 110 km with a ∼ 10 % uncertainty for 2 km vertical resolution (Gumbel et al., 2007; Fan et al., 2007a).
To compare with lidar results, we also use the temperature, zonal wind and sodium density simulated by the WACCM, a chemistry–climate model which extends from the Earth's surface to the lower thermosphere (∼ 140 km) (Garcia et al., 2007; Marsh et al., 2013a). WACCM uses the framework from the fully coupled global climate model Community Earth System Model (CESM version 1; e.g., Hurrell et al., 2013). In this paper, we use a version of WACCM described in Mills et al. (2016), which includes all the detailed physical processes as described in the Community Atmosphere Model, version 5 (CAM5) (Neale et al., 2012). The current configurations for WACCM are based on a finite-volume dynamical core (Lin, 2004) for the tracer advection as well as a new surface topography data from Lauritzen et al. (2015). WACCM has the fully interactive chemistry described in Mills et al. (2016), and we have included the Na chemistry scheme listed in Plane et al. (2015) and Gómez Martin et al. (2016, 2017), with an updated MIF for Na (Cárrillo-Sanchez et al., 2016). The new MIF is calculated for the ablation of cosmic dust particles from Jupiter-family comets (80 % by mass), asteroids (8 %) and long-period comets (12 %), and the injection rate of Na is about 8 times larger than that used in Marsh et al. (2013b). The peak Na ablation rate from Cárrillo-Sanchez et al. (2016) occurs around 87 km, which is ∼ 15 km lower than the MIF used in Marsh et al. (2013b), which was based on meteor head radar measurements that were biased to the high-velocity dust particles that mostly originate from long-period comets (Carrillo-Sánchez et al., 2016). The absolute Na MIF used in this paper has been divided by a factor of 5 from that in Carrillo-Sánchez et al. (2016) in order to match the observed Na layer density. This most likely reflects the fact that WACCM underestimates the rate of vertical transport of Na species in the MLT because sub-grid gravity waves are not resolved in the model (Huang et al., 2015). The horizontal resolution of WACCM is 1.9∘ latitude by 2.5∘ longitude. The vertical model layers and the vertical resolution are the same as in Mills et al. (2017), which are 70 and ∼ 3 km in the MLT region. Although the model can be nudged by a reanalysis dataset, in the current study we have used a “free-running” model simulation, which produces a satisfactory Na climatology in the model. We ran the model for conditions for the year 2000 for 13 years.
The lidar raw photon counts are first analyzed to generate hourly mean vertical profiles of sodium density, temperature and line-of-sight (LOS) wind with 2 km vertical resolution for each direction. Before and after the dual-beam setup (eastward–westward) between December 2012 and May 2014, we assume that the hourly mean vertical wind is negligible and then derive the hourly mean zonal wind from the east channel LOS wind (eastward pointing at 30∘ from the zenith). During the dual-beam setup, we derive the hourly mean zonal wind profiles by subtracting the hourly westward LOS wind from the eastward LOS wind and then dividing by 2sinθ (e.g., θ = 15∘) (Vincent and Reid, 1983). The uncertainties of the hourly mean zonal wind and temperature typically range from ∼ 1.0 m s−1 and ∼ 0.5 K at 92 km (Na peak layer) to ∼ 6 m s−1 and ∼ 5 K at 82 km and 103 km (the edge of the Na layer). We then generate the nighttime hourly mean composite in each season.
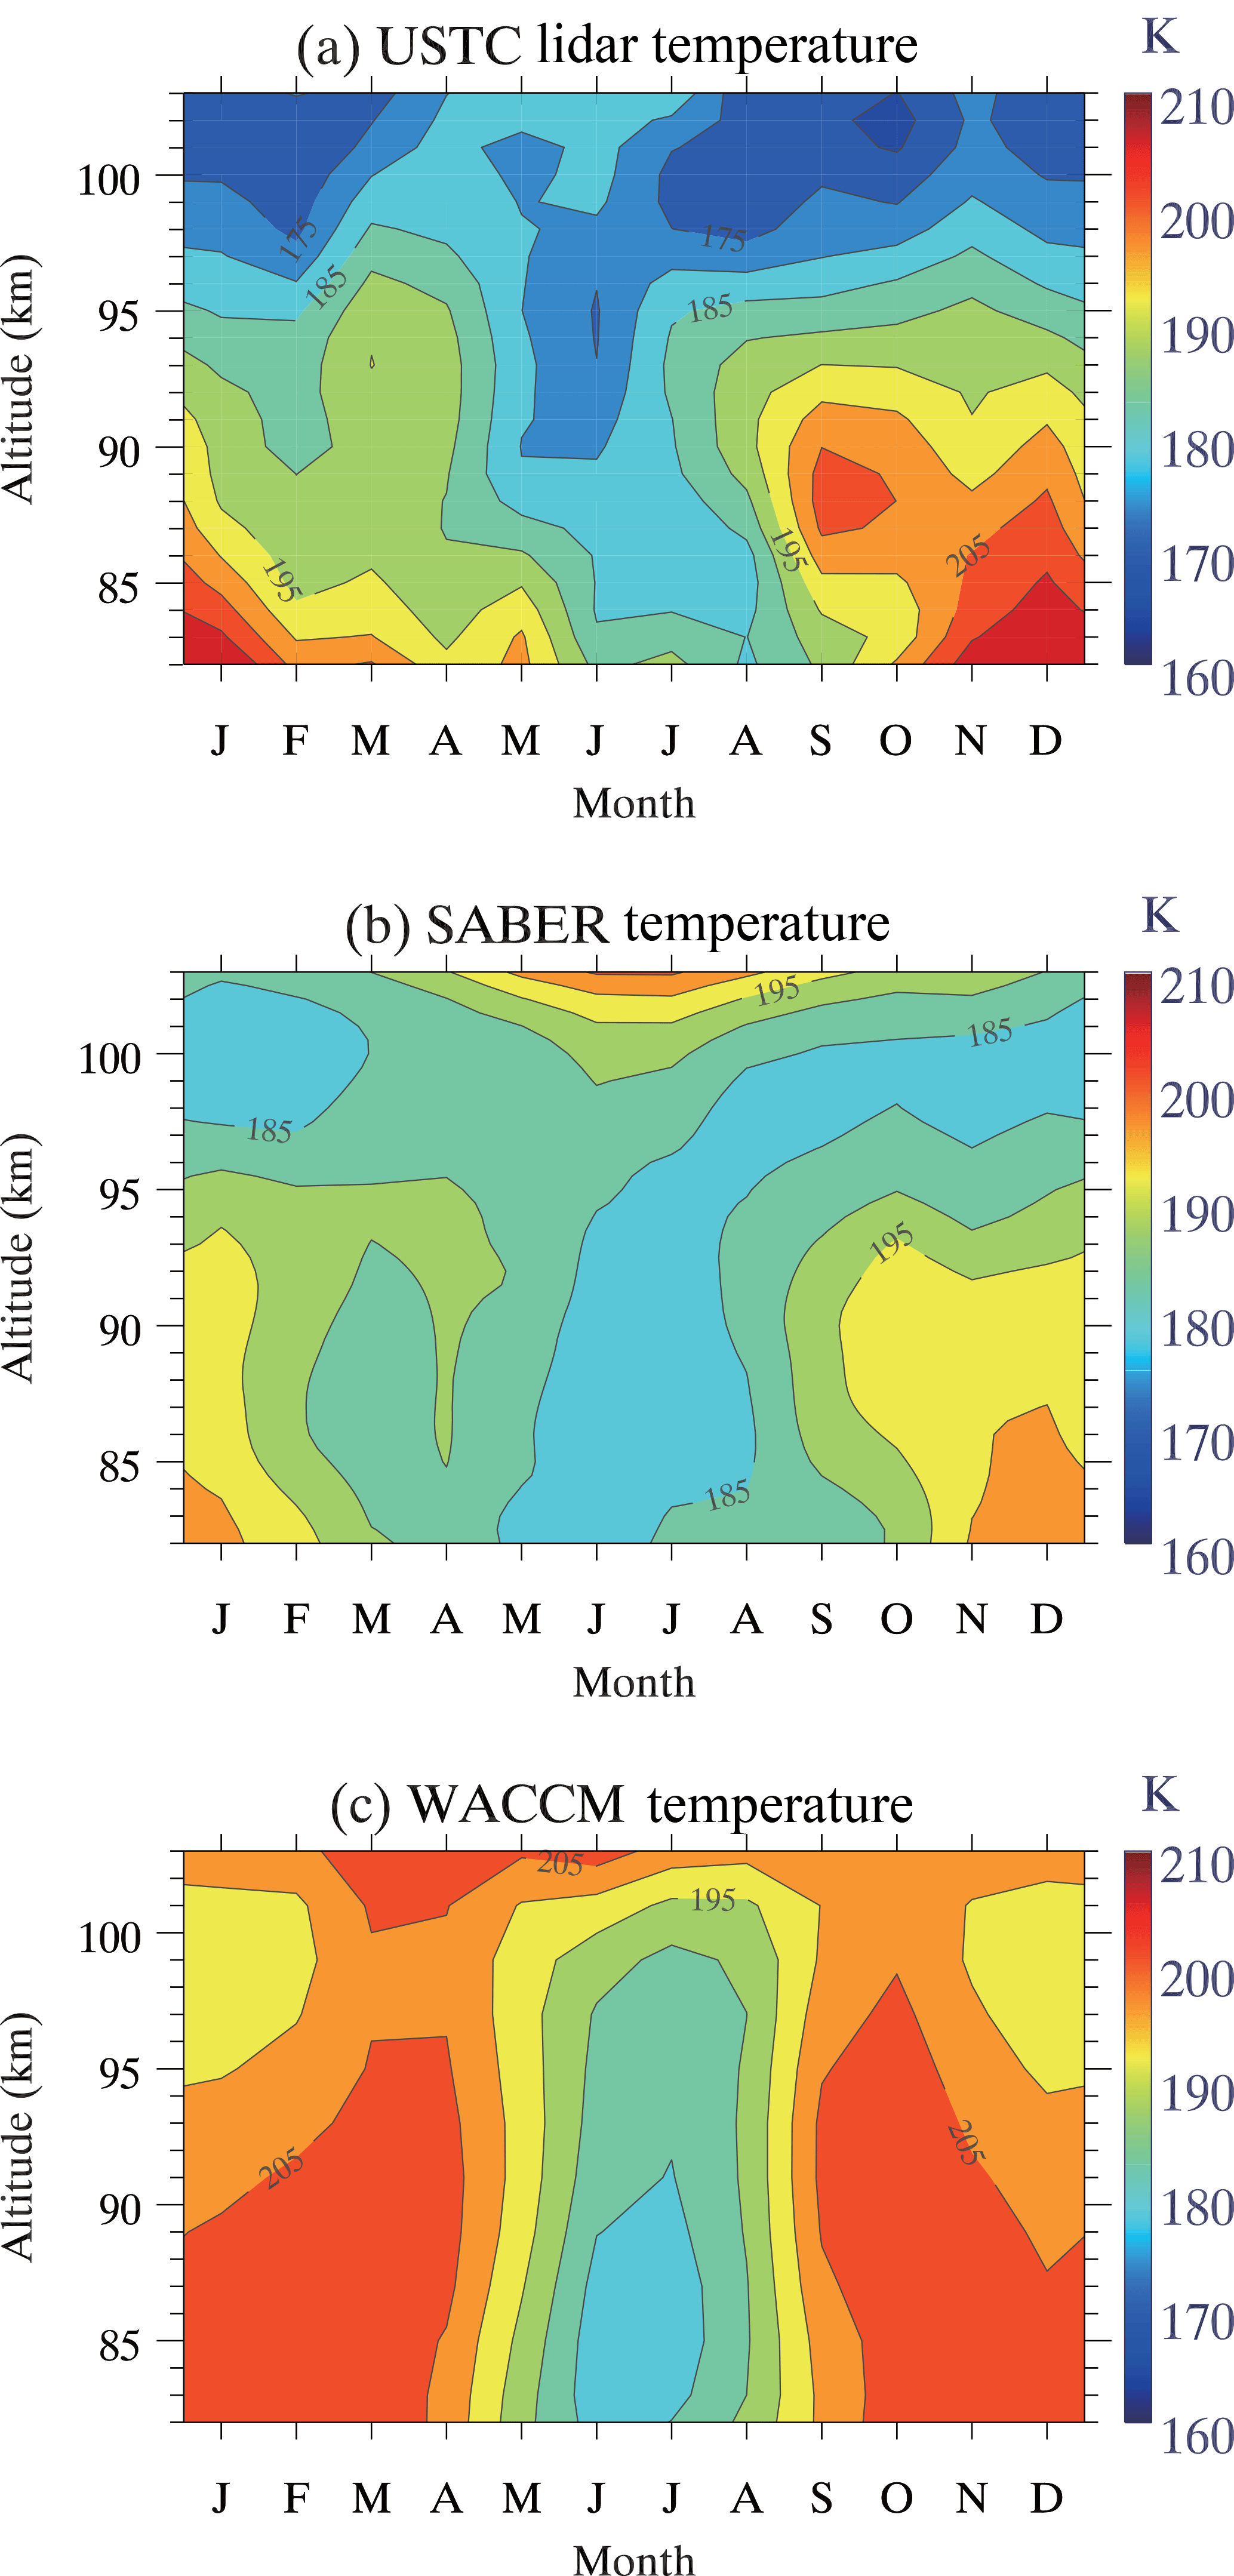
Figure 3Monthly mean of nightly mean temperature observed by (a) lidar and (b) SABER and simulated by (c) WACCM.

Vincent and Reid (1983) presented a method utilizing the dual-beam technique to derive vertical flux of GW horizontal momentum, when two beams are pointed at equal and opposite angle θ from the zenith. The zonal momentum flux is calculated as follows:
where and are the square of the LOS wind perturbations in the east and west channels, respectively, and θ is the zenith angle (e.g., 15∘). To derive the momentum flux, we employed a similar procedure to that of Gardner and Liu (2007). Briefly, we first analyze lidar raw photon counts to generate the LOS wind with a temporal resolution of 5 min and a vertical resolution of 2 km. Data points with errors larger than 5 m s−1 were discarded during the quality check. We remove the linear trend and nightly mean from the LOS wind to form wind perturbations for each night. Data for which the perturbation variances are smaller than the corresponding noise variances are also excluded. The seasonal mean vertical profile of perturbation variance is then obtained by averaging all available perturbation variances in that season. This process is carried out separately for each beam. Finally, the seasonal mean momentum flux is calculated using Eq. (1). In this way, the results only account for the GW perturbations with periods of 10 min–20 h and vertical wavelengths of 4–30 km. We also apply a high-pass filter with cutoff at 2 h on raw perturbations to examine the relative contribution of short-period GWs (10 min–2 h) to total momentum flux.
Since the meteor radar observed zonal wind is only available in 2013, we then calculate monthly mean with all available data for comparison. The SABER tracking points within the ±5∘ latitude band (27–37∘ N) and longitude band (112–122∘ E) of the lidar site are selected first. We then discard the SABER temperature profiles that are outside of the lidar observation period. Finally, we average all available SABER temperature profiles within each month to form the monthly mean for comparison. A similar analysis method is used for the OSIRIS data. In the case of WACCM, the zonal mean data are first extracted at the coordinates of the lidar site and then the monthly mean profiles are generated in the same way as the lidar and radar profiles.
Figure 2 shows the hourly mean temperature composite in four different seasons. The temperatures below 95 km are generally warmer in fall and winter than in spring and summer, consistent with the mesospheric residual meridional circulation with upwelling in the summer hemisphere and downwelling in the winter hemisphere (Andrews et al., 1987; Smith, 2012). It is most likely that the diurnal tide with downward phase progression dominates below 100 km in spring, although we only have 10–12 h data. However, the tidal feature is not clear below 95 km in other seasons. The temperature above 100 km in all seasons clearly exhibits two minima after dusk and before dawn and a maximum near midnight, suggesting dominance and persistence of the semidiurnal tide in this latitude region throughout the year.
The clear downward phase progression of diurnal and semidiurnal tides in mesopause temperature was previously observed by sodium lidar at the Starfire Optical Range (SOR), New Mexico (35∘ N, 107∘ W) (Chu et al., 2005). However, their observations suggest a clear dominance of diurnal tides in April and October and semidiurnal tides in January below 100 km, while we see a clear dominance of diurnal tides only in spring (March–May) and mixed features in other seasons. In addition, the midnight maximum above 100 km shown in our results is not observed over SOR. The SABER observations reveal a diurnal amplitude of ∼ 2 and ∼ 8 K and a semidiurnal amplitude of ∼ 7 and ∼ 12 K at 95 km for the USTC and SOR lidar sites, respectively (Zhang et al., 2010). This significant longitudinal variability is likely due to nonlinear interactions among the migrating tide, non-immigrating tide (Forbes et al., 2003) and stationary planetary wave number 1 (Lieberman et al., 1991) and/or tidal–GW interactions (Lindzen, 1981; Liu and Hagan, 1998; Li et al., 2007, 2009). The clear longitudinal variability in tides between two lidar sites could thus cause significant differences in the nocturnal climatology.
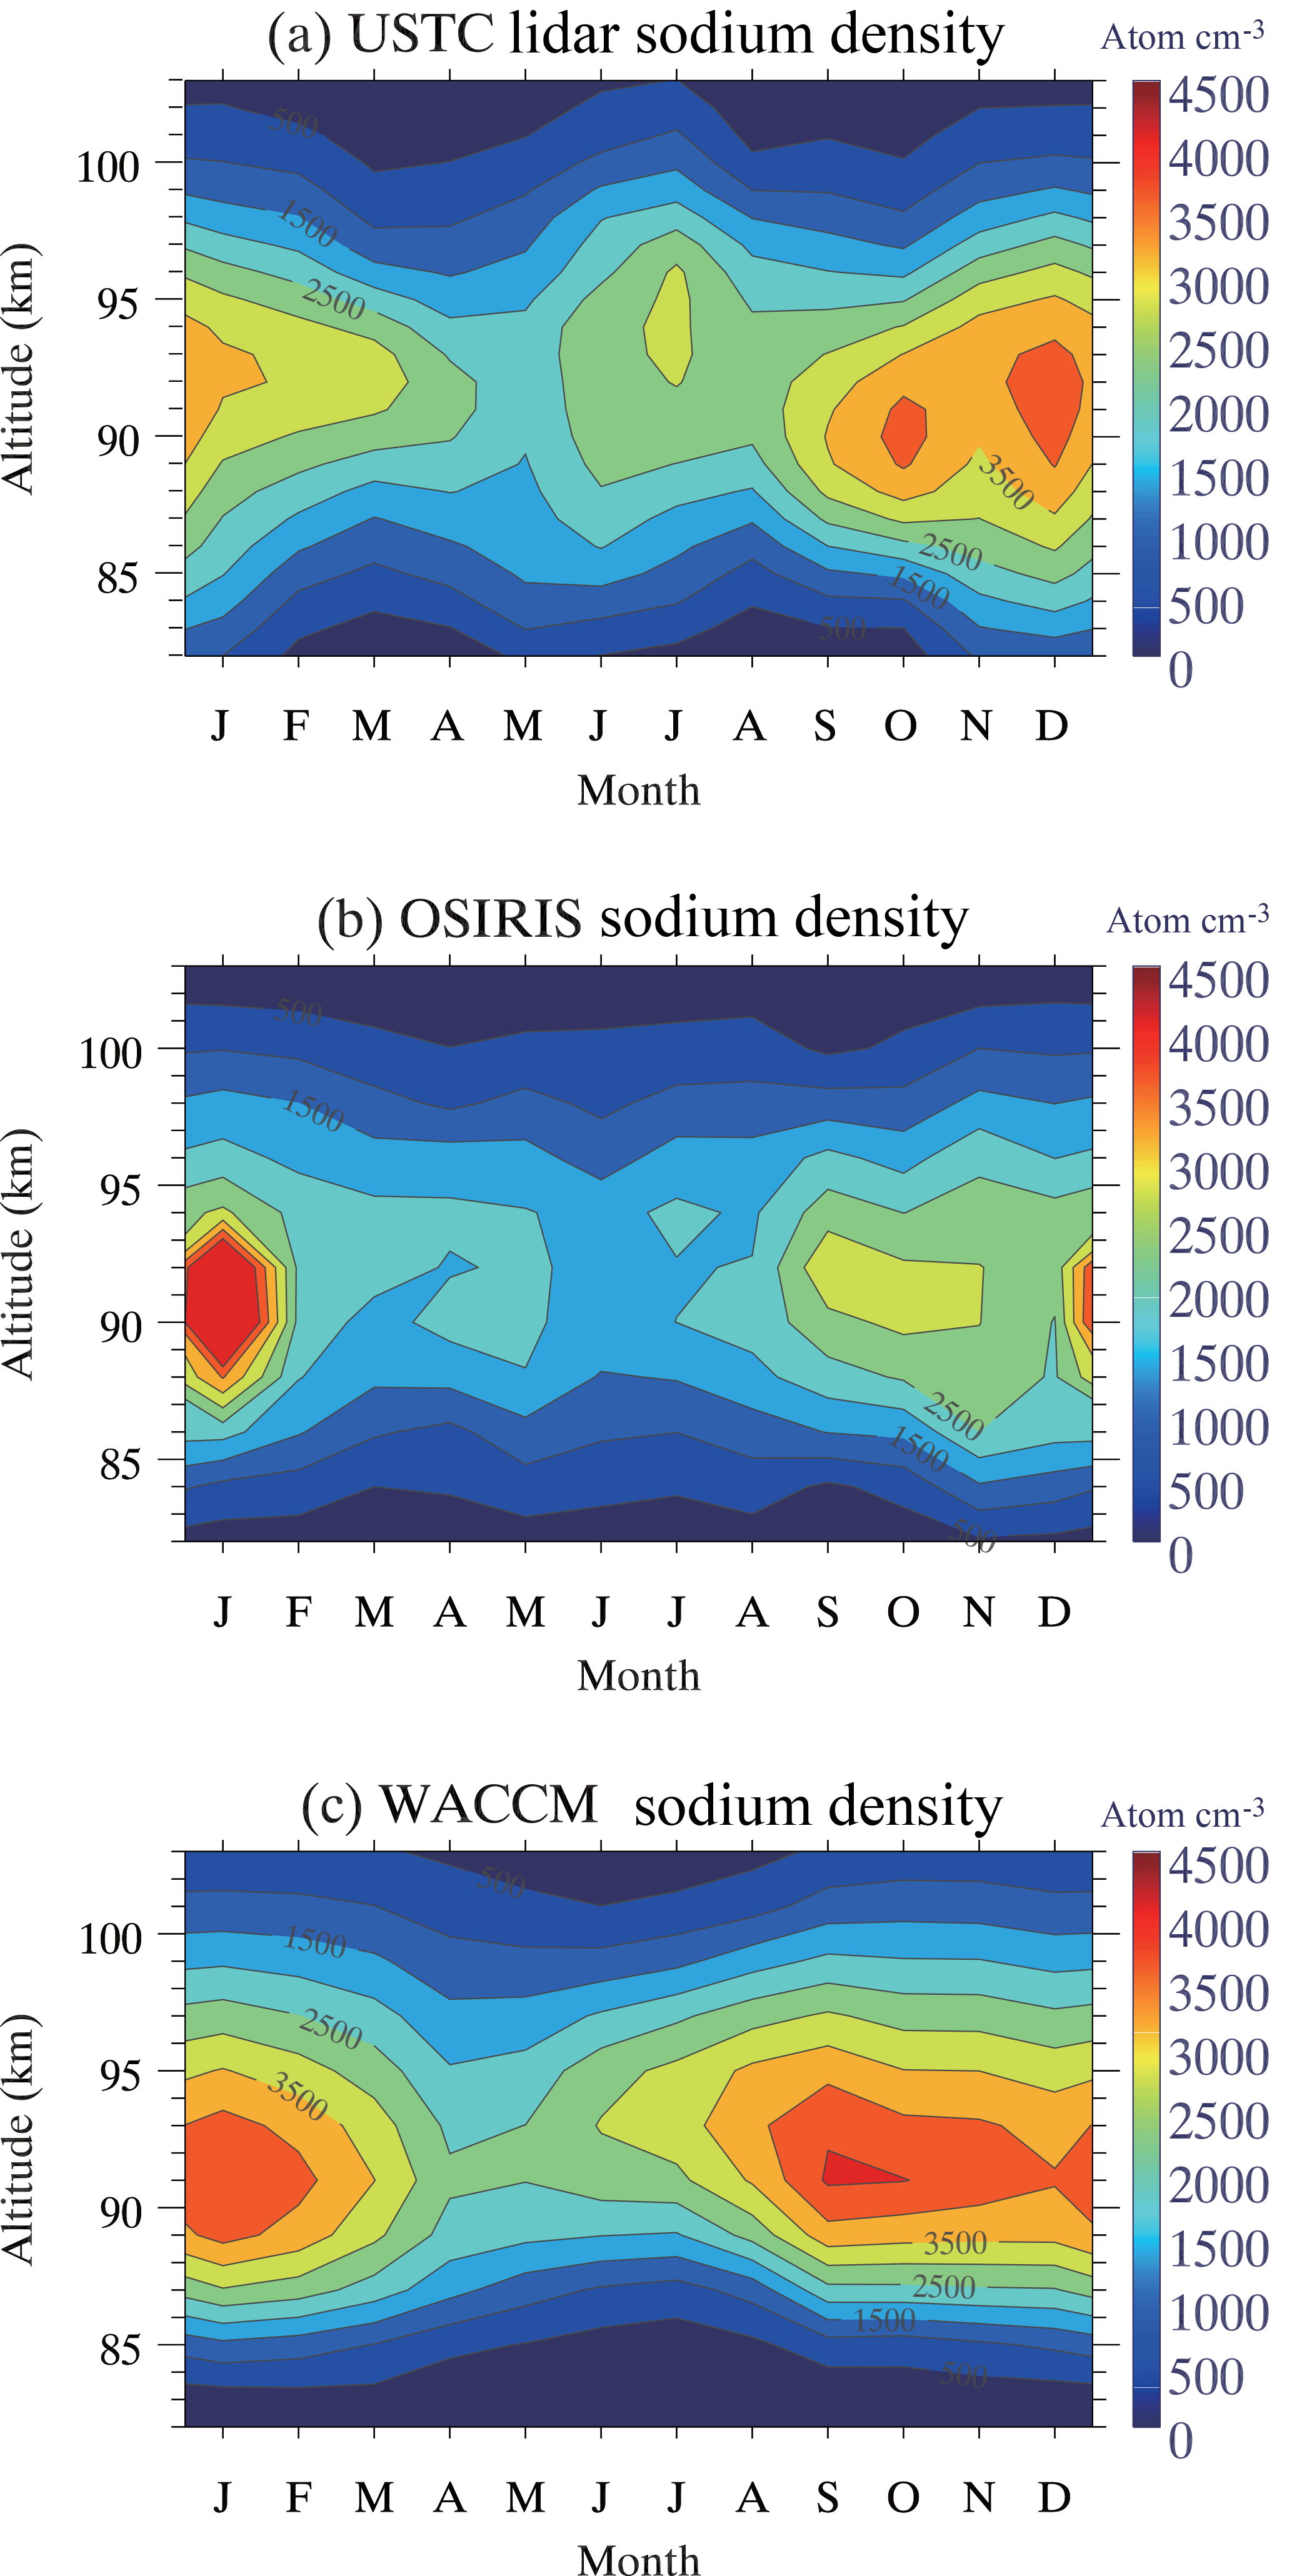
Figure 5Monthly mean of nightly mean sodium density observed by (a) lidar and (b) Odin-OSIRIS and simulated by (c) WACCM.
Figure 3 shows the monthly mean of the nightly mean temperature observed by lidar and SABER and simulated by WACCM. All three figures show qualitative agreement in the general pattern, but difference in absolute values. The mesopause is clearly located near 100 km in winter and below 95 km in summer, indicating a two-level mesopause as previously observed at midlatitudes and high latitudes (von Zahn et al., 1996; She et al., 1998). The lidar-observed temperature above 95 km is ∼ 10 K lower than that for SABER, likely due either to the low signal-to-noise ratio in the lidar return signals above 100 km (Li et al., 2012) or to a nonlocal thermal equilibrium influence in the SABER analysis (Mertens et al., 2001). The lidar-observed mesopause is also 5–10 K colder than that observed by SABER. The WACCM-simulated temperature is clearly higher than both sets of observations at most altitudes and months. Yuan et al. (2008) showed a significant monthly mean mesopause region temperature difference between lidar observations and WACCM simulations over Fort Collins, CO (41∘ N, 105∘ W); their comparisons show that the WACCM-simulated winter mesopause is much warmer than measured by lidar, and the summer mesopause is ∼ 3 km lower than lidar observations. Another interesting feature in all three figures is that we see a temperature maximum near ∼ 90 km in March and April and a second maximum in September and October, likely related to the mesospheric semiannual oscillation (MSAO), which is dominant in the equatorial middle atmosphere (Dunkerton, 1982; Burrage et al., 1996; Garcia et al., 1997).
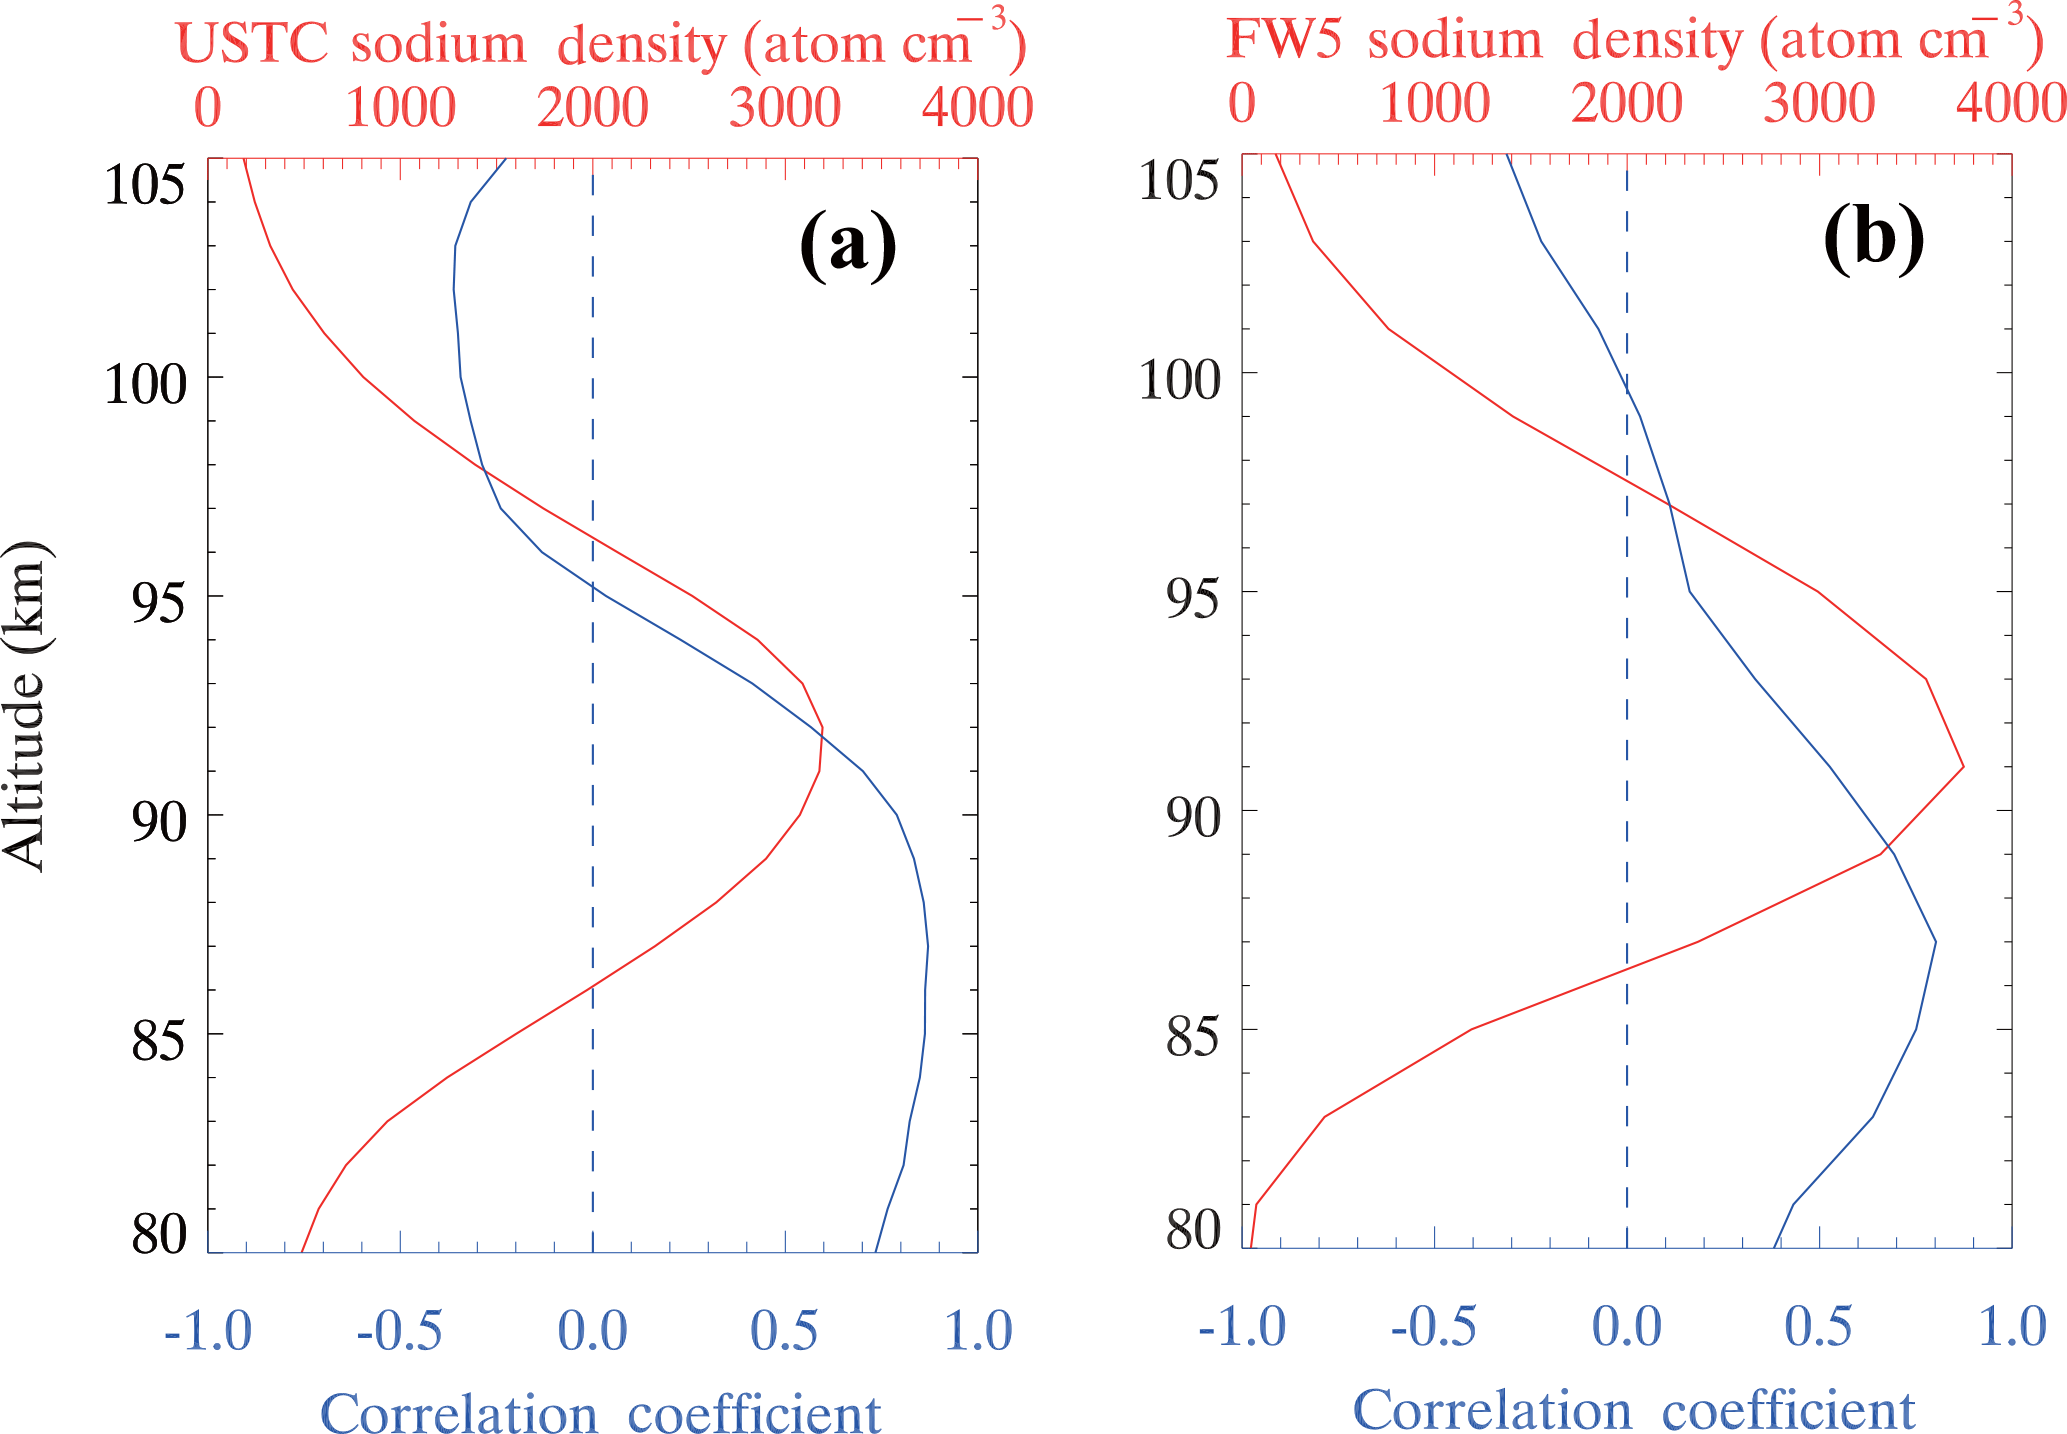
Figure 6The vertical profiles of correlation coefficient (blue) between composite temperature and relative sodium density perturbations, and annual mean sodium density (red), observed by lidar (a) and simulated by WACCM (b).

Table 1Comparison of the GW zonal momentum flux (m2 s−2) measured at different middle latitude lidar and radar stations.
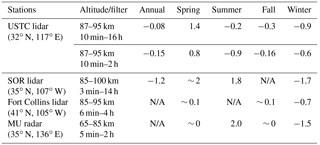
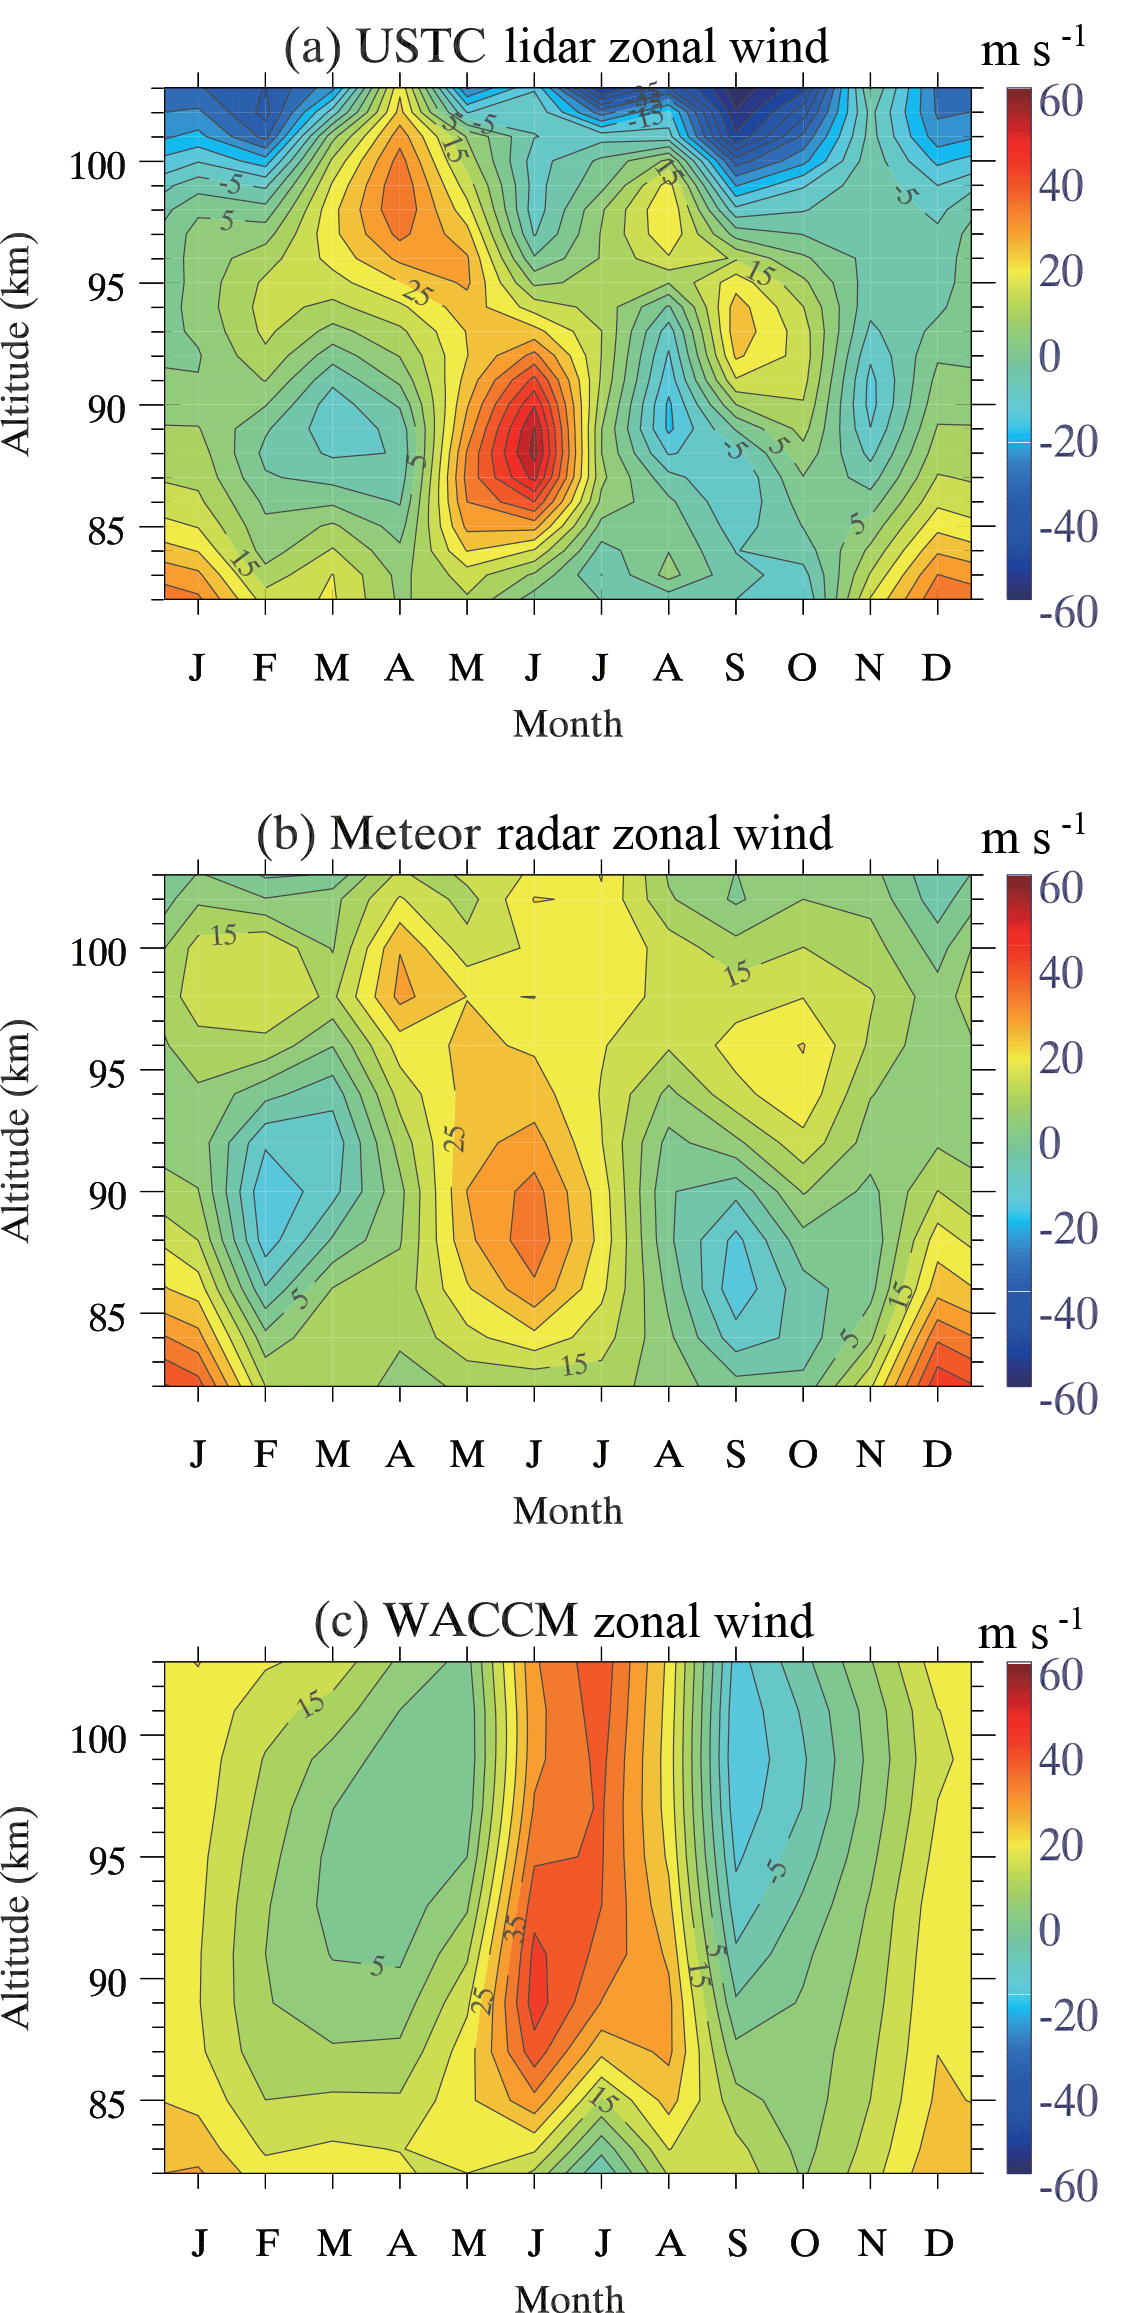
Figure 8Monthly mean of nightly mean zonal wind observed by (a) lidar and (b) meteor radar and simulated by (c) WACCM.
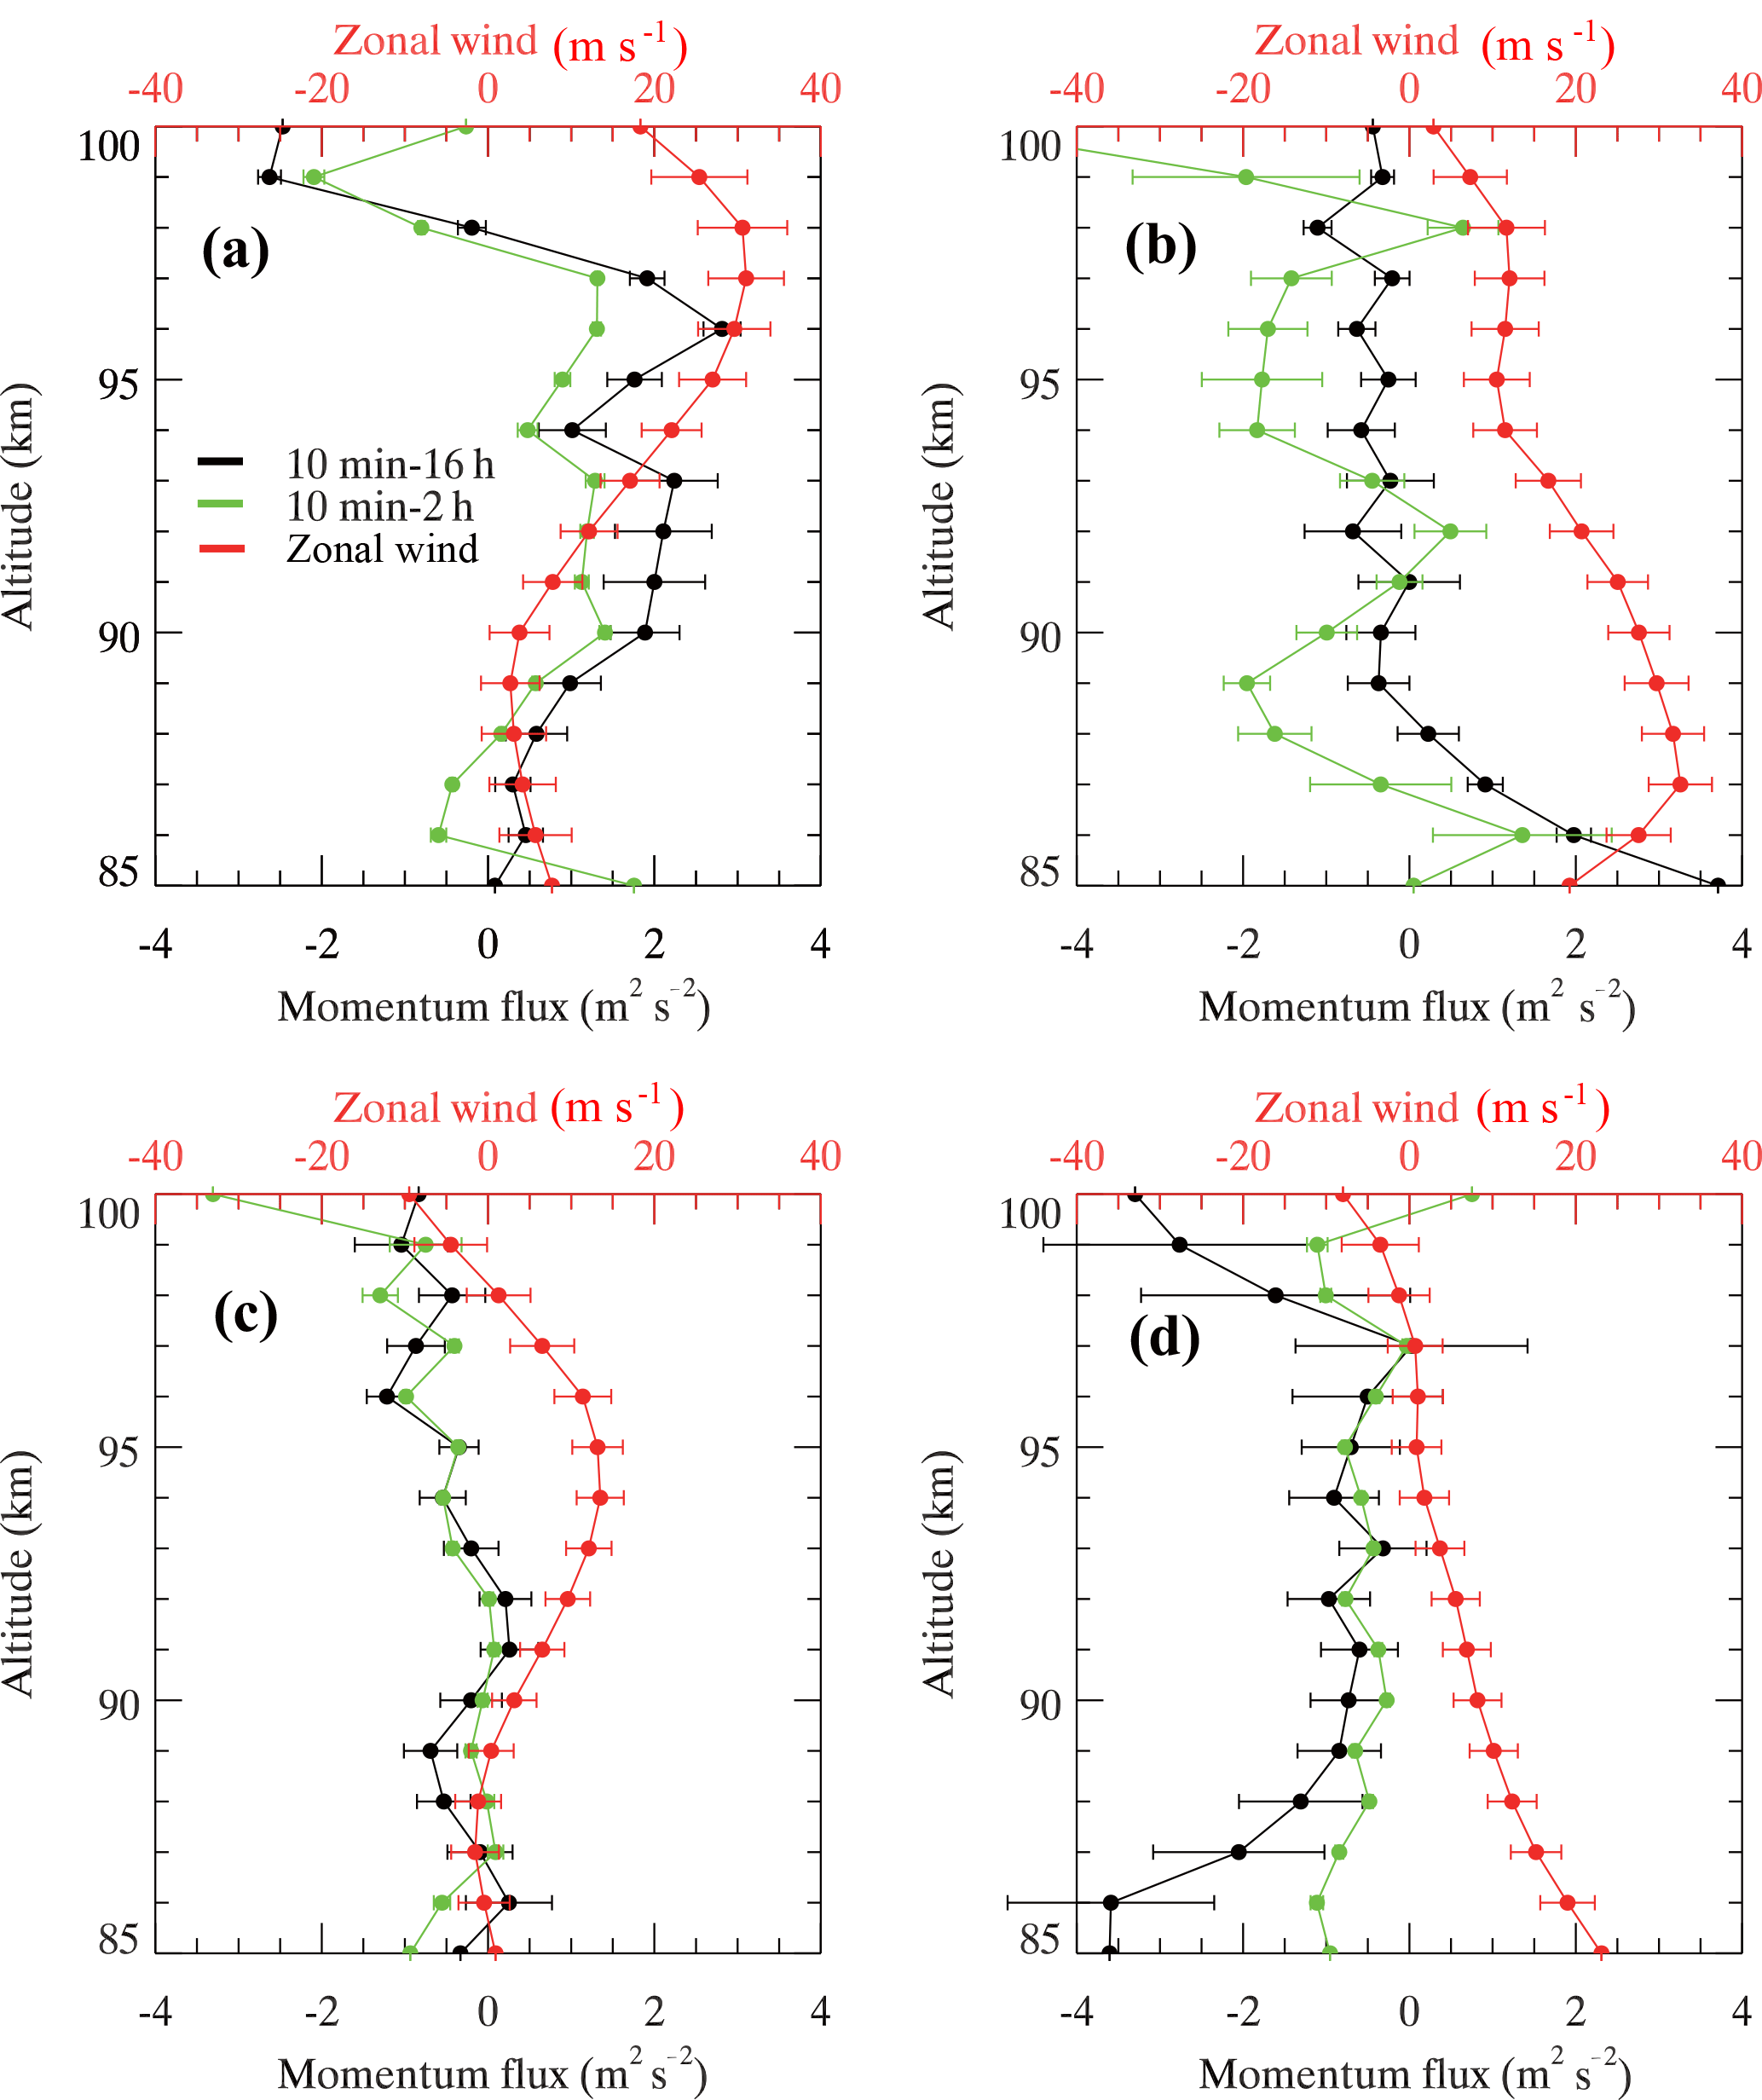
Figure 9Comparison of seasonal mean of nightly mean zonal wind (red) and zonal momentum flux for 10 min–16 h (black) and 10 min–2 h (green) observed by lidar in (a) spring, (b) summer, (c) fall and (d) winter.
Our measured monthly means of the nightly mean temperatures are also generally consistent with previous lidar observations at SOR (Gardner and Liu, 2007) and Fort Collins, CO (She et al., 1998; Yuan et al., 2008). However, the SOR lidar observations were ∼ 10 K colder below 90 km in summer and ∼ 10 K warmer between 90 and 95 km in spring than our lidar results, suggesting significant differences between the two locations likely induced by the significant longitudinal variability in the diurnal tide (Zhang et al., 2010). The semiannual oscillation signature is evident over both Hefei and SOR between 90 and 95 km, but not over Fort Collins. The summer mesopause observed by lidar over Hefei is clearly higher than over the other two locations.
Figure 4 shows the hourly mean sodium density composite during the four different seasons. The density increases with local time during the night, with a peak height around 92 km. The peak density is overall much higher in fall and winter than in spring and summer, which is consistent with previous ground-based and satellite observations (She et al., 2000; Fan et al., 2007a; Fussen et al., 2010). Some peaks above 95 km in summer are likely induced by sporadic sodium layers (SSLs), which often occur in this season over Hefei (Dou et al., 2010). The seasonal mean sodium peak density in winter can reach 4000–4500 cm−3 after midnight. Figure 5 shows the monthly mean of nightly mean sodium density observed by (a) lidar and (b) Odin-OSIRIS and simulated by (c) WACCM. Both observations agree well in seasonal pattern and absolute sodium density and are also consistent with the WACCM model simulation. The elevated peak height and enhanced density in summer observed by lidar is likely due to increased SSL events in summer over Hefei, which is neither frequently observed by Odin-OSIRIS nor simulated by WACCM. Odin-OSIRIS did observe SSLs over China (Fan et al., 2007b), but probably less frequently at 06:00 and 18:00 local time than at midnight. The observed sodium density over Hefei is quite consistent with previous narrowband lidar observations over Fort Collins, CO (She et al., 2000), and Urbana, IL (States and Gardner, 1999) but ∼ 1.5 times higher than previous broadband sodium lidar observations over the nearby city of Wuhan, China (Yi et al., 2009).
The variability in sodium density is clearly correlated with the temperature variability shown in Fig. 2. This is further demonstrated in Fig. 6, in which the correlation coefficient between the composite temperature and relative sodium density perturbations is plotted using lidar measurements (Fig. 6a) and the WACCM simulation (Fig. 6b). The temporal resolution for both lidar and WACCM is 1 h. The lidar observations are clearly consistent with the WACCM simulation, and both results suggest a positive correlation with a coefficient of 0.5–0.8 between 80 and 90 km, but a negative correlation with a coefficient of less than ∼ −0.4 above 96 km for lidar and 100 km for WACCM, consistent with lidar observations at Urbana (40∘ N) (Plane et al., 1999) and in the Arctic (Collins and Smith, 2004). However, our lidar observations above 95 km are not consistent with the recent sodium lidar observations at Arctic Lidar Observatory for Middle Atmosphere Research (ALOMAR), which showed a positive correlation with temperature above this altitude (Dunker et al., 2015). This difference may be related to energetic particle precipitation at high latitudes, but the detailed mechanism is beyond the scope of this paper. We also examined the correlation in the four different seasons (not shown) and found no significant differences, except that the positive correlation range in summer extended higher until ∼ 100 km.
Our lidar observations suggest that the main chemistry below 95 km is likely dominated by neutral sodium chemistry, which essentially involves the partitioning of the metal between atoms and the main reservoir of NaHCO3; the significant activation energy of the reaction NaHCO3 + H drives the balance towards Na at higher temperatures. In contrast, above 95 km the source of atomic Na is from Na+, which involves formation of cluster ions that then undergo dissociative recombination with electrons; the formation of cluster ions is favored at lower temperatures, hence the negative correlation coefficient between Na and temperature on the top side of the Na layer (Plane et al., 2015).
Figure 7 shows the hourly mean zonal wind composite in four different seasons. We see strong tidal oscillations with downward phase progression in all seasons, much clearer than those in temperature (Fig. 2). The diurnal tide with a vertical wavelength of ∼ 20 km dominates in both spring and fall, while the semidiurnal tide with a vertical wavelength of 30–40 km dominates in winter. In spring, the diurnal tide in temperature (Fig. 2a) leads that in zonal wind by ∼ 4 h between 90 and 95 km, consistent with earlier midlatitude observations (Yuan et al., 2006). There is a strong wave oscillation signature with a period of ∼ 8 h and amplitude of ∼ 20 m s−1 that dominates in summer, possibly related to the terdiurnal tide. Previous observations from the nearby Wuhan meteor radar show that the diurnal amplitude near 90 km during the equinox is ∼ 30 m s−1, with a semidiurnal amplitude of ∼ 10 m s−1 (Xiong et al., 2004; Zhao et al., 2005). The comparable diurnal and semidiurnal amplitude (∼ 10 m s−1) in winter is also revealed by these radar observations, with which our observations are generally consistent.
In Fig. 8 we show the monthly mean of the nightly mean zonal wind observed by (a) lidar and (b) Wuhan meteor radar and (c) simulated by WACCM. The radar-observed zonal wind is only available in 2013 for comparison. The general pattern of the lidar-observed zonal winds agrees well with the radar winds but is 5–10 m s−1 stronger. This is likely due to the different vertical and temporal resolutions, signal-to-noise ratio, the measurement methods, and the different locations. The lidar results exhibit a semiannual variation near 90 km with minima in March and August–September, and one maximum in May–June, clearly out of phase with the temperature semiannual variation (Fig. 3a). The lidar-observed semiannual variation in both wind and temperature is consistent with the tropical MSAO previously observed by satellites (Garcia et al., 1997) and simulated by WACCM (Richter and Garcia, 2006). The lidar and radar observations agree with the WACCM simulation below 90 km in both pattern and magnitude, while disagreeing above. Interestingly, a recent comparison between lidar measurements over Fort Collins, CO, and several general circulation models also reveals significant differences (Yuan et al., 2008).
The USTC lidar telescopes were pointed 15∘ from the zenith in the eastward and westward directions between December 2012 and May 2014. This setup allows us to derive the vertical flux of GW zonal momentum. A total of 83 nights of GW momentum flux measurements were obtained with 21, 12, 23 and 27 nights in spring, summer, fall and winter, respectively. Figure 9 shows vertical profiles of the seasonal mean GW zonal momentum flux for the periods 10 min–16 h (black) and 10 min–2 h (green) and zonal wind (red) in (a) spring, (b) summer, (c) fall and (d) winter. The zonal momentum flux is mostly eastward in spring, positively correlated with the eastward zonal wind. However, the zonal momentum flux is mostly westward in other seasons, clearly anticorrelated with the eastward zonal wind, suggesting zonal wind filtering of GWs below 80 km. It is also clear that the zonal momentum flux induced by short-period (10 min–2 h) GWs clearly dominates total momentum flux in all seasons except summer.
The seasonal variation in zonal momentum flux is consistent with previous sodium lidar observation at SOR, New Mexico (Gardner and Liu, 2007). However, middle and upper (MU) atmosphere radar observations near Kyoto, Japan (35∘ N, 136∘ E), show a clear eastward flux in summer and westward flux in winter between 65 and 85 km (Tsuda et al., 1990). Medium-frequency radar observations in Adelaide, Australia (35∘ S, 138∘ E), suggest an eastward flux of ∼ 3 m2 s−2 in winter (Reid and Vincent, 1987). We note here that part of the differences between our lidar results and other published work is likely due to different vertical and temporal resolutions and thus sensitivity to different portions of the GW spectrum. Table 1 compares the GW zonal momentum flux measured at different midlatitude lidar and radar stations. The results from other locations are estimated from the following studies: Gardner and Liu (2007) for the SOR lidar results; Acott et al. (2011) for the Fort Collins, CO, lidar results; and Tsuda et al. (1990) for the Japan MU troposphere radar results. This comparison demonstrates that all observations report a clear westward GW zonal momentum flux in winter. In spring, both the USTC and SOR lidars observed an eastward momentum flux of 1.4–2 m2 s−2.
The short-period (10 min–2 h) GWs clearly contribute 50–70 % of the total momentum flux, consistent with previous medium-frequency radar observations (Fritts and Vincent, 1987). The large westward momentum fluxes of −0.9 and −0.6 m2 s−2 for short-period GWs in summer and winter, respectively, are clearly anticorrelated with eastward zonal wind maxima below 90 km (Fig. 8a), suggesting the filtering of short-period GWs by the SAO wind. However, this SAO variation is not clear in the total momentum flux. For the annual mean, our lidar result is clearly smaller than the SOR lidar result, mainly due to a significant difference in summer. Our results also show that the annual mean zonal wind averaged between 87 and 95 km is ∼10 m s−1 eastward and anticorrelated with the westward momentum flux of ∼ −0.15 m2 s−2 induced by short-period GWs. This anticorrelation suggests that the GW momentum flux observed in the mesopause region is generally consistent with the wind filtering theory proposed by Lindzen (1981) and adopted by general circulation models (e.g., Richter et al., 2010).
Between 2012 and 2016, the USTC sodium temperature and wind lidar observed mesopause region nighttime temperature, zonal wind and sodium density over 150 nights and the vertical flux of zonal momentum during 83 nights. The seasonal nighttime hourly composites of temperature and zonal wind show clear diurnal and/or semidiurnal tidal signatures. For temperature, the diurnal tide with clear downward phase progression dominates only in spring, while the semidiurnal tide dominates above 100 km throughout the year. In zonal wind, the diurnal tide with a vertical wavelength of ∼ 20 km dominates in both spring and fall, while the semidiurnal tide with a vertical wavelength of 30–40 km dominates in winter. Between 90 and 95 km, the diurnal tide in temperature in spring leads that in zonal wind by ∼ 4 h, consistent with previous observations and model simulations. The monthly mean results show a signature of semiannual variation in both temperature and zonal wind near 90 km but with a clear out-of-phase feature, consistent with the tropical MSAO. Comparison of the USTC lidar results with observations by satellite and meteor radar and simulated by WACCM show generally good agreement, although there are some differences among them, with pronounced disagreement between the observed zonal wind and the model above 90 km.
The seasonal mean of zonal momentum flux is mostly westward in summer, fall and winter, clearly anticorrelated with the eastward zonal wind, which suggests zonal wind filtering of GWs below 80 km. However, during spring the zonal momentum flux is mostly eastward, positively correlated with the eastward zonal wind. The short-period GWs clearly contribute 50–70 % of total momentum flux averaged over 87–95 km. The large westward momentum fluxes in summer and winter for short-period GWs are clearly anticorrelated with eastward zonal wind maxima below 90 km (Fig. 8a), suggesting the filtering of short-period GWs by the SAO wind. The annual mean flux averaged over 87–95 km is 0.15 m2 s−2 (westward), induced by the short-period GWs, anticorrelated with the zonal wind of ∼ 10 m s−1 (eastward), suggesting that the GW momentum flux observed in the mesopause region is generally consistent with the wind filtering theory.
The sodium density increases with local time during the night, with a peak height near 92 km. The peak density is overall much higher in fall and winter than in spring and summer. The seasonal mean sodium peak density in winter can reach 4000–4500 cm−3 after midnight. The variability in sodium density is positively correlated with temperature variability, suggesting that chemistry plays a dominant role in the formation of sodium atoms in the mesopause region below 95 km. The lidar observations agree well with Odin-OSIRIS satellite observations in both seasonal pattern and absolute monthly mean sodium density, consistent with WACCM simulations using a new Na meteoric input function.
The SABER data are downloaded from http://saber.gats-inc.com/ (last access: 30 December 2017).
TL designed the research, performed data analysis and wrote the manuscript. CB performed data analysis and prepared the figures. CB, XF, JL and ZW conducted lidar observations. WF, JMCP and DRM designed and performed the WACCM Na model simulation and analyzed and interpreted the results. MJM and DRM are responsible for the WACCM model. JX provided the Wuhan meteor radar data. XD helped to interpret the lidar sodium results. All authors contributed to discussion and interpretation.
The authors declare that they have no conflict of interest.
This article is part of the special issue “Layered phenomena in the mesopause region (ACP/AMT inter-journal SI)”. It is a result of the LPMR workshop 2017 (LPMR-2017), Kühlungsborn, Germany, 18–22 September 2017.
The work described in this paper was carried out at the University of Science
and Technology of China (USTC), under support of the National Natural Science
Foundation of China grant 41674149 and the Open Research Project of Large
Research Infrastructures of CAS – “Study on the interaction between
low/mid-latitude atmosphere and ionosphere based on the Chinese Meridian
Project”. Wuhu Feng and John M. C. Plane were supported by the European
Research Council (project 291332-CODITA). The National Center for Atmospheric
Research (NCAR) is sponsored by the National Science Foundation. We thank
Chengyun Yang, Shengyang Gu, Xianyu Wang, Yetao Cen, Feng Li and Huazhi Ge
for help with gathering lidar data. Tao Li would like to thank Alan Liu for helpful
discussion. The SD-WACCM model was obtained from NCAR and run at the
University of Leeds and is available by contacting the co-authors Wuhu Feng
or John M. C. Plane. We would like to thank Francis Vitt at NCAR for the
WACCM model support. We thank Richard Collins and the other anonymous reviewer
for their constructive comments.
Edited by: Robert Hibbins
Reviewed by: two anonymous referees
Acott, P. E., She, C. Y., Krueger, D. A., Yan, Z. A., Yuan, T., Yue, J., and Harrell, S.: Observed nocturnal gravity wave variances and zonal momentum flux in mid-latitude mesopause region over Fort Collins, Colorado, USA, J. Atmos. Sol. Terr. Phys., 73, 449–456, https://doi.org/10.1016/j.jastp.2010.10.016, 2011.
Andrews, D. G., Holton, J. R., and Leovy, C. B.: Middle Atmosphere Dynamics, Elsevier, New York, USA, 489 pp., 1987.
Arnold, K. and She, C.: Metal fluorescence lidar (light detection and ranging) and the middle atmosphere, Contemp. Phys., 44, 35–49, https://doi.org/10.1080/0010751021000019157, 2003.
Burrage, M. D., Vincent, R. A., Mayr, H. G., Skinner, W. R., Arnold, N. F., and Hays, P. B.: Long-term variability in the equatorial middle atmosphere zonal wind, J. Geophys. Res., 101, 12847–12854, https://doi.org/10.1029/96JD00575, 1996.
Carrillo-Sánchez, J. D., Nesvorný, D., Pokorný, P., Janches, D., and Plane, J. M. C.: Sources of cosmic dust in the Earth's atmosphere, Geophys. Res. Lett., 43, 11979–11986, https://doi.org/10.1002/2016GL071697, 2016.
Chu, X., Gardner, C. S., and Franke, S. J.: Nocturnal thermal structure of the mesosphere and lower thermosphere region at Maui, Hawaii (20.7∘ N), and Starfire Optical Range, New Mexico (35∘ N), J. Geophys. Res., 110, D09S03, https://doi.org/10.1029/2004JD004891, 2005.
Collins, R. L. and Smith, R. W.: Evidence of damping and overturning of gravity waves in the Arctic mesosphere: Na lidar and OH temperature observations, J. Atmos. Sol. Terr. Phys., 66, 867–879, https://doi.org/10.1016/j.jastp.2004.01.038, 2004.
Dawkins, E. C. M., Plane, J. M. C., Chipperfield, M. P., Feng, W., Gumbel, J., Hedin, J., Hoffner, J., and Friedman, J. S.: First global observations of the mesospheric potassium layer, Geophys. Res. Lett., 41, 5653–5661, 2014.
Dou, X. K., Xue, X. H., Li, T., Chen, T. D., Chen, C., and Qiu, S. C.: Possible relations between meteors, enhanced electron density layers, and sporadic sodium layers, J. Geophys. Res., 115, A06311, https://doi.org/10.1029/2009JA014575, 2010.
Dunker, T., Hoppe, U.-P., Feng, W., Plane, J. M. C., and Marsh, D. R.: Mesospheric temperatures and sodium properties measured with the ALOMAR Na lidar compared with WACCM, J. Atmos. Sol. Terr. Phys., 127, 111–119, https://doi.org/10.1016/j.jastp.2015.01.003, 2015.
Dunkerton, T. J.: Theory of the Mesopause Semiannual Oscillation, J. Atmos. Sci., 39(12), 2681–2690, https://doi.org/10.1175/1520-0469(1982)039<2681:TOTMSO>2.0.CO;2, 1982.
Ejiri, M. K., Nakamura, T., and Kawahara, T. D.: Seasonal variation of nocturnal temperature and sodium density in the mesopause region observed by a resonance scatter lidar over Uji, Japan, J. Geophys. Res., 115, D18126, https://doi.org/10.1029/2009JD013799, 2010.
Espy, P. J., Jones, G. O. L., Swenson, G. R., Tang, J., and Taylor, M. J.: Seasonal variations of the gravity wave momentum flux in the Antarctic mesosphere and lower thermosphere, J. Geophys. Res., 109, D23109, https://doi.org/10.1029/2003JD004446, 2004.
Fan, Z. Y., Plane, J. M. C., Gumbel, J., Stegman, J., and Llewellyn, E. J.: Satellite measurements of the global mesospheric sodium layer, Atmos. Chem. Phys., 7, 4107–4115, https://doi.org/10.5194/acp-7-4107-2007, 2007a.
Fan, Z. Y., Plane, J. M. C., and Gumbel, J.: On the global distribution of sporadic sodium layers, Geophys. Res. Lett., 34, L15808, https://doi.org/10.1029/2007GL030542, 2007b.
Feng, W., Marsh, D. R., Chipperfield, M. P., Janches, D., Hoffner, J., Yi, F., and Plane, J. M. C.: A global atmospheric model of meteoric iron, J. Geophys. Res., 118, 9456–9474, 2013.
Feng, W., Kaifler, B., Marsh, D. R., Höffner, J., Hoppe, U.-P., Williams, B. P., and Plane, J. M. C.: Impacts of a sudden stratospheric warming on the mesospheric metal layers, J. Atmos. Sol. Terr. Phys., 1–10, https://doi.org/10.1016/j.jastp.2017.02.004, 2017.
Forbes, J. M., Zhang, X., Ward, W., and Talaat, E.: Nonmigrating diurnal tides in the thermosphere, J. Geophys. Res., 108, 1033, https://doi.org/10.1029/2002JA009262, 2003.
Franke, S. J., Chu, X., Liu, A. Z., and Hocking, W. K.: Comparison of meteor radar and Na Doppler lidar measurements of winds in the mesopause region above Maui, Hawaii, J. Geophys. Res., 110, D09S02, https://doi.org/10.1029/2003JD004486, 2005.
Friedman, J. S., Collins, S. C., Delgado, R., and Castleberg, P. A.: Mesospheric potassium layer over the Arecibo Observatory, 18.3∘ N 66.75∘ W, Geophys. Res. Lett., 29, 1071, https://doi.org/10.1029/2001GL013542, 2002.
Friedman, J. S. and Chu, X.: Nocturnal temperature structure in the mesopause region over the Arecibo Observatory (18.351N, 66.751W): seasonal variations. J. Geophys. Res., 112, D14107, https://doi.org/10.1029/2006JD008220, 2007.
Fritts, D. and Vincent, R.: Mesospheric Momentum Flux Studies at Adelaide, Australia: Observations and a Gravity Wave-Tidal Interaction Model, J. Atmos. Sci., 44, 605–619, 1987.
Fussen, D., Vanhellemont, F., Tétard, C., Mateshvili, N., Dekemper, E., Loodts, N., Bingen, C., Kyrölä, E., Tamminen, J., Sofieva, V., Hauchecorne, A., Dalaudier, F., Bertaux, J.-L., Barrot, G., Blanot, L., Fanton d'Andon, O., Fehr, T., Saavedra, L., Yuan, T., and She, C.-Y.: A global climatology of the mesospheric sodium layer from GOMOS data during the 2002–2008 period, Atmos. Chem. Phys., 10, 9225–9236, https://doi.org/10.5194/acp-10-9225-2010, 2010.
Garcia, R. R., Dunkerton, T. J., Lieberman, R. S., and Vincent, R. A.: Climatology of the semiannual oscillation of the tropical middle atmosphere, J. Geophys. Res., 102, 26019–26032, https://doi.org/10.1029/97JD00207, 1997.
Garcia, R. R., Marsh, D., Kinnison, D. E., Boville, B., and Sassi, F.: Simulations of secular trends in the middle atmosphere, 1950–2003, J. Geophys. Res., 112, D09301, https://doi.org/10.1029/2006JD007485, 2007.
Gardner, C. S., Zhao, Y., and Liu, A. Z.: Atmospheric stability and gravity wave dissipation in the mesopause region, J. Atmos. Sol. Terr. Phys., 64, 923–929, https://doi.org/10.1016/S1364-6826(02)00047-0, 2002.
Gardner, C. S., Plane, J. M. C., Pan, W., Vondra, T., Murray, B. J., and Chu, X.: Seasonal variations of the Na and Fe layers at the South Pole and their implications for the chemistry and general circulation of the polar mesosphere, J. Geophys. Res., 110, D10302, https://doi.org/10.1029/2004JD005670, 2005.
Gardner, C. S. and Liu, A. Z.: Seasonal variations of the vertical fluxes of heat and horizontal momentum in the mesopause region at Starfire Optical Range, New Mexico, J. Geophys. Res., 112, D09113, https://doi.org/10.1029/2005JD006179, 2007.
Gómez Martín, J. C., Garraway, S. A., and Plane, J. M. C.: Reaction Kinetics of Meteoric Sodium Reservoirs in the Upper Atmosphere, J. Phys. Chem. A, 120, 1330–1346, https://doi.org/10.1021/acs.jpca.5b00622, 2015.
Gómez Martín, J. C., Seaton, C., de Miranda, M. P., and Plane, J. M. C.: The Reaction Between Sodium Hydroxide and Atomic Hydrogen in Atmospheric and Flame Chemistry, J. Phys. Chem. A, 121, 7667–7674, https://doi.org/10.1021/acs.jpca.7b07808, 2017.
Huang, W., Chu, X. Z., Gardner, C. S., Carrillo-Sanchez, J. D., Feng, W., Plane, J. M. C., and Nesvorny, D.: Measurements of the vertical fluxes of atomic Fe and Na at the mesopause: Implications for the velocity of cosmic dust entering the atmosphere, Geophys. Res. Lett., 42, 169–175, 2015.
Hurrell, J. W., Holland, M. M., Gent, P. R., Ghan, S., Kay, J. E., Kushner, P. J., Lamarque, J. F., Large, W. G., Lawrence, D., Lindsay, K., Lipscomb, W. H., Long, M. C., Mahowald, N., Marsh, D. R., Neale, R. B., Rasch, P., Vavrus, S., Vertenstein, M., Bader, D., Collins, W. D., Hack, J. J., Kiehl, J., and Marshall, S.: The Community Earth System Model: A Framework for Collaborative Research, B. Am. Meteorol. Soc., 94, 1339–1360, https://doi.org/10.1175/BAMS-D-12-00121.1, 2013.
Kudeki, E. and Franke, S. J.: Statistics of momentum flux estimation, J. Atmos. Sol. Terr. Phys., 60, 1549–1553, 1998.
Lauritzen, P. H., Bacmeister, J. T., Callaghan, P. F., and Taylor, M. A.: NCAR global model topography generation software for unstructured grids, Geosci. Model Dev., 8, 1–12, https://doi.org/10.5194/gmd-8-1-2015, 2015.
Li, T., She, C., Williams, B., Yuan, T., Collins, R., Kieffaber, L., and Peterson, A.: Concurrent OH imager and sodium temperature/wind lidar observation of localized ripples over northern Colorado, J. Geophys. Res., 114, D06106, https://doi.org/10.1029/2008JD011089, 2005.
Li, T., She, C., Liu, H., and Montgomery, M.: Evidence of a gravity wave breaking event and the estimation of the wave characteristics from sodium lidar observation over Fort Collins, CO (41∘ N, 105∘ W), Geophys. Res. Lett., 34, L05815, https://doi.org/10.1029/2006GL028988, 2007.
Li, T., She, C.-Y., Liu, H.-L., Yue, J., Nakamura, T., Krueger, D. A., Wu, Q., Dou, X., and Wang, S.: Observation of local tidal variability and instability, along with dissipation of diurnal tidal harmonics in the mesopause region over Fort Collins, Colorado (41∘ N, 105∘ W), J. Geophys. Res., 114, D06106, https://doi.org/10.1029/2008JD011089, 2009.
Li, T., Fang, X., Liu, W., Gu, S. Y., and Dou, X. K.: Narrowband sodium lidar for the measurements of mesopause region temperature and wind, Appl. Optics, 51, 5401–5411, https://doi.org/10.1364/ao.51.005401, 2012.
Li, T., Calvo, N., Yue, J., Dou, X., Russell III, J. M., Mlynczak, M. G., She, C.-Y., and Xue, X.: Influence of El Niño-Southern Oscillation in the mesosphere, Geophys. Res. Lett., 40, 3292–3296, https://doi.org/10.1002/grl.50598, 2013.
Li, T., Clavo, N., Yue, J., Russel III, J., Smith, A., Mlynczak, M., Chandran, A., Dou, X., and Liu, A.: Southern Hemisphere summer mesopause responses to El Niño–Southern Oscillation, J. Clim., 29, 6319–6328, https://doi.org/10.1175/JCLI-D-15-0816.1, 2016.
Lieberman, R. S.: Nonmigrating diurnal tides in the equatorial middle atmosphere, J. Atmos. Sci., 48, 1112–1123, 1991.
Lin, S.-J.: A “vertically-Lagrangian” finite-volume dynamical core for global atmospheric models, Mon. Weather Rev., 132, 2293–2307, 2004.
Lindzen, R. S.: Turbulence and stress owing to gravity-wave and tidal breakdown, J. Geophys. Res., 86, 9707–9714, https://doi.org/10.1029/JC086iC10p09707, 1981.
Liu, H. L. and Hagan, M. E.: Local heating/cooling of the mesosphere due to gravity wave and tidal coupling, Geophys. Res. Lett., 25, 2941–2944, https://doi.org/10.1029/98gl02153, 1998.
Llewellyn, E. J., Lloyd, N. D., Degenstein, D. A., Gattinger, R. L., Petelina, S. V., Bourassa, A. E., Wiensz, J. T., Ivanov, E. V., McDade, I. C., Solheim, B. H., McConnell, J. C., Haley, C. S., Savigny, Von, C., Sioris, C. E., McLinden, C. A., Griffioen, E., Kaminski, J., Evans, W. F., Puckrin, E., Strong, K., Wehrle, V., Hum, R. H., Kendall, D. J., Matsushita, J., Murtagh, D. P., Brohede, S., Stegman, J., Witt, G., Barnes, G., Payne, W. F., Piché, L., Smith, K., Warshaw, G., Deslauniers, D. L., Marchand, P., Richardson, E. H., King, R. A., Wevers, I., McCreath, W., Kyrola, E., Oikarinen, L., Leppelmeier, G. W., Auvinen, H., Megie G, Hauchecorne, A., Lefèvre, F., de la Noe, J., Ricaud, P., Frisk, U., Sjoberg, F., Schéele, von, F. and Nordh, L.: The OSIRIS instrument on the Odin spacecraft, Can. J. Phys., 82, 411–422, https://doi.org/10.1139/p04-005, 2004.
Lübken, F., Höffner, J., Viehl, T. P., Kaifler, B., and Morris, R. J.: First measurements of thermal tides in the summer mesopause region at Antarctic latitudes, Geophys. Res. Lett., 38, L24806, https://doi.org/10.1029/2011GL050045, 2011.
Marsh, D. R., Mills, M. J., Kinnison, D. E., Lamarque, J.-F., Calvo, N., and Polvani, L. M.: Climate Change from 1850 to 2005 Simulated in CESM1(WACCM), J. Climate, 26, 7372–7391, https://doi.org/10.1175/JCLI-D-12-00558.1, 2013a.
Marsh, D. R., Janches, D., Feng, W., and Plane, J. M. C.: A global model of meteoric sodium. J. Geophys. Res., 118, 11442–11452, https://doi.org/10.1002/jgrd.50870, 2013b.
Mertens, C. J., Mlynczak, M. G., López-Puertas, M., Wintersteiner, P. P., Picard, R. H., Winick, J. R., Gordley, L. L., and Russell, J. M. I.: Retrieval of mesospheric and lower thermospheric kinetic temperature from measurements of CO2 15 µm Earth Limb Emission under non-LTE conditions, Geophys. Res. Lett., 28, 1391–1394, https://doi.org/10.1029/2000GL012189, 2001.
Mills, M. J., Schmidt, A., Easter, R., Solomon, S., Kinnison, D. E., Ghan, S. J., Neely III, R. R., Marsh, D. R., Conley, A., Bardeen, C. G., and Gettelman, A.: Global volcanic aerosol properties derived from emissions, 1990-2014, using CESM1(WACCM), J. Geophys. Res.-Atmos., 121, 2332–2348, https://doi.org/10.1002/2015jd024290, 2016.
Mills, M. J., Richter, J. H., Tilmes, S., Kravitz, B., MacMartin, D. G., Glanville, A. A., Tribbia, J. J., Lamarque, J.-F., Vitt, F., Schmidt, A., Gettelman, A., Hannay, C., Bacmeister, J. T., and Kinnison, D. E.: Radiative and Chemical Response to Interactive Stratospheric Sulfate Aerosols in Fully Coupled CESM1(WACCM), J. Geophys. Res.-Atmos., 6, 541, https://doi.org/10.1002/2017JD027006, 2017.
Neale, R. B., Chen, C. C., Gettelman, A., Lauritzen, P. H., Park, S., Williamson, D. L., Conley, A. J., Garcia, R., Kinnison, D., Lamarque, J.-F., Marsh, D., Mills, M., Smith, A. K., Tilmes, S., Vitt, F., Morrison, H., Cameron-Smith, P., Collins, W. D., Iacono, M. J., Easter, R. C., Ghan S. J., Liu, X., Rasch, P. J., and Taylor, M. A.: Description of the NCAR Community Atmosphere Model (CAM 5.0), NCAR Tech. Note NCAR-TN-486+STR, 274 pp., 2012.
Plane, J. M. C., Gardner, C. S., Yu, J., She, C.Y., Garcia, R. R., and Pumphrey, H. C.: The Mesospheric Na layer at 40∘ N: Modelling and Observations, J. Geophys. Res., 104, 3773–3788, 1999.
Plane, J. M. C., Feng, W., and Dawkins, E. C. M.: The Mesosphere and Metals: Chemistry and Changes, Chem. Rev., 115, 4497–4541, https://doi.org/10.1021/cr500501m, 2015.
Preusse, P., Eckermann, S. D., Ern, M., Oberheide, J., Picard, R. H., Roble, R. G., Riese, M., Russell, J. M., and Mlynczak, M. G.: Global ray tracing simulations of the SABER gravity wave climatology, J. Geophys. Res., 114, D08126, https://doi.org/10.1029/2008JD011214, 2009.
Reid, I. M.: Measurements of mesospheric gravity wave momentum fluxes and mean flow accelerations at Adelaide, Australia, Jourmd of Atmospheric and Terresfrial Physrcs, 1–18, 1987.
Richter, J. and Garcia, R.: On the forcing of the Mesospheric Semi-Annual Oscillation in the Whole Atmosphere Community Climate Model, Geophys. Res. Lett., 33, L01806, https://doi.org/10.1029/2005GL024378, 2006.
Richter, J. H., Sassi, F., and Garcia, R. R.: Toward a Physically Based Gravity Wave Source Parameterization in a General Circulation Model, J. Atmos. Sci., 67, 136, https://doi.org/10.1175/2009JAS3112.1, 2010.
Russell III, J. M., Mlynczak, M. G., Gordley, L. L., Tansock, J., and Esplin, R.: An overview of the SABER experiment and preliminary calibration results, Proc. SPIE, 3756, 277–288, 1999.
She, C. Y.: Eight-year climatology of nocturnal temperature and sodium density in the mesopause region (80 to 105 km) over Fort Collins, Co (41∘ N, 105∘ W), Geophys. Res. Lett., 27, 3289–3292, https://doi.org/10.1029/2000GL003825, 2000.
She, C. Y. and Yu, J. R.: Simultaneous three-frequency Na lidar measurements of radial wind and temperature in the mesopause region, Geophys. Res. Lett., 21, 1771–1774, https://doi.org/10.1029/94GL01417, 1994.
She, C. Y., Thiel, S. W., and Krueger, D. A.: Observed Episodic Warming at 86 and 100 km Between 1990 and 1997: Effects of Mount Pinatubo Eruption, Geophys. Res. Lett., 25, 497–500, https://doi.org/10.1029/98GL00178, 1998.
Smith, A. K.: Global Dynamics of the MLT, Surv. Geophys., 33, 1177–1230, https://doi.org/10.1007/s10712-012-9196-9, 2012.
States, R. J. and Gardner, C. S.: Structure of the mesospheric Na layer at 40∘ N latitude: Seasonal and diurnal variations, J. Geophys. Res., 104, 11783–11798, https://doi.org/10.1029/1999JD900002, 1999.
Thorsen, D., Franke, S. J., and Kudeki, E.: Statistics of momentum flux estimation using the dual coplanar beam technique, Geophys. Res. Lett., 27, 3193–3196, 2000.
Tsuda, T., Murayama, Y., and Yamamoto, M.: Seasonal variation of momentum flux in the mesosphere observed with the MU radar, Geophys. Res. Lett., 17, 725–728, 1990.
Vincent, R. A. and Reid, I. M.: HF doppler measurements of mesospheric gravity-wave momentum fluxs, J. Atmos. Sci., 40, 1321–1333, https://doi.org/10.1175/1520-0469(1983)040<1321:hdmomg>2.0.CO;2, 1983.
Wu, Q., Ortland, D. A., Killeen, T. L., Roble, R. G., Hagan, M. E., Liu, H. L., Solomon, S. C., Xu, J., Skinner, W. R., and Niciejewski, R. J.: Global distribution and interannual variations of mesospheric and lower thermospheric neutral wind diurnal tide: 1. Migrating tide, J. Geophys. Res., 113, A05308, https://doi.org/10.1029/2007JA012542, 2008.
Xiong, J. G., Wan, W., Ning, B., and Liu, L.: First results of the tidal structure in the MLT revealed by Wuhan Meteor Radar (30 degrees 40′ N, 114 degrees 30′ E), J. Atmos. Sol.-Terr. Phys., 66, 675–682, https://doi.org/10.1016/j.jastp.2004.01.018, 2004.
Xu, J., She, C. Y., Yuan, W., Mertens, C., Mlynczak, M., and Russell, J.: Comparison between the temperature measurements by TIMED/SABER and lidar in the midlatitude, J. Geophys. Res., 111, A10S09, https://doi.org/10.1029/2005JA011439, 2006.
Yi, F., Yu, C., Zhang, S., Yue, X., He, Y., Huang, C., Zhang, Y., and Huang, K.: Seasonal variations of the nocturnal mesospheric Na and Fe layers at 30∘ N, J. Geophys. Res., 114, D01301, https://doi.org/10.1029/2008JD010344, 2009.
Yuan, T., She, C., Hagan, M., Williams, B., Li, T., Arnold, K., Kawahara, T., Acott, P., Vance, J., Krueger, D., and Roble, R.: Seasonal variation of diurnal perturbations in mesopause region temperature, zonal, and meridional winds above Fort Collins, Colorado (40.6∘ N, 105∘ W), J. Geophys. Res., 111, D06103, https://doi.org/10.1029/2004JD005486, 2006.
Yuan, T., She, C.-Y., Krueger, D. A., Sassi, F., Garcia, R., Roble, R. G., Liu, H.-L., and Schmidt, H.: Climatology of mesopause region temperature, zonal wind, and meridional wind over Fort Collins, Colorado (41∘ N, 105∘ W), and comparison with model simulations, J. Geophys. Res.-Atmos., 113, D03105, doi:10.1029/2007JD008697, 2008.
Yuan, T., She, C. Y., Kawahara, T. D., and Krueger, D. A.: Seasonal variations of midlatitude mesospheric Na layer and their tidal period perturbations based on full diurnal cycle Na lidar observations of 2002–2008, J. Geophys. Res., 117, D11304, https://doi.org/10.1029/2011JD017031, 2012.
Zahn, V. U., Hoffner, J., Eska, V., and Alpers, M.: The mesopause altitude: Only two distinctive levels worldwide?, Geophys. Res. Lett., 23, 3231–3234, https://doi.org/10.1029/96GL03041, 1996.
Zhang, X., Forbes, J. M., and Hagan, M. E.: Longitudinal variation of tides in the MLT region: 1. Tides driven by tropospheric net radiative heating, J. Geophys. Res., 115, A06316, https://doi.org/10.1029/2009JA014897, 2010.
Zhao, G., Liu, L., Wan, W., Ning, B., and Xiong, J.: Seasonal behavior of meteor radar winds over Wuhan, Earth Planets and Space, 57, 61–70, https://doi.org/10.1186/BF03351806, 2005.