the Creative Commons Attribution 4.0 License.
the Creative Commons Attribution 4.0 License.
 | 15 Aug 2018
Transport of trace gases via eddy shedding from the Asian summer monsoon anticyclone and associated impacts on ozone heating rates
Chaitri Roy
Rajib Chattopadhyay
Christopher E. Sioris
Alexandru Rap
Rolf Müller
K. Ravi Kumar
Raghavan Krishnan
The highly vibrant Asian summer monsoon (ASM) anticyclone plays an important role in efficient transport of Asian tropospheric air masses to the extratropical upper troposphere and lower stratosphere (UTLS). In this paper, we demonstrate long-range transport of Asian trace gases via eddy-shedding events using MIPAS (Michelson Interferometer for Passive Atmospheric Sounding) satellite observations, ERA-Interim reanalysis data and the ECHAM5–HAMMOZ global chemistry-climate model. Model simulations and observations consistently show that Asian boundary layer trace gases are lifted to UTLS altitudes in the monsoon anticyclone and are further transported horizontally eastward and westward by eddies detached from the anticyclone. We present an event of eddy shedding during 1–8 July 2003 and discuss a 1995–2016 climatology of eddy-shedding events. Our analysis indicates that eddies detached from the anticyclone contribute to the transport of Asian trace gases away from the Asian region to the western Pacific (20–30∘ N, 120–150∘ E) and western Africa (20–30∘ N, 0–30∘ E). Over the last two decades, the estimated frequency of occurrence of eddy-shedding events is ∼68 % towards western Africa and ∼25 % towards the western Pacific.
Model sensitivity experiments considering a 10 % reduction in Asian emissions of non-methane volatile organic compounds (NMVOCs) and nitrogen oxides (NOx) were performed with ECHAM5–HAMMOZ to understand the impact of Asian emissions on the UTLS. The model simulations show that transport of Asian emissions due to eddy shedding significantly affects the chemical composition of the upper troposphere (∼100–400 hPa) and lower stratosphere (∼100–80 hPa) over western Africa and the western Pacific. The 10 % reduction of NMVOCs and NOx Asian emissions leads to decreases in peroxyacetyl nitrate (PAN) (2 %–10 % near 200–80 hPa), ozone (1 %–4.5 % near ∼150 hPa) and ozone heating rates (0.001–0.004 K day−1 near 300–150 hPa) in the upper troposphere over western Africa and the western Pacific.
- Article
(4992 KB) -
Supplement
(440 KB) - BibTeX
- EndNote


Rapid industrialization, traffic growth and urbanization resulted in significant increases in the concentrations of tropospheric trace gases, such as carbon dioxide (CO2), carbon monoxide (CO) and methane (CH4) over Asia. There is global concern about rising levels of these trace gases (due to their global warming potential) as they are projected to increase further over the coming years despite efforts to implement several mitigation strategies (Ohara et al., 2007). In situ observations, satellite measurements, trajectory analysis and model simulations show long-range transport of Asian trace gases to remote locations (e.g. North America, Europe) (Liang et al., 2004). The transported trace gases change the radiative balance, dynamics and chemical composition at the respective locations (Vogel et al., 2016). Satellite observations show increasing trends in several tropospheric Asian trace gases over the last decade, e.g. ozone at ∼1 % yr−1–3 % yr−1 (Verstraeten et al., 2015), CO at 3 % yr−1 (Strode and Pawson, 2013) and NOx at ∼3.8 % yr−1–7.3 % yr−1 (Schneider and van der A, 2012; Ghude et al., 2013). Biomass-burning is another major contributor to the observed growth in these trace gases (van der Werf et al., 2006). Peroxyacetyl nitrate (PAN), a powerful pollutant formed in biomass-burning plumes (Wayne, 2000), is a secondary pollutant produced through the oxidation of hydrocarbons released from anthropogenic and biogenic sources. It is a reservoir of reactive nitrogen and plays a fundamental role in the global ozone budget (Tereszchuk et al., 2013; Payne et al., 2017). PAN can also be formed in the upper troposphere through the production of NOx from lightning (Zhao et al., 2009). Simulations of the Model of Ozone and Related chemical Tracers (MOZART) show an increase of 20 %–30 % of PAN concentrations in the upper troposphere and lower stratosphere (UTLS) over the Asian summer monsoon (ASM) region produced from lightning (Tie et al., 2002). While in the lower troposphere, PAN has a short lifetime (a few hours), in the UTLS it has a longer lifetime (3–5 months) and can therefore act as a reservoir and carrier of NOx (Tereszchuk et al., 2013). Recent satellite observations show an increasing trend in PAN ( to 2.7±0.8 ppt yr−1) in the UTLS over Asia (Fadnavis et al., 2014).
Monsoon convection plays an important role in the lofting of boundary layer Asian air masses to the UTLS (e.g. Randel et al., 2010; Fadnavis et al., 2015; Santee et al., 2017). The uplifted air masses become confined into the anticyclone enclosed by jets (westerly and easterly jets to the north and south, respectively), which act as a strong transport barrier and restrict isentropic mixing into the extratropical lower stratosphere or the equatorial tropics (Ploeger et al., 2015, 2017). Confinements of high concentrations of trace gases, including ozone precursors (e.g. hydrogen cyanide (HCN), CO, hydrochloric acid (HCl), NOx and PAN), and low ozone in the anticyclone are evident in satellite and aircraft observations (Randel et al., 2010; Vogel et al., 2014; Fadnavis et al., 2015; Ungermann et al., 2016; Santee et al., 2017). The observed ozone minimum is still an open question in spite of high amounts of its precursors in the anticyclone. A fraction of these trace gases enters the lower stratosphere and affects the UTLS chemical composition (Randel et al., 2010; Fadnavis et al., 2015; Roy et al., 2017; Garny and Randel, 2016), with associated radiative forcing impacts (Riese et al., 2012). Cross-tropopause transport associated with the Asian monsoon is evident in a number of species, including aerosols, hydrogen cyanide (HCN) and PAN (Randel et al., 2010; Fadnavis et al., 2014, 2015; Bourassa et al., 2012).
The ASM anticyclone is highly dynamic in nature (e.g. Hsu and Plumb, 2000; Popovic and Plumb, 2001; Vogel et al., 2016). On the subseasonal scale, it shows variation in strength and location (Garny and Randel, 2016). It frequently sheds eddies, and on occasion, it splits into two anticyclones, namely the Tibetan and Iranian anticyclones (Zhang et al., 2002; Nützel et al., 2016). An eddy detached from the anticyclone carries Asian air masses (trace gases) away from the ASM region. There are scattered studies indicating eddy shedding to the west (Popovic and Plumb, 2001) and east (Ungermann et al., 2016; Vogel et al., 2014) of the anticyclone. An eddy-shedding event causes irreversible mixing in the surrounding air changing the chemical composition and radiative balance of that region (Garny and Randel, 2016). Here, we analyse transport of Asian trace gases via eddies in detail, subsequent mixing into the extratropics and radiative impact of eddy-shedding events on decadal scales. In this study, we answer the following questions: (1) how frequent were eddy-shedding events during the last two decades? (2) Which regions are the most affected? (3) Does the transport of Asian trace gases arising from eddy shedding affect UTLS ozone concentrations and heating rates at remote locations?
To address these questions, we first consider an eddy-shedding event demonstrating eastward and westward shedding from the ASM anticyclone during 1–8 July 2003. This year was chosen since the monsoon season was quite normal (i.e. no evidence of El Niño or Indian Ocean dipole phenomenon influencing the monsoon circulation). We then present a climatology of eddy shedding events and lead–lag relations of eddies with the anticyclone. We also evaluate the impact of increasing Asian emissions of NOx and NMVOCs on ozone and PAN during the eddy-shedding event, using model sensitivity simulations. Finally, we estimate the associated changes in ozone heating rates in the UTLS due to Asian trace gases being transported via eddy-shedding events.
2.1 Satellite observations
The Michelson Interferometer for Passive Atmospheric Sounding (MIPAS) on-board the European ENVIronmental SATellite (ENVISAT) (MIPAS-E) was launched in March 2002 into a polar orbit of 800 km altitude. Its orbital period is about 100 min. MIPAS-E provided continual limb emission measurements in the mid-infrared over the range 685–2410 cm−1 (14.6–4.15 µm) (Fischer et al., 2008). MIPAS monitored many atmospheric trace constituents including CO, PAN and O3. The details of the general retrieval method and set-up, error estimates and use of averaging kernel and visibility flag are documented by von Clarmann et al. (2009). Here, we analyse the MIPAS observations of CO, PAN and O3 during 1–8 July 2003.
To account for the comparatively low and altitude-dependent vertical resolution of MIPAS, the model data were convolved with the MIPAS averaging kernel to be directly comparable to MIPAS measurements of CO, PAN and ozone. MIPAS vertical resolution for CO, O3 and PAN in the UTLS is 5, 3.5 and 5 km, respectively. The data are contoured and gridded. For each grid point, the surrounding MIPAS data points are averaged while applying a distance weighting. The maximum distance for which MIPAS data points are considered is ±7∘ in latitude and ±15∘ in longitude (covering a box of 14∘ in latitude and 30∘ in longitude), and a minimum number of two data points per interpolation grid point are required. The data quality specifications as given in the metadata of the MIPAS data files were employed, namely only data with a visibility flag equal to 1 (all gases) and a diagonal value of the averaging kernel greater than 0.03 were used for ozone and PAN, while the diagonal value of the averaging kernel had to exceed 0.008 for CO to be used (personal communication with with Bernd Funke, 2018; see also Glatthor et al., 2007; Funke et al., 2009).
2.2 Model set-up
We employ the ECHAM5-HAMMOZ (Roeckner et al., 2003) aerosol-chemistry-climate model to understand redistribution of Asian trace gases via eddy shedding from the anticyclone. ECHAM5-HAMMOZ comprises the general circulation model ECHAM5 (Roeckner et al., 2003), the tropospheric chemistry module MOZ (Horowitz et al., 2003) and the aerosol module Hamburg Aerosol Model (HAM) (Stier et al., 2005). The chemistry of ozone, VOCs, NOx, and other gas-phase species is based on the MOZART-2 chemical scheme (Horowitz et al., 2003). It includes Ox-NOx-hydrocarbons with 63 tracers and 168 reactions. The details of the parameterizations and emissions used in the model as well as a validation of the results are described by Fadnavis et al. (2013, 2014, 2015) and Pozzoli et al. (2011).
The model simulations were performed with a T42 spectral resolution corresponding to about in the horizontal dimension and 31 vertical hybrid σ-p levels from the surface up to 10 hPa. Here, we note that our base year for aerosol and trace gas emissions is 2000. We performed two simulations: (i) a control experiment (CTRL) and (ii) a sensitivity experiment (Asia-10), where emissions of both NOx and NMVOCs were simultaneously reduced by 10 % over Asia (10∘ S–50∘ N, 60–130∘ E) similarly to earlier publications (Naik et al., 2005; Fadnavis et al., 2015). This fixed 10% reduction was chosen due to the spatial–temporal variability of NMVOCs over Asia and the inherent difficulty in obtaining a common trend value (Li et al., 2014). The impacts of this NMVOCs and NOx emission perturbation are investigated by analysing the associated anomalies (Asia-10 – CTRL) in ozone, PAN and ozone heating rates.
Both simulations were performed for the year 2003 driven by European Centre for Medium-Range Weather Forecasts operational analyses (Integrated Forecast System, IFS, cycle-32r2) meteorological fields (available every 6 h) (Uppala et al., 2005). All simulations include lightning NOx and the subsequent PAN production. Since the lightning parameterization is the same in the CTRL and sensitivity simulations, its impact may be negligible. However, there may be an indirect impact of changed emissions on lightning and thus on NOx or PAN production. The model simulations used here are the same as those used by Fadnavis et al. (2015). The climatology of ozone mass mixing ratio, winds and potential vorticity (PV) are obtained from ERA-Interim reanalysis data for the period 1995–2016. The anomalies are obtained from differences between daily mean values of July 2003 and daily climatology. Power spectral analysis and lag–lead correlations have been carried out on PV data for the period 1995–2016 to show climatological features.
Instantaneous ozone heating rates are calculated using the Edwards and Slingo (1996) radiative transfer model. We used the offline version of the model, with six shortwave and nine long-wave bands, and a delta-Eddington 2-stream scattering solver at all wavelengths in a set-up similar to other recent studies (Rap et al., 2015, Roy et al., 2017).

Figure 1Spatial distribution of potential vorticity (PVU) (1 PVU = 10−6 K m2 kg−1 s−1) (colour shades) at 370 K potential temperature surface and wind anomalies at 200 hPa from ERA-Interim reanalysis for (a) 1 July, (b) 2 July, (c) 3 July, (d) 4 July, (e) 5 July, (f) 6 July, (g) 7 July and (h) 8 July 2003. Wind vectors are represented by black arrows (m s−1). Eddies are shown with white circles.
3.1 A typical case study of eddy shedding from the monsoon anticyclone
The dynamics of the monsoon anticyclone is best portrayed at the 370 K potential temperature surface and the monsoon anticyclone is obvious as an area of low PV values (PV < 2 PVU, 1 PVU = 10−6 K m2 kg−1 s−1) (indicating tropospheric air mass) at this surface (Garny and Randel, 2016). Eddies are identified as air with low PV emanating from the monsoon anticyclone (Popovic and Plumb, 2001; Vogel et al., 2014). Past studies have shown that, during the monsoon season (June to September), the bulk of the low PV air at the isentropic level of 370 K is confined between about 20–35∘ N and 20–120∘ E, indicating the spatial extent of the anticyclone (Popovic and Plumb, 2001; Vogel et al., 2014; Garny and Randel, 2016). A pocket of low PV air mass detached from the boundary of the anticyclone (outside the anticyclone, 20–35∘ N and 20–120∘ E) is considered as an eddy. Figure 1a–h show the distribution of PV at 370 K during 1–8 July 2003. It can be seen that during this period the anticyclone was wobbling and shedding eddies eastward and westward over western Africa (20–30∘ N, 0–30∘ E) and the western Pacific (20–30∘ N; 120–150∘ E). Initially, during 2–5 July 2003, the ASM anticyclone shed an eddy westward over western Africa. The eddy moved further west with the progression of time. Later during 4–8 July 2003, eddy shedding occurred to the east of the anticyclone, over the western Pacific and the air detached from the anticyclone moved further eastward with time. The longitude-pressure section of PV shows that the eddy protrudes down to 400 hPa (not shown).

Figure 2Spatial distribution of potential vorticity (PVU) (colour shades) at 350 K potential temperature surface and wind anomalies in m s−1 (thin black vectors) at 200 hPa from ERA-Interim reanalysis for (a) 1 July, (b) 2 July, (c) 3 July, (d) 4 July, (e) 5 July, (f) 6 July, (g) 7 July and (h) 8 July 2003. The events of RWB-1, RBW-2 and RWB-3 are indicated by solid black, red and blue arrows, respectively.
Previous studies have shown that eddy-shedding events are associated with Rossby wave breaking (RWB) (Hsu and Plumb, 2000; Popovic and Plumb, 2001; Fadnavis and Chattopadhyay, 2017). The RWB is manifested as a rapid and large-scale irreversible overturning of PV contours on the 350 K isentropic surface. It is accompanied with a cyclonic circulation at 200 hPa (Strong and Magnusdottir, 2008; Fadnavis and Chattopadhyay, 2017). Figure 2a–h show the distribution of PV at the 350 K surface and the circulation at 200 hPa during 1–8 July 2003. It can be seen that, during 1–8 July 2003, three RWB events occurred: one near 30∘ E (referred as RWB-1), one near 70∘ E (referred as RWB-2) and another one near 120∘ E (referred to as RWB-3). Since RWB-3 was outside the region of the ASM anticyclone (over the western Pacific ∼150–170∘ E), it did not play a role in the eddy-shedding event of 1–8 July. If we track the locations of these RWB events (indicated by the black and red arrows), one can see that, with the progression of time, the RWB feature moved eastward. The eastward migration of RWB is linked to its movement along the subtropical westerly jet (Fadnavis and Chattopadhyay, 2017). Initially, during 1–5 July, RWB-1 was strong (PV > 2 PVU), while RWB-2 (PV < 2 PVU) was weak. During this period the southward- and westward-moving RWB-1 leads to eddy shedding over western Africa. Later, during 4–8 July, RWB-2 strengthened while RWB-1 weakened and disappeared. The southward- and eastward-moving RWB-2 was responsible for the eddy-shedding event near the western Pacific (see Fig. 2d–h).
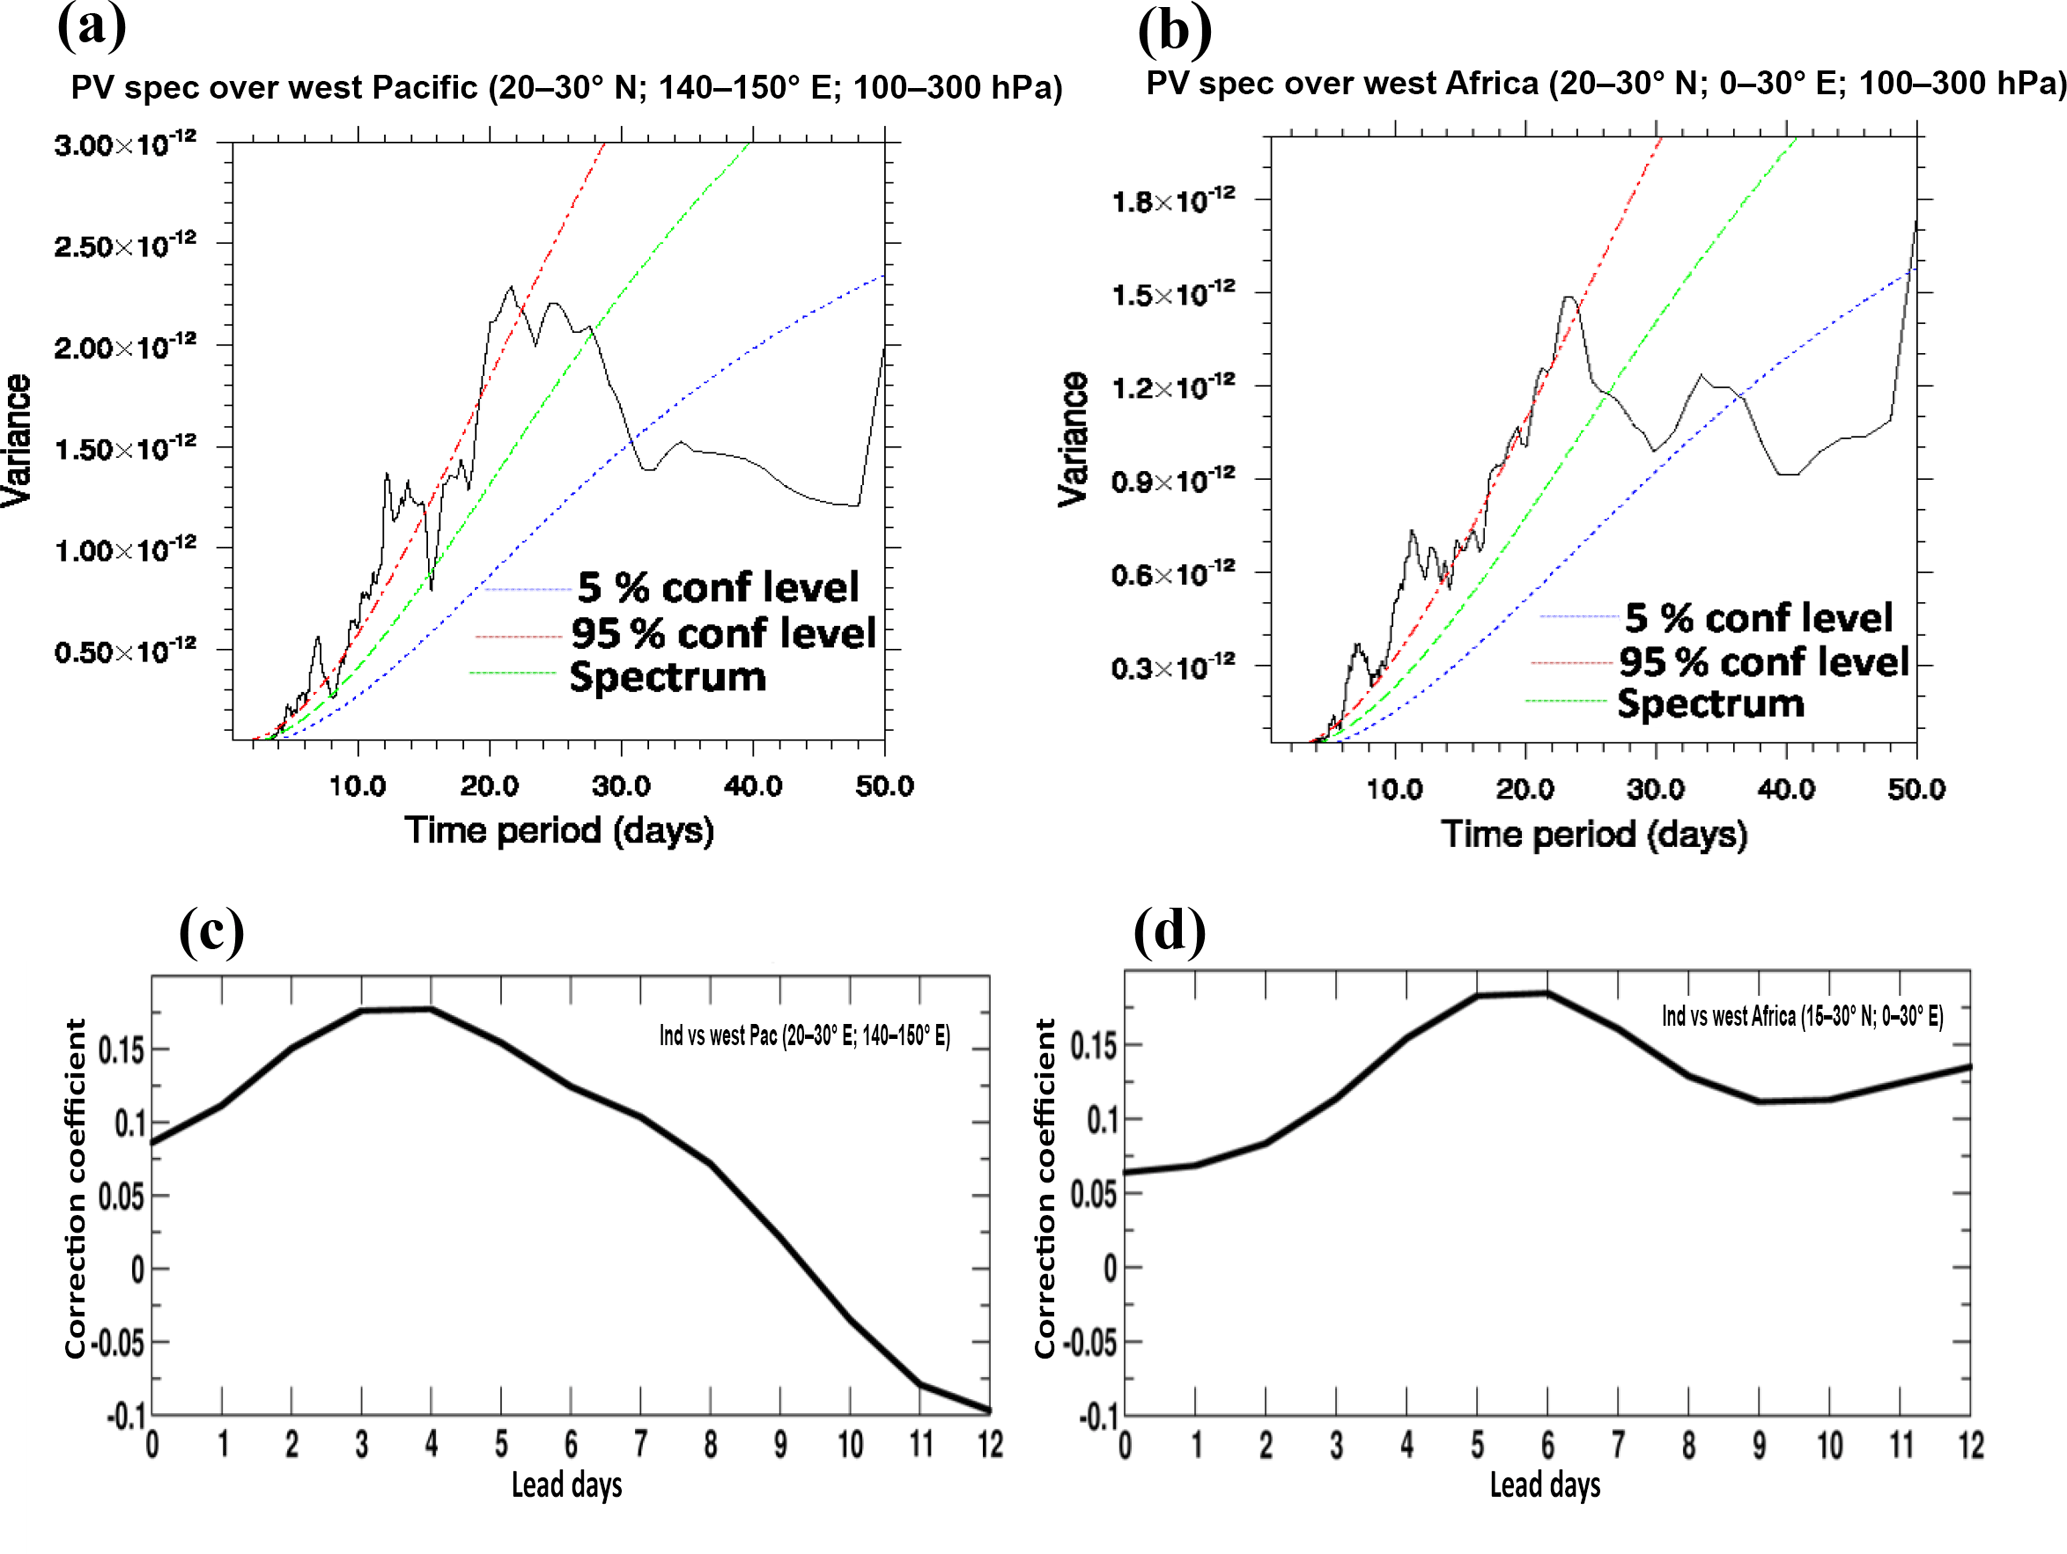
Figure 3Power spectral analysis of ERA-Interim PV averaged for 100–300 hPa and in June–September during 1995–2015 for (a) western Africa (20–30∘ N, 0–30∘ E) and (b) western Pacific (20–30∘ N, 140–150∘ E) and lag–lead Pearson correlation coefficient of PV in the monsoon anticyclone (85–90∘ E, 28–30∘ N) with (c) western Pacific (20–30∘ N, 140–150∘ E) and (d) western Africa (20–30∘ N, 0–30∘ E). In (a)–(b) the dotted green line indicates the spectrum and blue and red lines indicate 5 % and 95 % confidence levels for lag-1 autocorrelation. Any spectral peak above the red line is statistically significant at the 95 % confidence level.
3.2 Climatology of eddy shedding from the monsoon anticyclone
A power spectrum analysis (PSA) has been performed on the PV data (averaged for 300–100 hPa) during 1995–2016 for western Africa (20–30∘ N, 0–30∘ E) and the western Pacific (20–30∘ N, 140–150∘ E). The PSA uses the temporal-to-frequency fast Fourier transform in order to identify dominant signal frequencies. It provides information on signal power (square of variance) associated with the frequency components of the signal, with the dominant signal periodicity being the inverse of the dominant signal frequency. Figure 3a–b show the distribution of power spectral variance over the western Africa and western Pacific regions. The variances corresponding to the periodicities of 3–5 days, 12–15 and 18–21 days are significant at 95 % confidence level for both the regions, indicating that the eddy-shedding activity is dominated in the range of synoptic frequency (∼10 days). Popovic and Plumb (2001) also indicated a typical duration of an eddy-shedding event of ∼4–8 days. We compute the frequency of eddy-shedding days (PV < 1 PVU) occurring over western Africa and the western Pacific. The ERA-Interim data for the last two decades show that eddy shedding is quite frequent over western Africa (∼68 %) and the western Pacific (∼25 %). The lag–lead correlation of PV (averaged for 200–100 hPa) for the central region of the anticyclone (85–90∘ E, 28–30∘ N) with PV averaged over the western Pacific shows a maximum positive lead correlation at 3–4 days (Fig. 3c). Similarly, PV over western Africa shows a maximum positive lead correlation for 5–6 days with the PV averaged over the monsoon anticyclone (Fig. 3d). This indicates that the transport of the eddies from the anticyclone (source region) has a typical duration of 3 to 4 days over the western Pacific and 5 to 6 days over western Africa. This transport time is the timescale over which the trace gases are moved to remote locations from the ASM anticyclone.
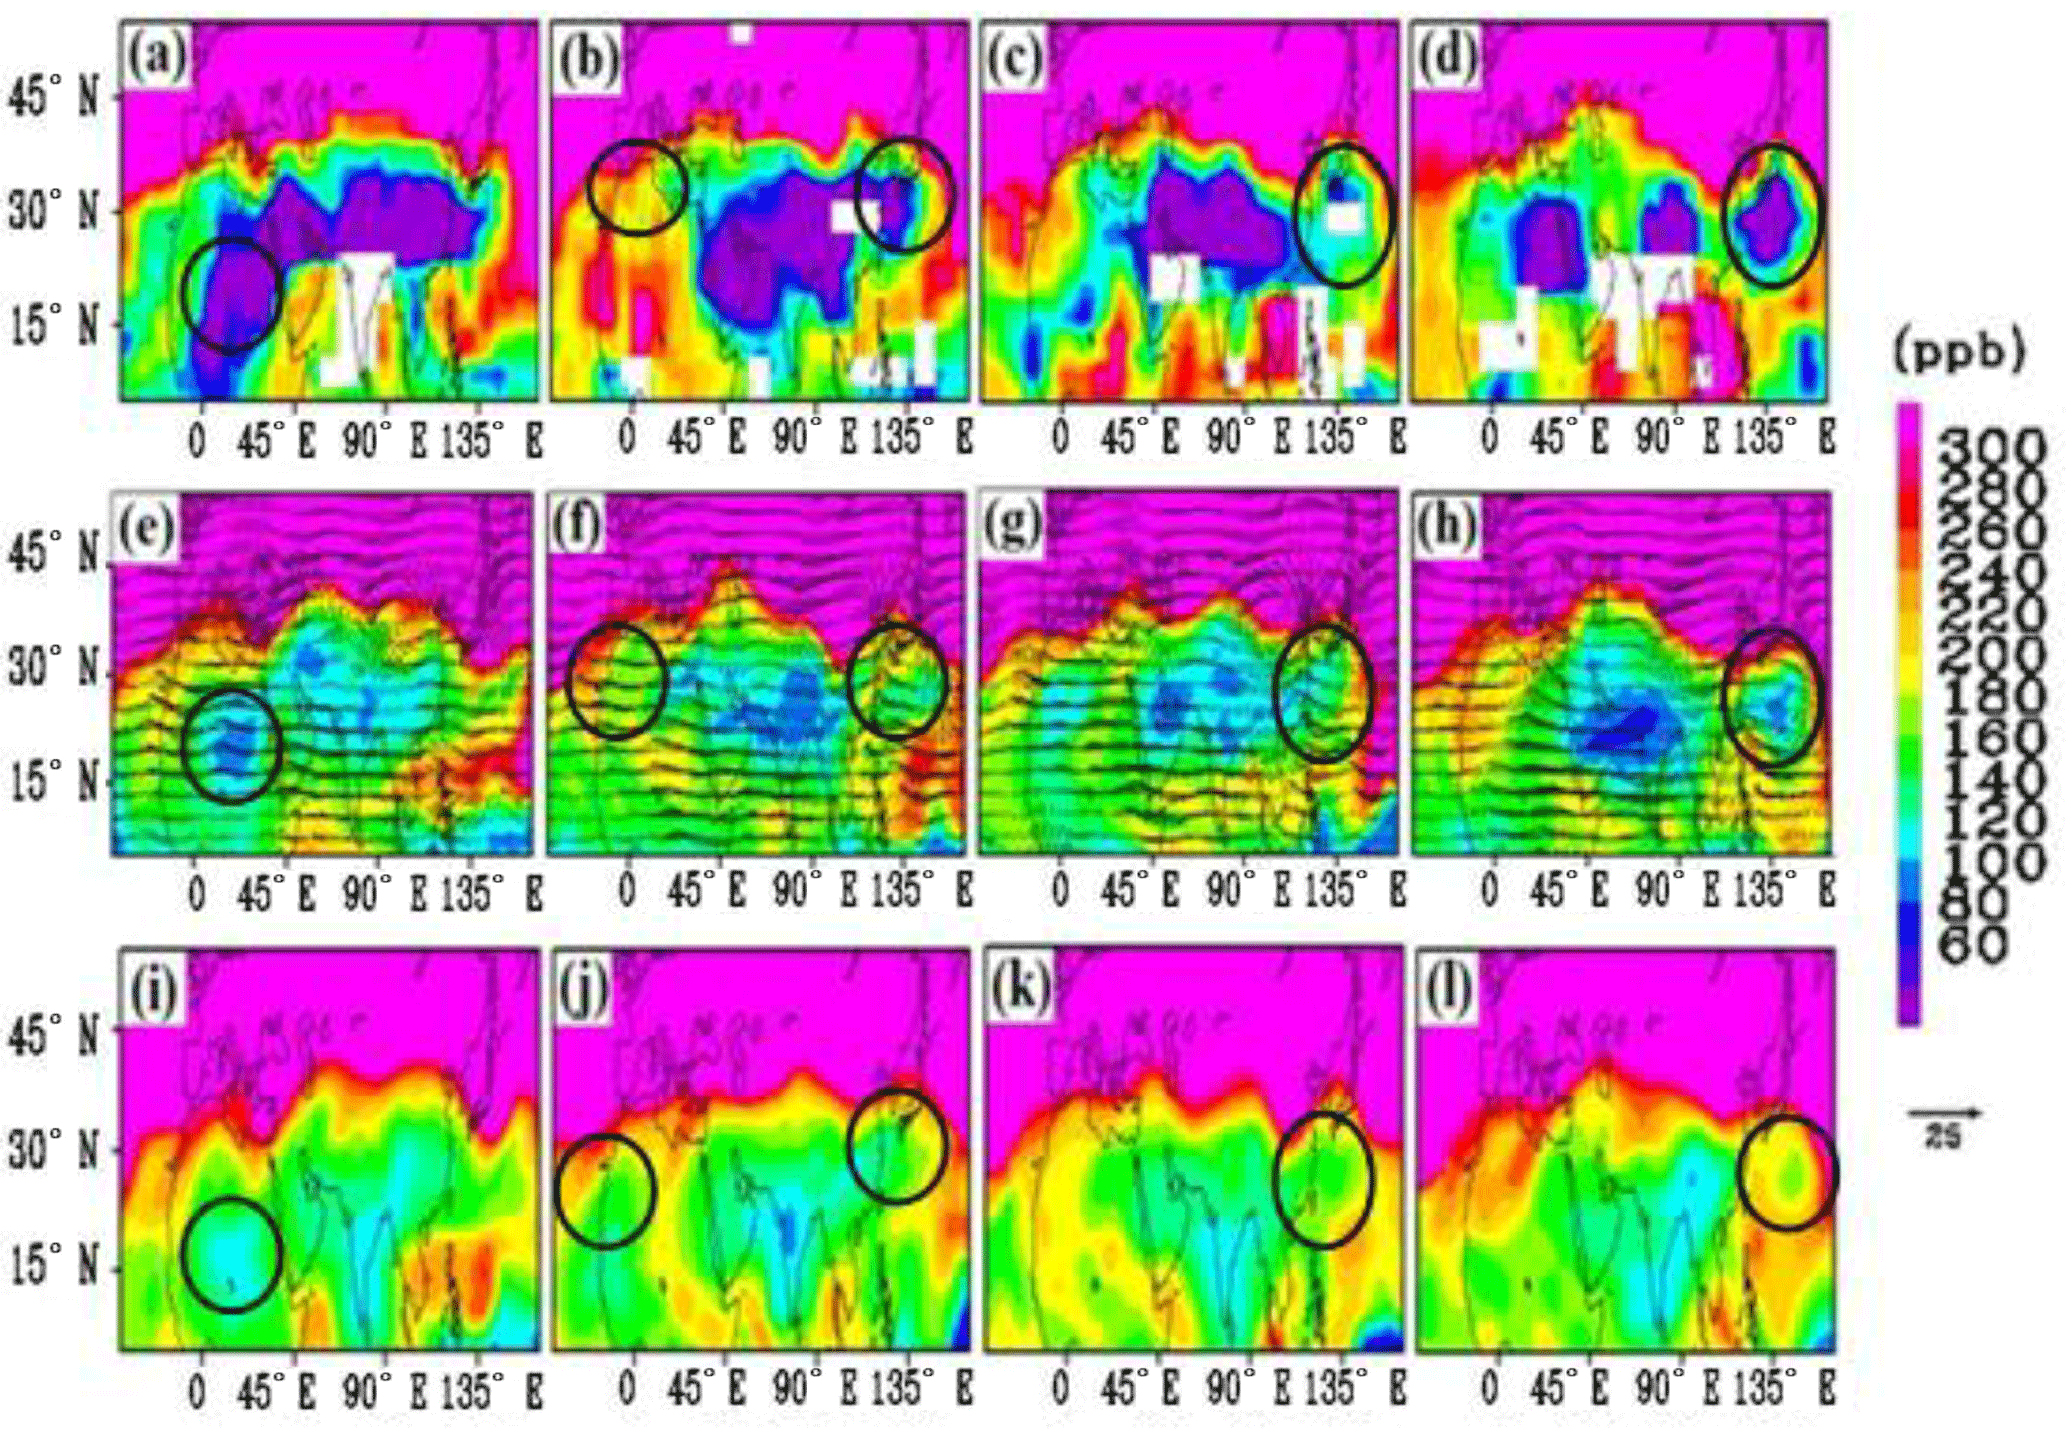
Figure 4Spatial distribution of ozone mixing ratios (ppb) (colour shades) corresponding to MIPAS satellite observations at 16 km for (a) 1–2 July, (b) 3–4 July, (c) 5–6 July, (d) 7–8 July 2003; ERA-Interim reanalysis at 100 hPa for (e) 2 July, (f) 4 July, (g) 6 July and (h) 8 July 2003, and ECHAM5-HAMMOZ CTRL simulations at 16 km for (i) 2 July, (j) 4 July, (k) 6 July and (l) 8 July 2003. Black arrows in panels (e)–(h) show wind anomalies (m s−1) at 200 hPa. Minimum amounts of ozone near the location of eddies are shown with black circles.
3.3 Long-range transport of trace gases
3.3.1 Horizontal transport of ozone, CO and PAN via eddies
Biomass burning over south-east Asia and east Asia produces large amounts of CO, NOx, VOCs, PAN, ozone and aerosols (e.g. Streets et al., 2003; Fadnavis et al., 2014). The monsoon convection over the Bay of Bengal, southern slopes of Himalaya and South China Sea (see Fig. S1 in the Supplement) lifts up these species into the anticyclone, where they may be dispersed in the UTLS by the vibrant anticyclone and its associated eddies. Figure 4a–h show the distribution of ozone during 1–8 July 2003 (MIPAS O3 is binned for 2 days and simulated O3 is plotted for alternate days) in the anticyclone at 16 km (∼100 hPa). Ozone concentrations from MIPAS satellite measurements and model simulations (CTRL) are plotted at 16 km and from ERA-Interim reanalysis at 100 hPa. For comparison, we interpolated the model data to the MIPAS altitude grid and smoothed it with the averaging kernel. The ASM anticyclone is marked by minimum ozone although its precursors (e.g. CO, NOx and CH4) show maxima (Randel et al., 2010; Roy et al., 2017). The spatial pattern of low amounts of ozone in the anticyclone and the associated eddies is evident in all of the data sets during 1–8 July 2003. The locations of ozone local minima in the model are slightly shifted relative to the locations of eddies and relative to the locations of ozone local minima in MIPAS and ERA. During 1–5 July, ozone concentrations in the eddy over western Africa are ∼40–200 ppb in MIPAS, ∼60–180 ppb in ERA-Interim and 100–200 ppb in the model simulations. During 4–8 July, the eddy over the western Pacific shows ozone values of ∼60–180 ppb in MIPAS, ∼60–180 ppb in ERA-Interim and ∼120–200 ppb in the model simulations. In general, the model overestimates ozone by ∼60 ppb more than ERA-Interim and MIPAS measurements.
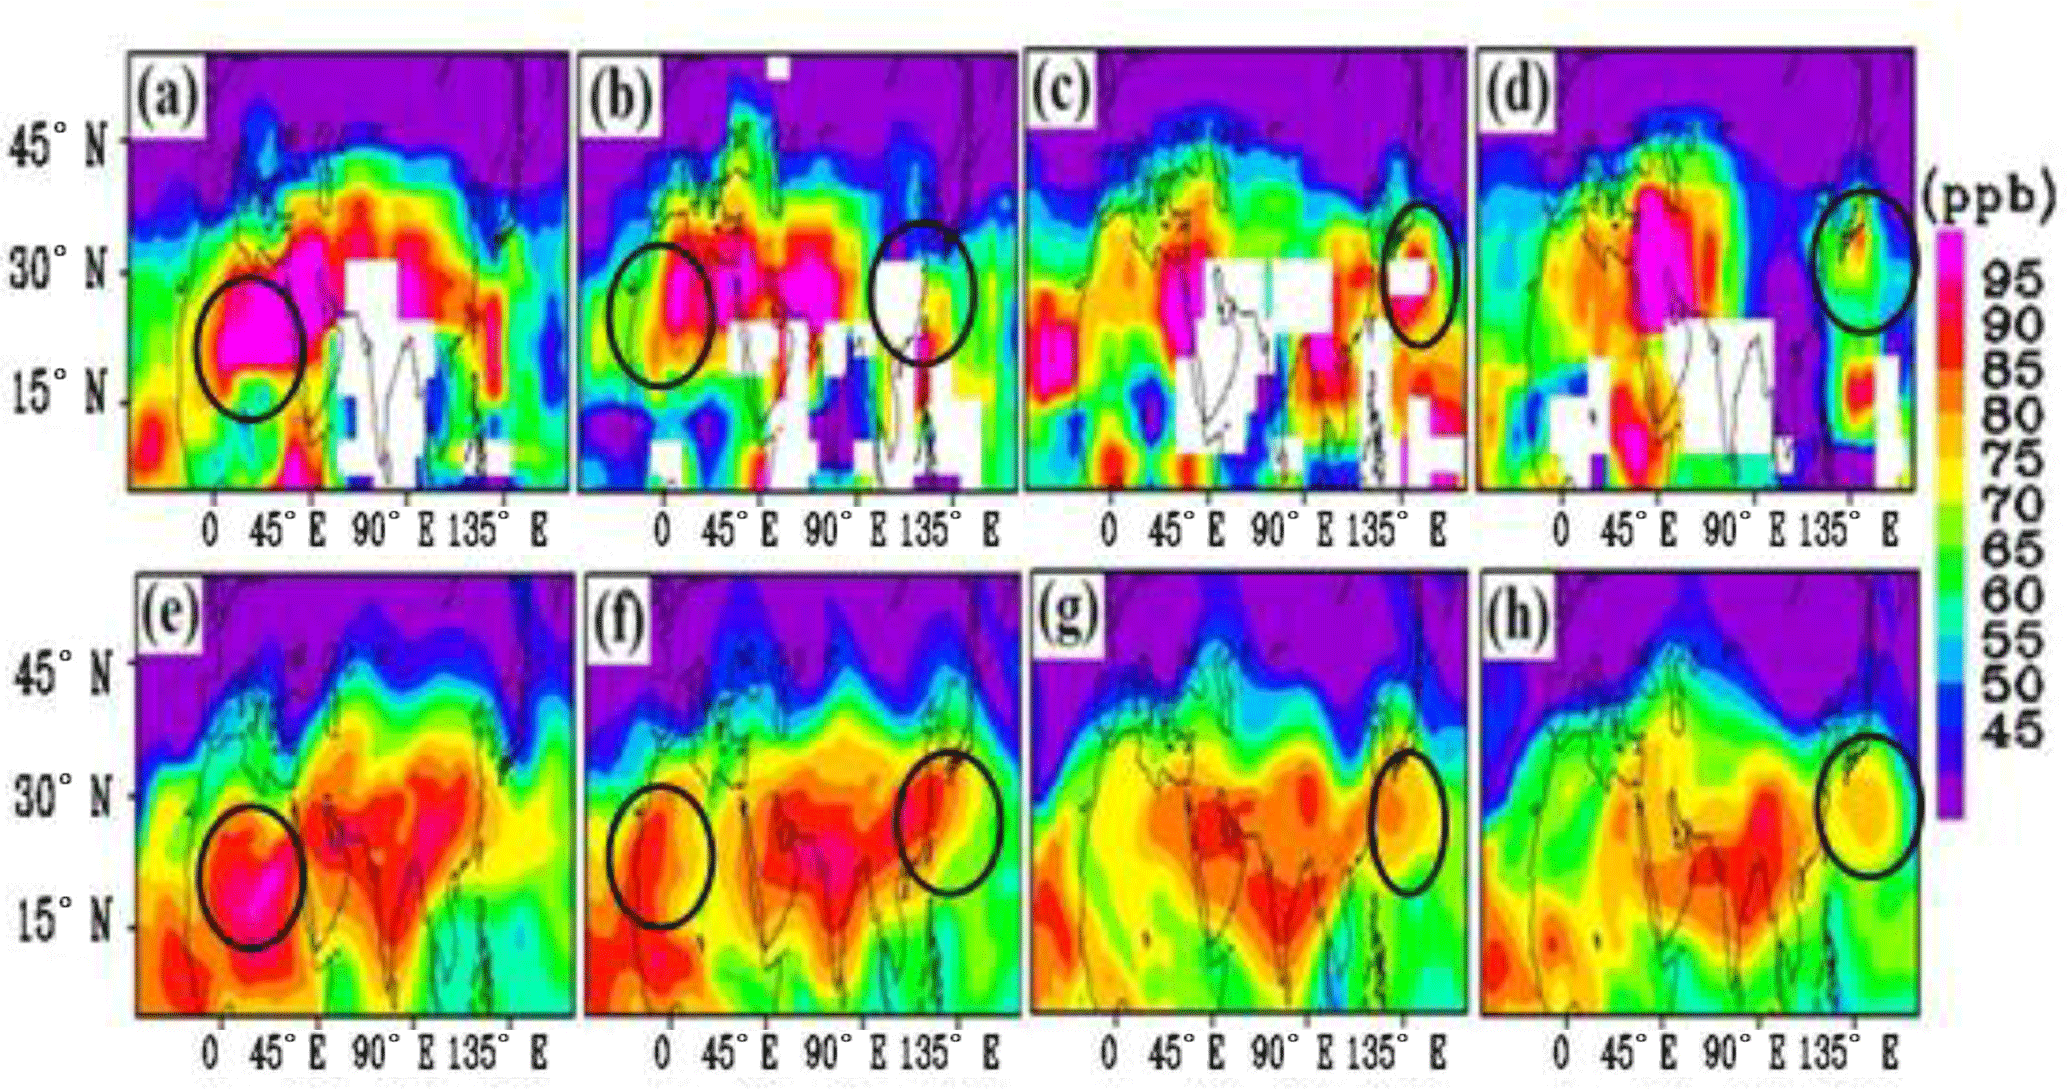
Figure 5Spatial distribution of CO mixing ratios (ppb) at 16 km: MIPAS satellite observations for (a) 1–2 July, (b) 3–4 July, (c) 5–6 July, (d) 7–8 July 2003 and ECHAM5-HAMMOZ CTRL simulations for (e) 2 July, (f) 4 July, (g) 6 July and (h) 8 July 2003. Maximum amounts of CO near the location of eddies are shown with black circles.
Figure 5a–h show the distribution of CO from MIPAS observations and model simulations during 1–8 July 2003 (MIPAS CO is binned for 2 days and simulated CO is plotted for alternate days). The confinement of high concentrations of CO in the anticyclone and in eddies is seen in both MIPAS observations and model simulations. During 1–5 July, eddies over western Africa and western Pacific show CO volume mixing ratios of ∼85–95 ppb in MIPAS and ∼70–95 ppb in the model simulations. Similarly to ozone the maximum in the CO distribution is not collocated with eddies. Further, slight differences between model simulations and MIPAS observations are found. These differences may be due to coarse resolution, uncertainties in emissions, chemistry represented and transport processes in the model.
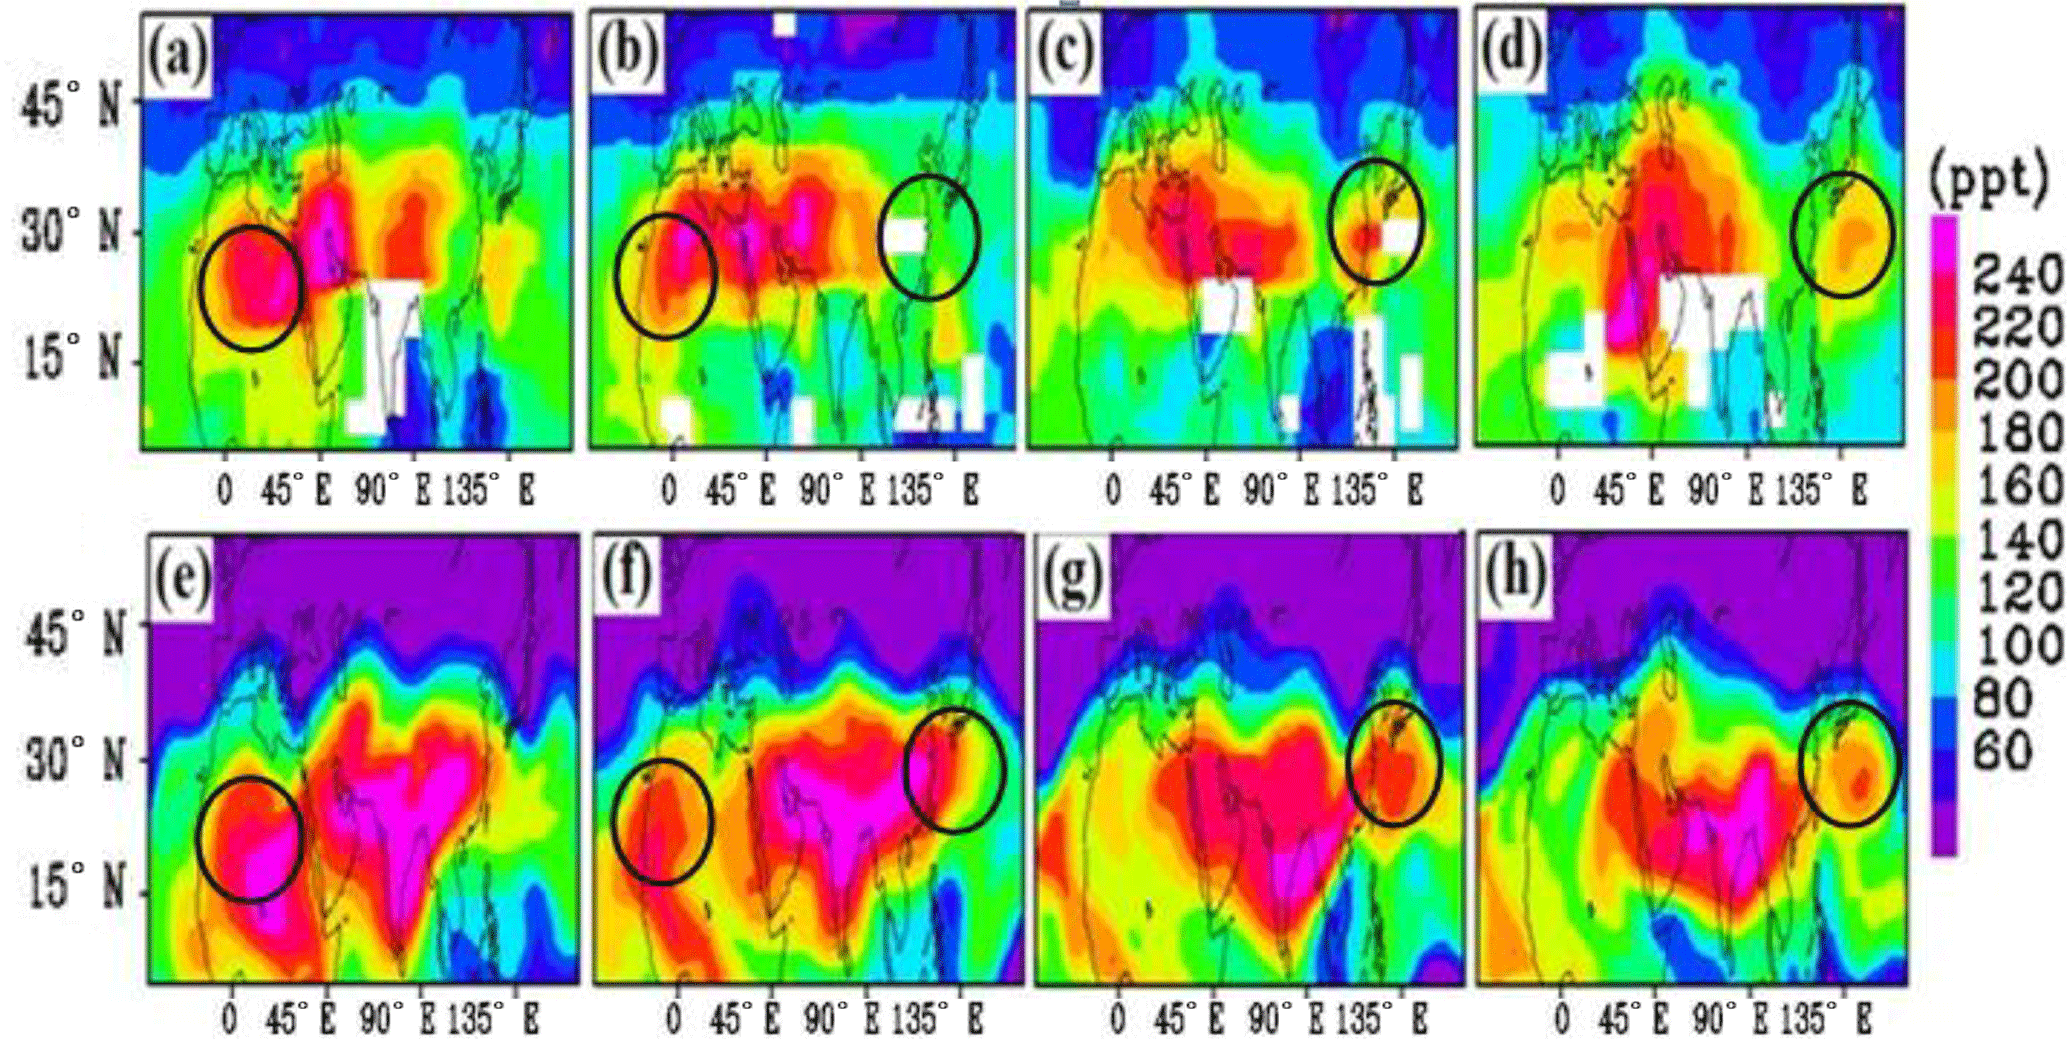
Figure 6Spatial distribution of PAN mixing ratios (ppt) at 16 km: MIPAS satellite observations for (a) 1–2 July, (b) 3–4 July, (c) 5–6 July and (d) 7–8 July 2003, and ECHAM5-HAMMOZ CTRL simulations for (e) 2 July, (f) 4 July, (g) 6 July and (h) 8 July 2003. Maximum amounts of PAN near the location of eddies are shown with black circles.
Figure 6a–h show the distribution of PAN from MIPAS measurements and the model simulation (CTRL) at 16 km during 1–8 July 2003 (MIPAS PAN mixing ratios are binned for 2 days and simulated PAN is plotted for alternate days). A confinement of high amounts of PAN in the anticyclone and the associated eddies is seen both in the MIPAS measurements and the model simulations. During 1–5 July, MIPAS observed amounts of PAN are ∼120–240 ppt in eddies over western Africa, while the model simulation shows ∼180–240 ppt of PAN at the same location. The eddy over the western Pacific shows PAN values of ∼160–240 ppt both in MIPAS measurements and model simulations.
There are differences in amounts of ozone, CO and PAN from model simulation, satellite observations and ozone from ERA-Interim. These differences may be due to a number of reasons, e.g. different grid sizes on MIPAS, ERA-Interim and model data, binning of MIPAS data for 2 days to accommodate better spatial coverage, uncertainties in the model emission inventory and retrieval errors in the satellite data. A maximum in PAN near the location of eddies differs in MIPAS and model. Comparison of Fig. 1 and Figs. 4–6 shows that the minimum in ozone and maximum in CO and PAN is not collocated at eddies. The location varies slightly in species and data sets (in MIPAS, ERA and model). This may be due to differences in data sets and production and loss processes of each species.

Figure 7Longitude-pressure section (averaged for 20–40∘ N) of CO (ppb) from ECHAM5-HAMMOZ CTRL simulation for (a) 2 July, (b) 4 July, (c) 6 July and (d) 8 July 2003. (e)–(h) same as (a)–(d) but for PAN (ppt). Thick black line indicates the tropopause and black dotted circles indicate maximum amounts of CO and PAN near eddies. Pressure (hPa) is indicated on the left y axis and altitudes (km) on the right y axis. Wind vectors (m s−1) are shown by black arrows. Vertical velocity field is scaled by a factor of 300.
3.3.2 Vertical distribution of CO, PAN and ozone
Further, we analyse the vertical distribution of CO and PAN as an indication of Asian biomass-burning emissions. Figure 7 shows longitude-pressure cross sections (averaged for 20–40∘ N) of CO and PAN from the CTRL simulation, with wind vectors depicting circulation patterns. It illustrates that during 1–5 July 2003 a plume of CO and PAN was uplifted from the Asian region (80–120∘ E), moving further upward into the UTLS. The location of the plume (Fig. 7) coincides with a strong convection region – see Fig. S1 – showing combined cloud droplet (CDNC) and ice crystal (ICNC) number concentrations from the CTRL simulation. Figures 7 and S1 together indicate that surface emissions are lifted up by the monsoon convection. In the upper troposphere (∼120 hPa), westward horizontal transport of CO/PAN towards western Africa is obvious as a result of eddy shedding during the respective days. In particular, during 2–4 July high amounts of CO and PAN are observed near 0–30∘ E at 100 hPa (Fig. 7a–b and e–f). On 2 July, there is some PAN transport over the western Pacific. During 4–8 July 2003, eddy shedding occurs to the east of the anticyclone over the western Pacific (120–150∘ E) (see Fig. 1e–f). Eastward horizontal transport of CO/PAN in the regions of eddy shedding is evident in Fig. 7c–d and g–h. The Asian trace gases then disperse downward into the troposphere (to ∼500 hPa over the western Pacific and to ∼200 hPa over western Africa) and are partially lifted into the lower stratosphere.
The vertical distribution of ozone shows low amounts of ozone extending from the convective regions of the Bay of Bengal and the South China Sea (∼15–25∘ N) to the upper troposphere (Fig. S2a–d), with amounts of ozone of ∼100–200 ppb near the tropopause (see also Fig. 4i–l). The lower amounts of ozone over the Asian troposphere may be due to clean marine air masses during the monsoon season (Zhao et al., 2009). The feature of low ozone air mass ascent is less evident than the CO and PAN vertical ascent due to a number of factors which influence ozone production and loss processes at different altitudes in the troposphere and lower stratosphere, such as stratospheric intrusions, lightning, etc. (see discussions in Sect. 3.4).
3.4 Influence of Asian emissions on extratropical UTLS
In this section, we investigate the influence of Asian anthropogenic emissions of NMVOCs and NOx on the distribution of PAN and ozone in the tropical/extratropical UTLS from sensitivity experiments. Figure 8a–d show anomalies of PAN (Asia-10-CTRL) at 16km during 1–8 July 2003 (plotted on alternate days). The negative anomalies in PAN are seen confined to the region of the anticyclone and the associated eddies (1–5 July over western Africa and 4–8 July over the western Pacific). These anomalies portray the effect of Asian boundary layer emissions (NMVOCs and NOx) on the upper level anticyclone and the associated eddies. A number of studies (Randel et al., 2010; Fadnavis et al., 2013, 2015; Vogel et al., 2014) have shown lifting of Asian emissions to the UTLS by the monsoon convection and its confinement in the anticyclone. A 10 % decrease in Asian NMVOCs and NOx emissions decreases amounts of PAN by ∼5–23 % in the ASM anticyclone and the associated eddies over western Africa and the western Pacific.
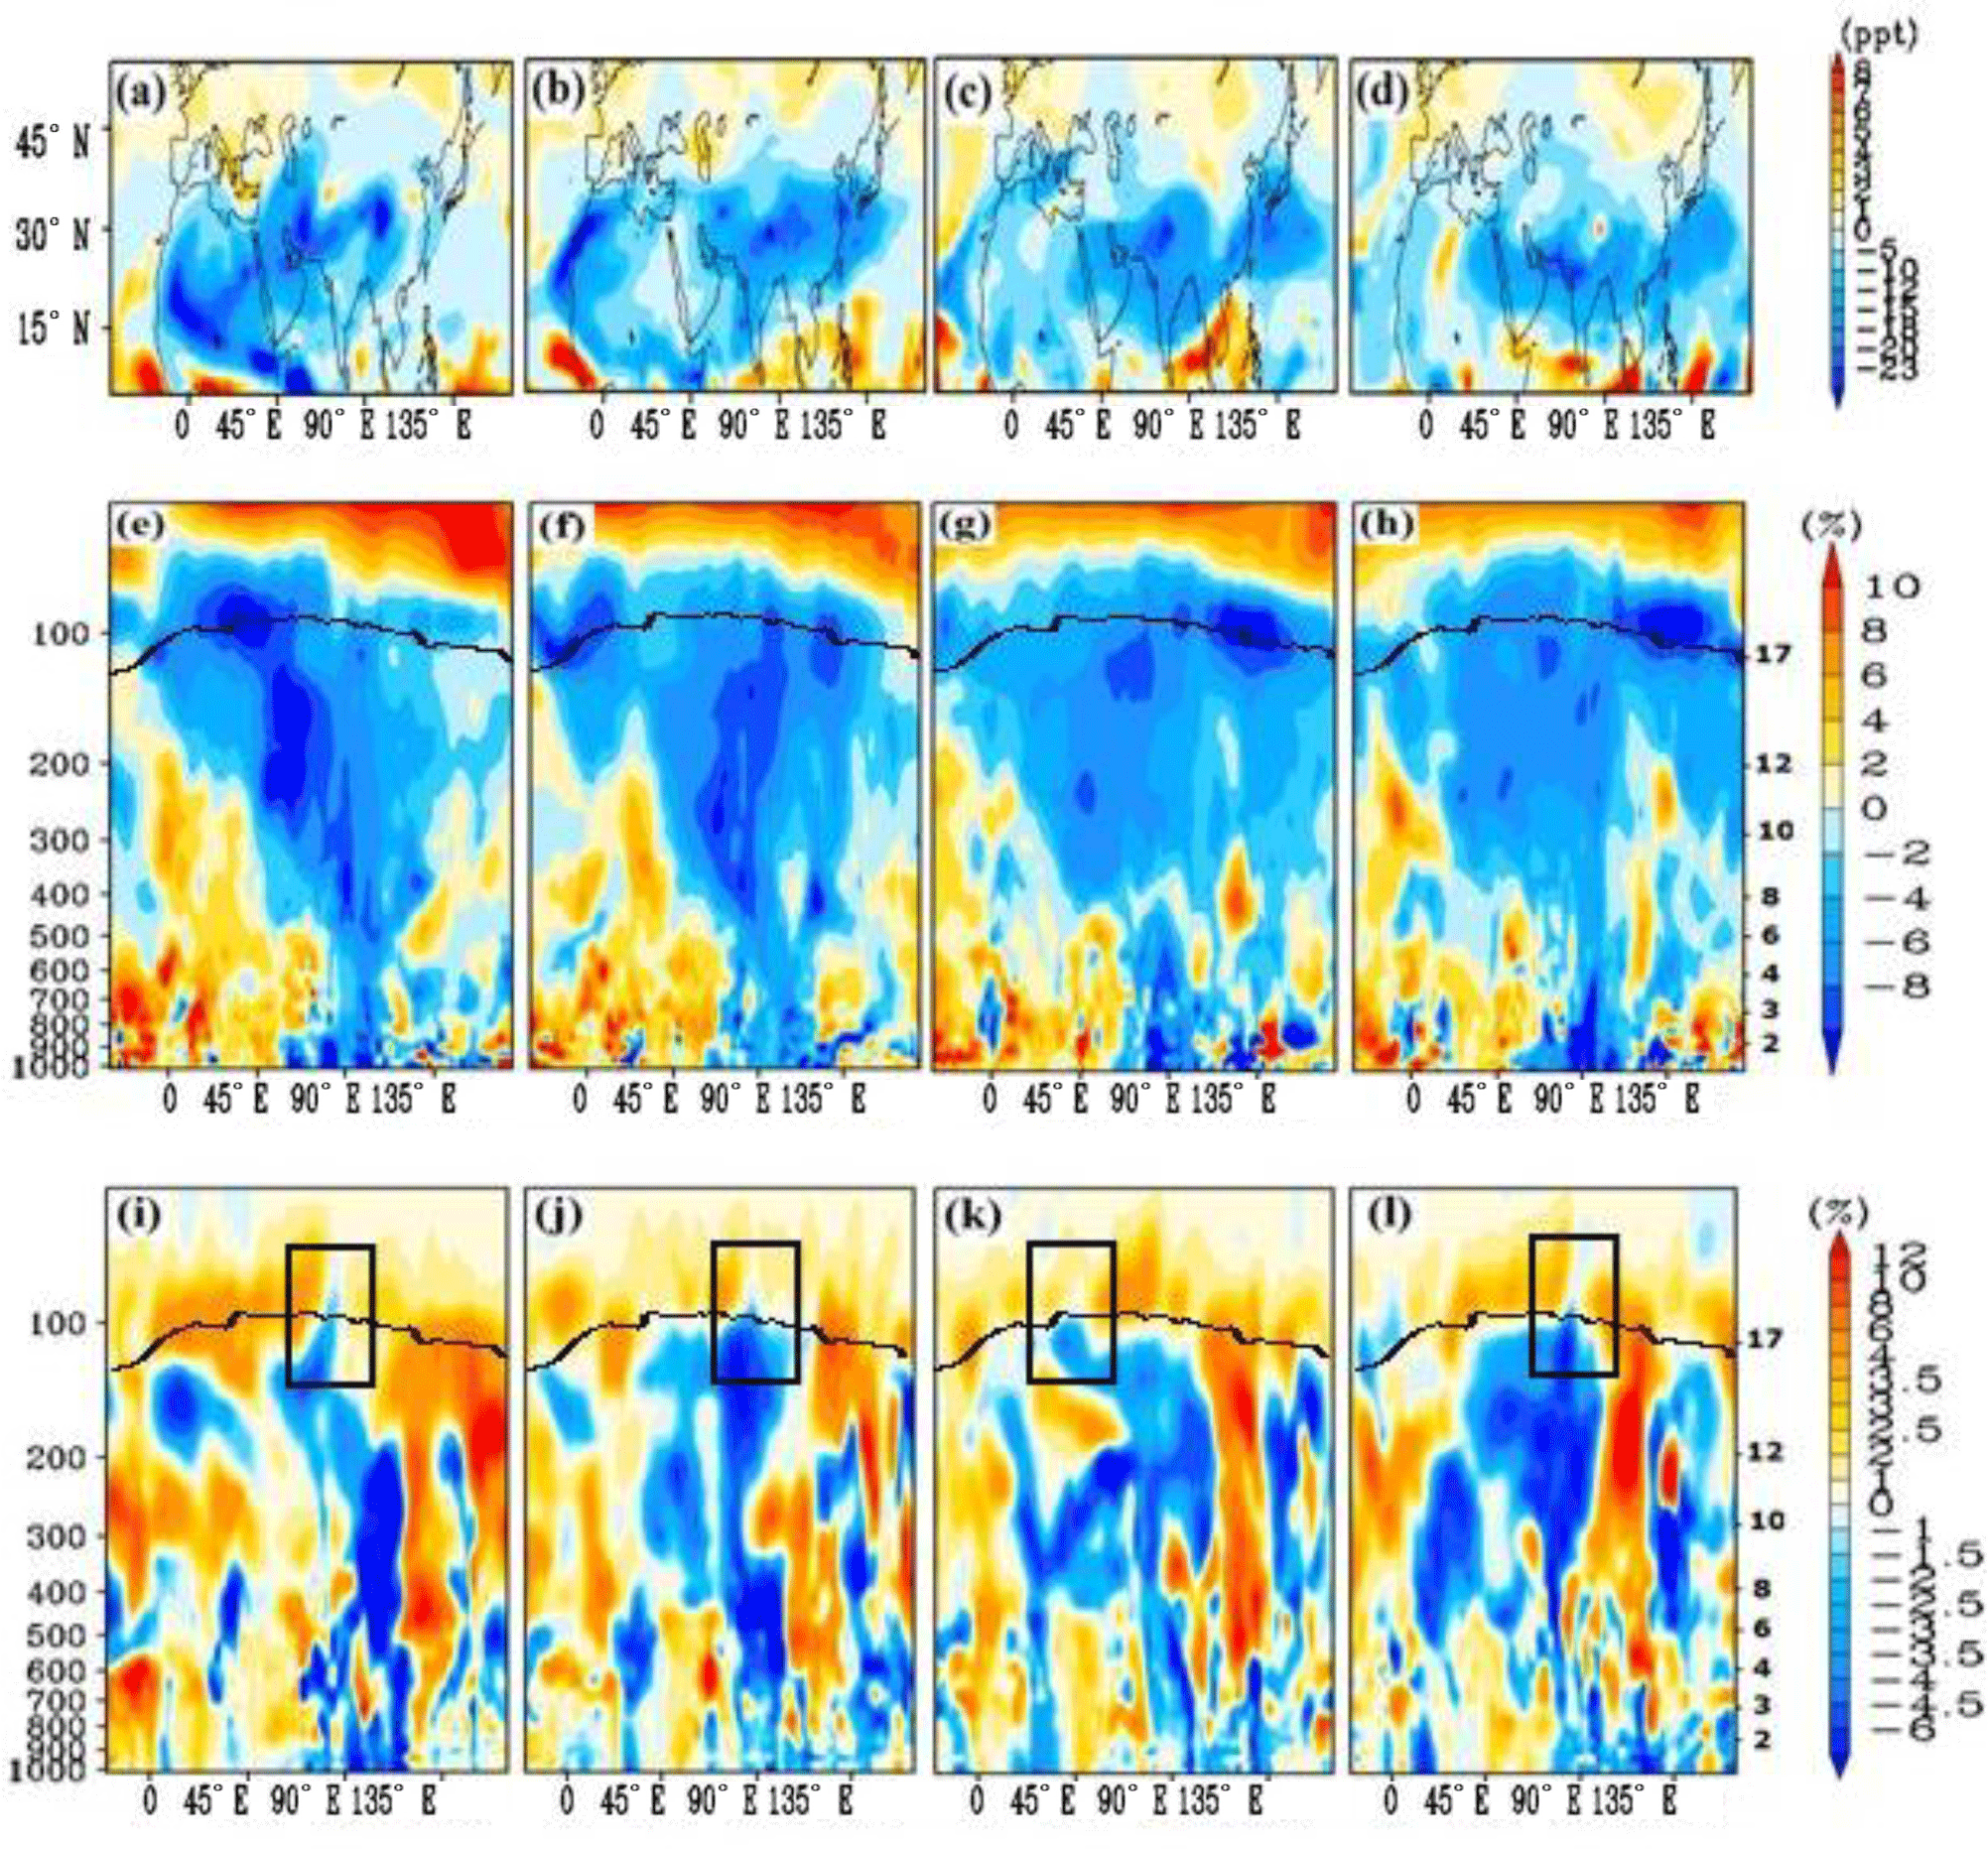
Figure 8Spatial distribution of anomalies (Asia-10-CTRL) of PAN mixing ratios (ppt) (colour shades) at 16 km from ECHAM5-HAMMOZ model simulations for (a) 2 July, (b) 4 July, (c) 6 July, (d) 8 July 2003. Longitude-pressure distribution (averaged for 20–40∘ N) of anomalies of PAN (%) for (e) 2 July, (f) 4 July, (g) 6 July and (h) 8 July 2003. Panels (i)–(l) are the same as (e)–(h) but for ozone anomalies (%) (averaged for 18–20∘ N). Thick black line indicates the tropopause. Pressure (hPa) is indicated on the left y axis and altitudes (km) on the right y axis. Black boxes in the bottom panels indicate regions of cross-tropopause transport.
Further, we analyse the vertical distribution of anomalies of PAN and ozone. Figure 8e–h show longitude-pressure sections of anomalies of PAN. It shows negative anomalies (in response to reduced Asian emissions) along the transport pathways (Fig. S1), i.e. from the boundary layer of the Asian region (80–120∘ E) into the upper troposphere and westward/eastward transport from the anticyclone owing to eddy shedding. These anomalies extend above the tropopause, indicating cross-tropopause transport. Upward transport across the tropopause in monsoon season has been demonstrated to occur in recent tracer studies (Ploeger et al., 2017; Vogel et al., 2018). PAN is rather long-lived in the cold tropopause region and should therefore behave similarly to inert trace gases in the model simulation (Fadnavis et al., 2014, 2015). Our simulations show that a 10 % reduction in Asian emissions of both NMVOCs and NOx, results in a decrease in the amount of PAN by ∼2–10 % over north-western Africa during 1–5 July and over the western Pacific during 4–8 July 2003.
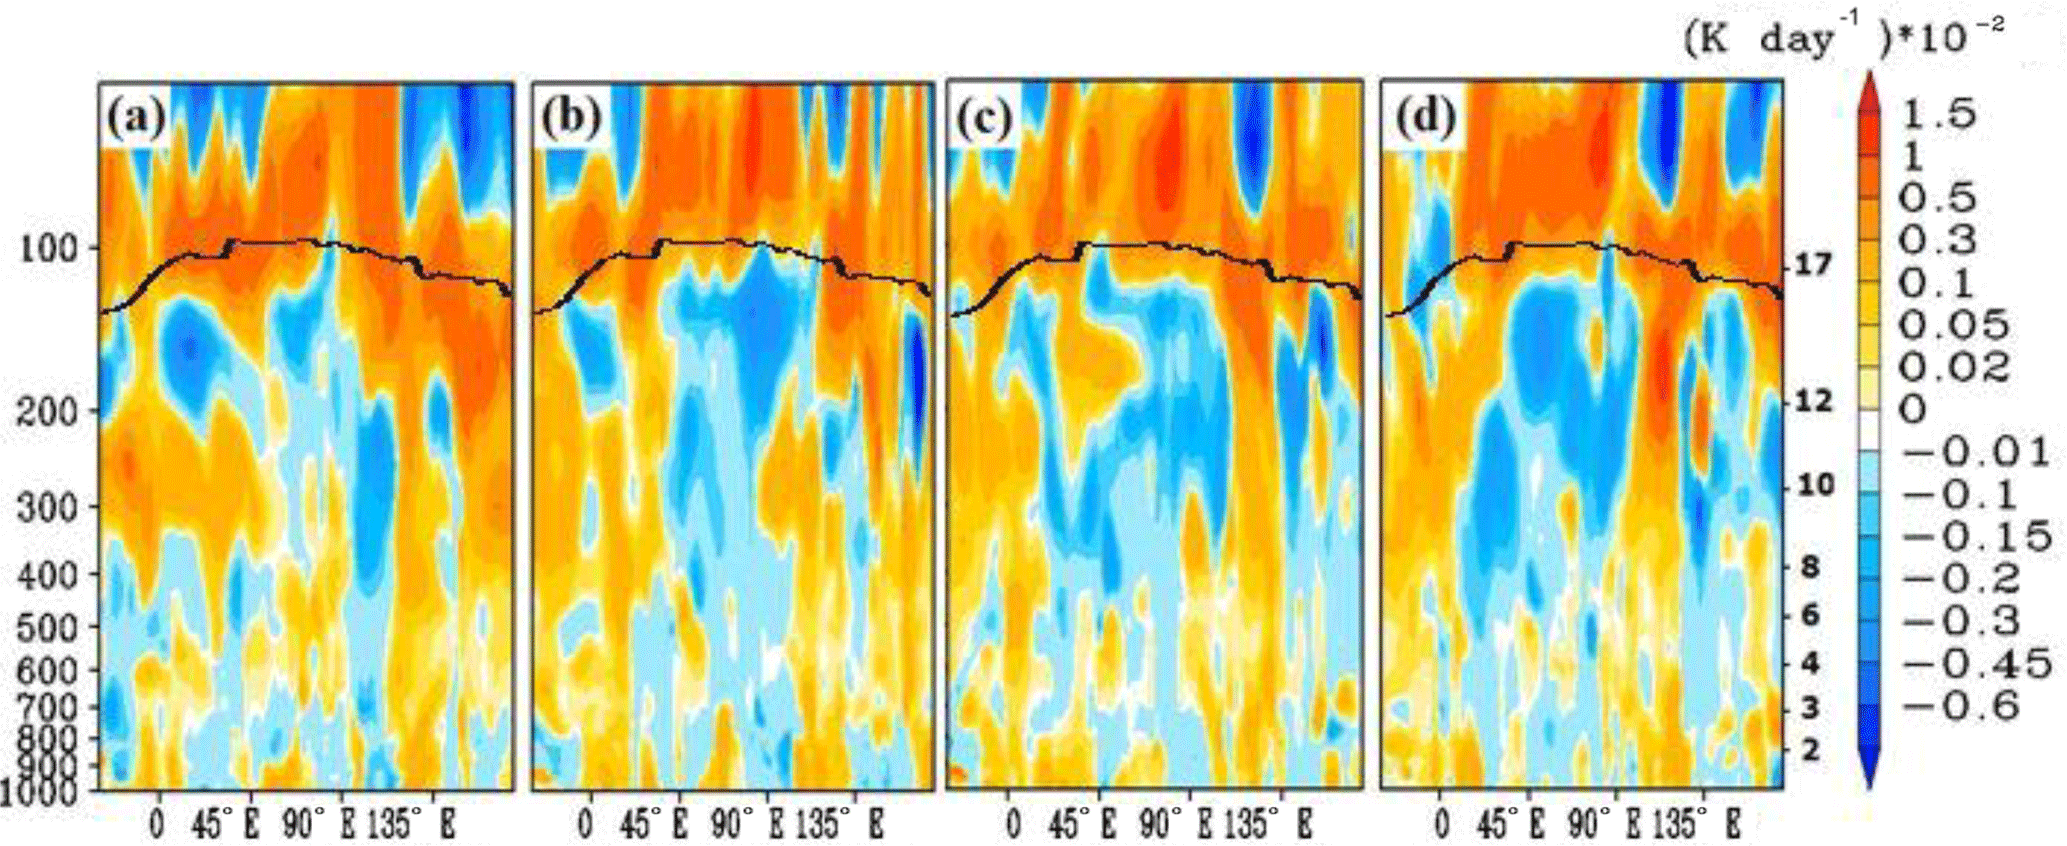
Figure 9Longitude-pressure distribution (averaged for 18–20∘ N) of anomalies of ozone heating rates ((K day−1) ) for (a) 2 July, (b) 4 July, (c) 6 July and (d) 8 July 2003. Pressure (hPa) is indicated on the left y axis and altitudes (km) on the right y axis. The thick black line indicates the tropopause.
The vertical distribution of ozone anomalies (Fig. 8i–l) show negative values (−1 to −4.5 %) in the troposphere extending from the surface up to ∼180 hPa along the transport pathways (∼90∘ E) and in the region from where cross-tropopause transport occurs. Near the tropopause (except in the region of cross-tropopause transport; indicted by boxes in Fig. 8i–l) ozone anomalies are positive, varying between 1 and 8 % (Fig. 8i–l). In contrast to PAN, ozone will be chemically active during the slow ascent over the monsoon area for several months (Vogel et al., 2018). Ozone loss rates are likely to be affected in the Asia-10 simulations. For example reduced NOx will lead to a lower efficiency of ozone loss providing a reason for higher ozone in the Asia-10 runs. Further, less NMVOCs in Asia-10 simulations might lead to lower OH concentrations in the lowermost stratosphere above the monsoon region. The major ozone loss cycle in the lowermost stratosphere in the tropics is driven by HOx radicals with the rate limiting step being the reaction of OH with ozone. The anomalies of OH concentrations are negative near the tropopause indicating lower ozone loss rates (Fig. S3). The changes in dynamics (e.g stratospheric intrusions and lightning) due to emission sensitivity may also partially contribute to positive anomalies of ozone near the tropopause. Ozone distributions from CTRL simulations show stratospheric intrusion in the northern part of the anticyclone ∼30∘ N (Fig. S2) which is enhanced (positive anomalies) in the Asia-10 simulations (Fig. S4a–d). The spatial distribution of ozone anomalies (Fig. S4e–h) indicate that the response to emission reductions generates negative anomalies of ozone in the southern part of anticyclone (15–25∘ N; 60–120∘ E) (may be due to cross tropopause of monsoon air), while ozone anomalies are positive in the northern part of the anticyclone (which may be associated with stratospheric intrusions). The ozone variability near the tropopause is generally driven by the strong mixing of tropospheric and stratospheric air masses.
In Fig. 8i–l, negative values of ozone anomalies extending from the surface to ∼180 hPa may likely be related to the vertical extent of transport and associated outflow. A plume of high values of CO (∼95 ppb) and PAN (∼260 ppt) (Fig. 7), together with relatively low amounts of ozone (70–80 ppb) (Fig. S2) reaching to ∼180 hPa and leads to a strong gradient near the tropopause. This also indicates that the outflow of uplifted trace gases in the upper troposphere reaches to ∼250–180 hPa. The moderate concentrations of CO and PAN between 180 and 70 hPa may also be due to the slow ascent into the lower stratosphere of these Asian pollutants (Park et al., 2008).
During the monsoon season, marine air masses containing low amounts of ozone prevail over the Asian land mass. The monsoon air mass gathers Asian boundary layer ozone precursors (and other trace gases) and are uplifted to the UTLS by the monsoon circulation. It should be noted that a decrease in emissions of NOx and NMVOCs in the Asia-10 simulations produces lower amounts of ozone in the troposphere than in the CTRL simulation. Therefore, in the regions of eddy shedding, negative anomalies near 200–300 hPa indicate transport of monsoon air (via eddies) towards western Africa during 1–5 July and to the western Pacific during 4–8 July.
3.5 Influence of Asian emission of trace gases on ozone heating rates
Ozone is a dominant contributor to radiative heating in the tropical lower stratosphere, impacting the local heating budget and non-local forcing of the troposphere below (Gilford and Solomon, 2017). We estimate changes in ozone heating rates caused by a 10 % decrease in Asian NMVOCs and NOx emissions. Figure 9a–d, show anomalies of ozone heating rates on 1–8 July (plotted on alternate days), indicating a reduction in ozone heating rates in response to a decrease in Asian NMVOCs and NOx emissions, coincident with the region of convective transport (see also Fig. S5). In the upper troposphere (300–180 hPa), the negative anomalies in ozone heating rates vary between −0.001 and −0.0045 K day−1. Interestingly, reduced Asian emissions (NMVOCs and NOx), lead to a reduction in ozone, which leads to a reduction in ozone heating rates (−0.001 to −0.003 K day−1) in the region of eddy shedding over western Africa (1–5 July) and the western Pacific (4–8 July). The ozone poor Asian air mass trapped within eddies has reduced the heating over western Africa and the western Pacific. Influence of Asian NOx emissions on ozone heating rates (mean for June–September ∼0.0001–0.0012 K day−1 for 38 % increase over India) in the upper troposphere (300–200 hPa) have been reported in the past (Roy et al., 2017). Near the tropopause ozone heating rates are positive (0.001–0.005 K day−1) except in the region of cross-tropopause transport (marked in Fig. 8i–l). The positive anomalies of ozone heating rates are associated with positive anomalies of ozone near the tropopause. The ECMWF data set for 44 years (1958–2001) shows an interannual amplitude of the ozone heating rate ±0.00025 K day−1 near the tropopause over 30∘ S–30∘ N (Wang et al., 2008).
In this study, we showed evidence of eddy shedding from the ASM anticyclone to both its eastern and western edges, during 1–8 July 2003 based on MIPAS satellite observations and ERA-Interim reanalysis data as well as the associated transport patterns of trace gases from the ASM region to remote regions. The transport diagnostic based on ERA-Interim data shows that eddy shedding events are associated with RWB in the subtropical westerly jet. The RWB feature moves eastward in the subtropical westerly jet. Initially, during 1–5 July 2003, RWB occurs in the western part of the anticyclone and then sheds over western Africa (20–30∘ N, 0–30∘ E). Later, during 5–8 July 2003, RWB moves to the eastern part of the anticyclone and sheds an eddy over the western Pacific (20–30∘ N; 120–150∘ E). Analysis of ERA-Interim PV data for the last two decades (1995–2016) shows that the occurrence frequency of eddy shedding from the ASM anticyclone over western Africa is ∼68 % and ∼25 % over the western Pacific. In the UTLS (300–100 hPa), eddies (PV < 2 PVU) over western Africa and the western Pacific shows the highest correlations with the PV in the anticyclone after accounting for 3–4 days or 5–6 days of lag. This indicates that the anticyclone sheds eddies with a transport duration of typically 3 to 4 days to western Africa and 5–6 days to the western Pacific.
We employed the chemistry climate model ECHAM5-HAMMOZ to investigate the transport of Asian boundary layer trace gases (CO, ozone and PAN) into the monsoon anticyclone and the associated eddies. The model simulations show that Asian trace gases transported into the monsoon anticyclone are further carried away horizontally towards western Africa and the western Pacific by eddies which detach from the anticyclone. These eddies protrude down to ∼200 hPa over western Africa and ∼500 hPa over the western Pacific. They redistribute Asian trace gases downward into the troposphere over these regions. Moreover, part of this air mass is also transported upward into the lower stratosphere. A higher frequency of eddy shedding over western Africa (68 %) during the last two decades (1995–2016) indicates a greater influence of Asian trace gases on the UTLS over western Africa than the western Pacific over this period.
We evaluated the impact of Asian NOx and NMVOCs emissions on ozone and PAN in the regions of the ASM anticyclone and the associated eddies. The model sensitivity simulations for a 10 % reduction in Asian emissions of NMVOCs and NOx indicate significant reduction ( %) in the concentration of PAN in the UTLS (300–80 hPa) over western Africa and the western Pacific. The vertical distribution of anomalies of PAN shows negative values along the transport pathways, i.e. rising from the Asian region (80–120∘ E) into the upper troposphere, and in both westward and eastward transport towards the region of eddy shedding. Tropospheric ozone (1000–180 hPa) shows a decrease of up to −4.5 % in response to a 10 % decrease in Asian emissions of NMVOCs and NOx, while positive ozone anomalies (up to 8 %) are seen near the tropopause. In general, negative ozone anomalies in response to 10% reduction of NOx and NMVOCs in the region of convective transport are seen in Fig. 8i–l. However, positive anomalies of ozone are observed near the tropopause (except in the region of cross-tropopause transport), which may be due to reduction in the efficiency of ozone loss induced by lower concentrations of NOx and OH in the Asia-10 simulations and changes in dynamics due to emission changes, e.g. stratospheric intrusions and lightning. The mixing of tropospheric and stratospheric air masses near the tropopause generates ozone variability. However, such an analysis is beyond the scope of the paper.
Our analysis indicates that transport of Asian trace gases from the anticyclone to western Africa and the western Pacific via eddies causes a change in the chemical composition of the UTLS and may therefore impact the radiative balance of the UTLS. We also estimate that a 10 % reduction in Asian NMVOCs and NOx emissions leads to a decrease in ozone heating rates of 0.001 to 0.004 K day−1 in the region of transport into the troposphere and an increase of 0.001 to 0.005 K day−1 near the tropopause and lower stratosphere (180–50 hPa) over Asia (20–150∘ E; 20–40∘ N). Previous studies showed that ozone changes in the lower stratosphere have the largest impact on the ozone radiative forcing (Riese et al., 2012). Interestingly, in the upper-troposphere (200–300 hPa) negative anomalies of ozone heating rates (∼0.001–0.003 K day−1) are seen in the region of eddy shedding over western Africa and the western Pacific. Thus, transport of Asian air masses via eddies eventually alters the heating rates in the UTLS in the regions of eddy shedding and may thus affect radiative forcing and local temperature. However, such questions are beyond the scope of this study. It should be noted that the distributions of MIPAS concentration fields look different from those of ERA-Interim and ECHAM5-HAMMOZ. These differences may be due to a number of reasons, e.g. different grid sizes of MIPAS, ERA-Interim and model data, binning of MIPAS data for 2 days to accommodate better spatial coverage, uncertainties in the model emission inventory, and retrieval errors in the satellite data. The ozone heating rates estimated from the model simulations will vary accordingly. Notwithstanding, we suggest further scrutiny of long-range transport of Asian trace gases via eddies shedding from the anticyclone and its impact on ozone heating rates in the respective regions.
MIPAS data products were obtained from the password-protected “Access to MIPAS/Envisat data” website (http://share.lsdf.kit.edu/imk/asf/sat/mipas-export/, last access: 9 August 2018) at the Karlsruhe Institute of Technology. ERA-Interim reanalysis data were obtained from the European Centre for Medium-Range Weather Forecasts (ECMWF) from http://apps.ecmwf.int/datasets/data/interim-full-daily/levtype=pl/ (ECMWF, 2018).
The supplement related to this article is available online at: https://doi.org/10.5194/acp-18-11493-2018-supplement.
SF designed the study and wrote the paper, CR, RC and KRK conducted the analysis from ERA-Interim data and model simulations. AR provided the analysis of ozone heating rates; CES conducted the analysis of the MIPAS data. RM contributed to the study design and writing of the paper. RK helped to write and improve the manuscript overall.
The authors declare that they have no conflict of interest.
Suvarna Fadnavis and Chaitri Roy acknowledge Ravi Nanjundiah, Director of IITM, with gratitude for his encouragement during the course of this
study. We are grateful to Bärbel Vogel for helpful discussions. This work was
partly funded by the European Community's Seventh Framework Programme
(FP7/2007–2013) as part of the StratoClim project (grant agreement no.
603557). We thank the European Centre for Medium-Range Weather Forecasts
(ECMWF) for providing meteorological data sets. The authors are also thankful
to Bernd Funke, Michael Kiefer and Gabriele Stiller, Karlsruhe
Institute of Technology, Germany, for providing MIPAS data and for helpful
discussions. We thank the anonymous reviewers for their valuable suggestions.
Edited by: Martin Dameris
Reviewed by: three anonymous referees
Bourassa, A. E., Robock, A., Randel, W. J., Deshler, T., Rieger, L. A., Lloyd, N. D., Llewellyn, E. J., and Degenstein, D. A.: Large volcanic aerosol load in the stratosphere linked to Asian monsoon transport, Science, 336, 78–81, https://doi.org/10.1126/science.1219371, 2012.
Edwards, J. M. and Slingo, A.: Studies with a flexible new radiation code. I: Choosing a configuration for a large-scale model, Q. J. Roy. Meteor. Soc., 122, 689–719, https://doi.org/10.1256/smsqj.53106, 1996.
European Centre for Medium-Range Weather Forecasts (ECMWF): ECMWF, ERA Interim, Daily, available at: http://apps.ecmwf.int/datasets/data/interim-full-daily/levtype=pl/, last access: 9 August 2018.
Fadnavis, S. and Chattopadhyay, R.: Linkages of subtropical stratospheric intraseasonal intrusions with Indian summer monsoon deficit rainfall, J. Climate, 30, 5083–5095, https://doi.org/10.1175/JCLI-D-16-0463.1, 2017.
Fadnavis, S., Semeniuk, K., Pozzoli, L., Schultz, M. G., Ghude, S. D., Das, S., and Kakatkar, R.: Transport of aerosols into the UTLS and their impact on the Asian monsoon region as seen in a global model simulation, Atmos. Chem. Phys., 13, 8771–8786, https://doi.org/10.5194/acp-13-8771-2013, 2013.
Fadnavis, S., Schultz, M. G., Semeniuk, K., Mahajan, A. S., Pozzoli, L., Sonbawne, S., Ghude, S. D., Kiefer, M., and Eckert, E.: Trends in peroxyacetyl nitrate (PAN) in the upper troposphere and lower stratosphere over southern Asia during the summer monsoon season: regional impacts, Atmos. Chem. Phys., 14, 12725–12743, https://doi.org/10.5194/acp-14-12725-2014, 2014.
Fadnavis, S., Semeniuk, K., Schultz, M. G., Kiefer, M., Mahajan, A., Pozzoli, L., and Sonbawane, S.: Transport pathways of peroxyacetyl nitrate in the upper troposphere and lower stratosphere from different monsoon systems during the summer monsoon season, Atmos. Chem. Phys., 15, 11477–11499, https://doi.org/10.5194/acp-15-11477-2015, 2015.
Fischer, H., Birk, M., Blom, C., Carli, B., Carlotti, M., von Clarmann, T., Delbouille, L., Dudhia, A., Ehhalt, D., Endemann, M., Flaud, J. M., Gessner, R., Kleinert, A., Koopman, R., Langen, J., López-Puertas, M., Mosner, P., Nett, H., Oelhaf, H., Perron, G., Remedios, J., Ridolfi, M., Stiller, G., and Zander, R.: MIPAS: an instrument for atmospheric and climate research, Atmos. Chem. Phys., 8, 2151–2188, https://doi.org/10.5194/acp-8-2151-2008, 2008.
Funke, B., López-Puertas, M., García-Comas, M., Stiller, G. P., von Clarmann, T., Höpfner, M., Glatthor, N., Grabowski, U., Kellmann, S., and Linden, A.: Carbon monoxide distributions from the upper troposphere to the mesosphere inferred from 4.7 µm non-local thermal equilibrium emissions measured by MIPAS on Envisat, Atmos. Chem. Phys., 9, 2387–2411, https://doi.org/10.5194/acp-9-2387-2009, 2009.
Garny, H. and Randel, W. J.: Transport pathways from the Asian monsoon anticyclone to the stratosphere, Atmos. Chem. Phys., 16, 2703–2718, https://doi.org/10.5194/acp-16-2703-2016, 2016.
Ghude, S. D., Kulkarni, S. H., Jena, C., Pfister, G. G., Beig, G., Fadnavis, S., and van Der, R. J.: Application of satellite observations for identifying regions of dominant sources of nitrogen oxides over the indian subcontinent, J. Geophys. Res.-Atmos., 118, 1075–1089, https://doi.org/10.1029/2012JD017811, 2013.
Gilford, D. M. and Solomon, S.: Radiative effects of stratospheric seasonal cycles in the tropical upper troposphere and lower stratosphere, J. Climate, 30, 2769–2783, https://doi.org/10.1175/JCLI-D-16-0633.1, 2017.
Glatthor, N., von Clarmann, T., Fischer, H., Funke, B., Grabowski, U., Höpfner, M., Kellmann, S., Kiefer, M., Linden, A., Milz, M., Steck, T., and Stiller, G. P.: Global peroxyacetyl nitrate (PAN) retrieval in the upper troposphere from limb emission spectra of the Michelson Interferometer for Passive Atmospheric Sounding (MIPAS), Atmos. Chem. Phys., 7, 2775-2787, https://doi.org/10.5194/acp-7-2775-2007, 2007.
Horowitz, L. W., Walters, S., Mauzerall, D. L., Emmons, L. K., Rasch, P. J., Granier, C., Tie, X., Lamarque, J.-F., Schultz, M. G., Tyndall, G. S., Orlando, J. J., and Brasseur, G. P.: A global simulation of tropospheric ozone and related tracers: Description and evaluation of MOZART, version 2, J. Geophys. Res.-Atmos., 108, 4784, https://doi.org/10.1029/2002JD002853, 2003.
Hsu, C. J. and Plumb, R. A.: Nonaxisymmetric thermally driven circulations and upper-tropospheric monsoon dynamics, J. Atmos. Sci., 57, 1255–1276, https://doi.org/10.1175/1520-0469(2000)057<1255:NTDCAU>2.0.CO;2, 2000.
Li, M., Zhang, Q., Streets, D. G., He, K. B., Cheng, Y. F., Emmons, L. K., Huo, H., Kang, S. C., Lu, Z., Shao, M., Su, H., Yu, X., and Zhang, Y.: Mapping Asian anthropogenic emissions of non-methane volatile organic compounds to multiple chemical mechanisms, Atmos. Chem. Phys., 14, 5617–5638, https://doi.org/10.5194/acp-14-5617-2014, 2014.
Liang, Q., Jaeglé, L., Jaffe, D. A., Weiss-Penzias, P., Heckman, A., and Snow, J. A.: Long-range transport of Asian pollution to the northeast Pacific: Seasonal variations and transport pathways of carbon monoxide, J. Geophys. Res.-Atmos., 109, 1–16, https://doi.org/10.1029/2003JD004402, 2004.
Naik, V., Mauzerall, D., Horowitz, L., Schwarzkopf, M. D., Ramaswamy, V., and Oppenheimer, M.: Net radiative forcing due to changes in regional emissions of tropospheric ozone precursors, J. Geophys. Res., 110, D24306, https://doi.org/10.1029/2005JD00590, 2005.
Nützel, M., Dameris, M., and Garny, H.: Movement, drivers and bimodality of the South Asian High, Atmos. Chem. Phys., 16, 14755–14774, https://doi.org/10.5194/acp-16-14755-2016, 2016.
Ohara, T., Akimoto, H., Kurokawa, J., Horii, N., Yamaji, K., Yan, X., and Hayasaka, T.: An Asian emission inventory of anthropogenic emission sources for the period 1980–2020, Atmos. Chem. Phys., 7, 4419–4444, https://doi.org/10.5194/acp-7-4419-2007, 2007.
Park, M., Randel, W. J., Emmons, L. K., Bernath, P. F., Walker, K. A., and Boone, C. D.: Chemical isolation in the Asian monsoon anticyclone observed in Atmospheric Chemistry Experiment (ACE-FTS) data, Atmos. Chem. Phys., 8, 757–764, https://doi.org/10.5194/acp-8-757-2008, 2008.
Payne, V. H., Fischer, E. V., Worden, J. R., Jiang, Z., Zhu, L., Kurosu, T. P., and Kulawik, S. S.: Spatial variability in tropospheric peroxyacetyl nitrate in the tropics from infrared satellite observations in 2005 and 2006, Atmos. Chem. Phys., 17, 6341–6351, https://doi.org/10.5194/acp-17-6341-2017, 2017.
Ploeger, F., Gottschling, C., Griessbach, S., Grooß, J.-U., Guenther, G., Konopka, P., Müller, R., Riese, M., Stroh, F., Tao, M., Ungermann, J., Vogel, B., and von Hobe, M.: A potential vorticity-based determination of the transport barrier in the Asian summer monsoon anticyclone, Atmos. Chem. Phys., 15, 13145–13159, https://doi.org/10.5194/acp-15-13145-2015, 2015.
Ploeger, F., Konopka, P., Walker, K., and Riese, M.: Quantifying pollution transport from the Asian monsoon anticyclone into the lower stratosphere, Atmos. Chem. Phys., 17, 7055–7066, https://doi.org/10.5194/acp-17-7055-2017, 2017.
Popovic, J. M. and Plumb, R. A.: Eddy Shedding from the Upper-Tropospheric Asian Monsoon Anticyclone, J. Atmos. Sci., 58, 93–104, https://doi.org/10.1175/1520-0469(2001)058<0093:ESFTUT>2.0.CO;2, 2001.
Pozzoli, L., Janssens-Maenhout, G., Diehl, T., Bey, I., Schultz, M. G., Feichter, J., Vignati, E., and Dentener, F.: Re-analysis of tropospheric sulfate aerosol and ozone for the period 1980–2005 using the aerosol-chemistry-climate model ECHAM5-HAMMOZ, Atmos. Chem. Phys., 11, 9563–9594, https://doi.org/10.5194/acp-11-9563-2011, 2011.
Randel, W. J., Park, M., Emmons, L., Kinnison, D., Bernath, P., Walker, K. A., Boone, C., and Pumphrey, H.: Asian monsoon transport of trace gases to the stratosphere, Science, 328, 611–613, 10.1126/science.1182274, 2010.
Rap, A., Richards, N. A. D., Forster, P. M., Monks, S., Arnold, S. R., and Chipperfield, M.: Satellite constraint on the tropospheric ozone radiative effect, Geophys. Res. Lett., 42, 5074–5081, https://doi.org/10.1002/2015GL064037, 2015.
Riese, M., Ploeger, F., Rap, A., Vogel, B., Konopka, P., Dameris, M., and Forster, P.: Impact of uncertainties in atmospheric mixing on simulated UTLS composition and related radiative effects, J. Geophys. Res., 117, D16305, https://doi.org/10.1029/2012JD017751, 2012.
Roeckner, E., Bauml, G., Bonaventura, L., Brokopf, R., Esch, M., Giorgetta, M., Hagemann, S., Kirchner, I., Kornblueh, L., Manzini, E., Rhodin, A., Schlese, U., Schulzweida, U., and Tompkins, A.: The atmospheric general circulation model ECHAM5: Part 1, Tech. Rep. 349, Max Planck Institute for Meteorology, Hamburg, 2003.
Roy, C., Fadnavis, S., Müller, R., Ayantika, D. C., Ploeger, F., and Rap, A.: Influence of enhanced Asian NOx emissions on ozone in the upper troposphere and lower stratosphere in chemistry-climate model simulations, Atmos. Chem. Phys., 17, 1297–1311, https://doi.org/10.5194/acp-17-1297-2017, 2017.
Santee, M. L., Manney, G. L., Livesey, N. J., Schwartz, M. J., Neu, J. L., and Read, W. G.: A comprehensive overview of the climatological composition of the Asian summer monsoon anticyclone based on 10 years of Aura Microwave Limb Sounder measurements, J. Geophys. Res.-Atmos., 122, 5491–5514, https://doi.org/10.1002/2016JD026408, 2017.
Schneider, P. and van Der A, R. J.: A global single-sensor analysis of 2002–2011 tropospheric nitrogen dioxide trends observed from space, J. Geophys. Res.-Atmos., 117, 1–17, https://doi.org/10.1029/2012JD017571, 2012.
Stier, P., Feichter, J., Kinne, S., Kloster, S., Vignati, E., Wilson, J., Ganzeveld, L., Tegen, I., Werner, M., Balkanski, Y., Schulz, M., Boucher, O., Minikin, A., and Petzold, A.: The aerosol-climate model ECHAM5-HAM, Atmos. Chem. Phys., 5, 1125–1156, https://doi.org/10.5194/acp-5-1125-2005, 2005.
Streets, D. G., Yarber, K. F., Woo, J.-H., and Carmichael, G. R.: Biomass burning in Asia: Annual and seasonal estimates and atmospheric emissions, Global Biogeochem. Cy., 17, 1099, https://doi.org/10.1029/2003GB002040, 2003.
Strode, S. A. and Pawson, S.: Detection of carbon monoxide trends in the presence of interannual variability, J. Geophys. Res.-Atmos., 118, 12257–12273, https://doi.org/10.1002/2013JD020258, 2013.
Strong, C. and Magnusdottir, G.: Tropospheric Rossby wave breaking and the NAO/NAM, J. Atmos. Sci., 65, 2861–2876, https://doi.org/10.1175/2008JAS2632.1, 2008.
Tereszchuk, K. A., Moore, D. P., Harrison, J. J., Boone, C. D., Park, M., Remedios, J. J., Randel, W. J., and Bernath, P. F.: Observations of peroxyacetyl nitrate (PAN) in the upper troposphere by the Atmospheric Chemistry Experiment-Fourier Transform Spectrometer (ACE-FTS), Atmos. Chem. Phys., 13, 5601–5613, https://doi.org/10.5194/acp-13-5601-2013, 2013.
Tie, X., Zhang, R., Brasseur, G., and Lei, W.: Global NOx Production by Lightning, J. Atmos. Chem., 43, 61–74, https://doi.org/10.1023/A:1016145719608, 2002.
Ungermann, J., Ern, M., Kaufmann, M., Müller, R., Spang, R., Ploeger, F., Vogel, B., and Riese, M.: Observations of PAN and its confinement in the Asian summer monsoon anticyclone in high spatial resolution, Atmos. Chem. Phys., 16, 8389–8403, https://doi.org/10.5194/acp-16-8389-2016, 2016.
Uppala, S. M., Kållberg, P. W., Simmons, A. J., Andrae, U., da Costa Bechtold, V., Fiorino, M., Gibson, J. K., Haseler, J., Hernandez, A., Kelly, G. A., Li, X., Onogi, K., Saarinen, S., Sokka, N., Allan, R. P., Andersson, E., Arpe, K., Balmaseda, M. A., Beljaars, A. C. M., van de Berg, L., Bidlot, J., Bormann, N., Caires, S., Chevallier, F., Dethof, A., Dragosavac, M., Fisher, M., Fuentes, M., Hagemann, S., Hólm, E., Hoskins, B. J., Isaksen, L., Janssen, P. A. E. M., Jenne, R., McNally, A. P., Mahfouf, J. F., Morcrette, J. J., Rayner, N. A., Saunders, R. W., Simon, P., Sterl, A., Trenberth, K. E., Untch, A., Vasiljevic, D., Viterbo, P., and Woollen, J.: The ERA-40 re-analysis, Q. J. Roy. Meteor. Soc., 131, 2961–3012, https://doi.org/10.1256/qj.04.176, 2005.
van der Werf, G. R., Randerson, J. T., Giglio, L., Collatz, G. J., Kasibhatla, P. S., and Arellano Jr., A. F.: Interannual variability in global biomass burning emissions from 1997 to 2004, Atmos. Chem. Phys., 6, 3423–3441, https://doi.org/10.5194/acp-6-3423-2006, 2006.
Verstraeten, W. W., Neu, J. L., Williams, J. E., Bowman, K. W., Worden, J. R., and Boersma, K. F.: Rapid increases in tropospheric ozone production and export from China, Nat. Geosci., 8, 690–695, https://doi.org/10.1038/ngeo2493, 2015.
Vogel, B., Günther, G., Müller, R., Grooß, J.-U., Hoor, P., Krämer, M., Müller, S., Zahn, A., and Riese, M.: Fast transport from Southeast Asia boundary layer sources to northern Europe: rapid uplift in typhoons and eastward eddy shedding of the Asian monsoon anticyclone, Atmos. Chem. Phys., 14, 12745–12762, https://doi.org/10.5194/acp-14-12745-2014, 2014.
Vogel, B., Günther, G., Müller, R., Grooß, J.-U., Afchine, A., Bozem, H., Hoor, P., Krämer, M., Müller, S., Riese, M., Rolf, C., Spelten, N., Stiller, G. P., Ungermann, J., and Zahn, A.: Long-range transport pathways of tropospheric source gases originating in Asia into the northern lower stratosphere during the Asian monsoon season 2012, Atmos. Chem. Phys., 16, 15301–15325, https://doi.org/10.5194/acp-16-15301-2016, 2016.
Vogel, B., Müller, R., Günther, G., Spang, R., Hanumanthu, S., Li, D., Riese, M., and Stiller, G. P.: Lagrangian simulations of the transport of young air masses to the top of the Asian monsoon anticyclone and into the tropical pipe, Atmos. Chem. Phys. Discuss., https://doi.org/10.5194/acp-2018-724, in review, 2018.
von Clarmann, T., De Clercq, C., Ridolfi, M., Höpfner, M., and Lambert, J.-C.: The horizontal resolution of MIPAS, Atmos. Meas. Tech., 2, 47–54, https://doi.org/10.5194/amt-2-47-2009, 2009.
Wang, W.-G., Yuan, M., Wang, H.-Y., Sun, J.-H., Xie, Y.-Q., Fan, W.-X., and Chen, X.-M.: A Study of Ozone Amount in the Transition Layer Between Troposphere and Stratosphere and Its Heating Rate, Chinese J. Geophys.-Ch., 51, 916–930, https://doi.org/10.1002/cjg2.1287, 2008.
Wayne, R. P.: Chemistry of atmospheres, 3rd Edn., Oxford science publications, Clarendon Press, Oxford, 337 pp., ISBN: 0 19 850375X, 2000.
Zhang, Q., Wu, G., and Qian, Y.: The Bimodality of the 100 hPa South Asia High and its Relationship to the Climate Anomaly over East Asia in summer, J. Meteorol. Soc. Jpn., 80, 733–744, https://doi.org/10.2151/jmsj.80.733, 2002.
Zhao, C., Wang, Y., Choi, Y., and Zeng, T.: Summertime impact of convective transport and lightning NOx production over North America: modeling dependence on meteorological simulations, Atmos. Chem. Phys., 9, 4315–4327, https://doi.org/10.5194/acp-9-4315-2009, 2009.