the Creative Commons Attribution 4.0 License.
the Creative Commons Attribution 4.0 License.
 | 15 Aug 2018
Foreign and domestic contributions to springtime ozone over China
Ruijing Ni
Yingying Yan
Weili Lin
China is facing a severe ozone problem, but the origin of its ozone remains unclear. Here we use a GEOS-Chem based global–regional two-way coupled model system to quantify the individual contributions of eight emission source regions worldwide to springtime ozone in 2008 over China. The model reproduces the observed ozone from 31 ground sites and various aircraft and ozonesonde measurements in China and nearby countries, with a mean bias of 10 %–15 % both near the surface and in the troposphere. We then combine zero-out simulations, tagged ozone simulations, and a linear weighting approach to account for the effect of nonlinear chemistry on ozone source attribution. We find considerable contributions of total foreign anthropogenic emissions to surface ozone over China (2–11 ppb). For ozone of anthropogenic origin averaged over China, foreign regions together contribute 40 %–60 % below the height of 2 km and 85 % in the upper troposphere. For total ozone contributed by foreign anthropogenic emissions over China at various heights, the portion of transboundary ozone produced within foreign emission source regions is less than 50 %, with the rest produced by precursors transported out of those source regions. Japan and Korea contribute 0.6–2.1 ppb of surface ozone over the east coastal regions. Southeast Asia contributes 1–5 ppb over much of southern China and South Asia contributes up to 5–10 ppb of surface ozone over the border of southwestern China; and their contributions increase with height due to strong upwelling over the source regions. The European contribution reaches 2.1–3.0 ppb for surface ozone over the northern border of China and 1.5 ppb in the lower troposphere averaged over China. North America contributes 0.9–2.7 ppb of surface ozone over most of China (1.5–2.1 ppb over the North China Plain), with a China average at 1.5–2.5 ppb at different heights below 8 km, due to its large anthropogenic emissions and the transport-favorable midlatitude westerly wind. In addition to domestic emission control, global emission reduction is critical for China's ozone mitigation.


Ozone is an important atmospheric oxidant and the primary source of the hydroxyl radical (OH). At the surface, ozone also damages human health and reduces crop yield. China is currently facing a severe ozone pollution problem, with measured maximum hourly ozone exceeding 200 ppb in many cities (Wang et al., 2006; Xue et al., 2014). Even in the remote areas of western China, measured daily mean concentrations of ozone frequently exceed 50 ppb (Xue et al., 2011; Lin et al., 2015). Xu et al. (2016) showed that daytime ozone at Waliguan, a global background station, grew significantly from 1994 to 2013 at a rate of 0.24±0.16 ppb yr−1. The severe ozone problem is largely associated with growth in anthropogenic emissions of nitrogen oxides (NOx) and non-methane volatile organic compounds (NMVOCs). Chinese anthropogenic NOx emissions increased at a rate of 7.9 % yr−1 from 2000 to 2010 (Zhao et al., 2013), and Chinese anthropogenic NMVOC emissions increased from 22.45 Tg in 2008 to 29.85 Tg in 2012 (Wu et al., 2016).
Ozone has a lifetime of several days to weeks in the troposphere (Young et al., 2013; Yan et al., 2016), which makes its long-distance transport across regions and even continents possible. Many observational and modeling studies have showed substantial trans-Pacific and trans-Atlantic transport of ozone and precursors (Jacob et al., 1999; Derwent et al., 2004; Lin et al., 2008; Cooper et al., 2010; Verstraeten et al., 2016). The trans-Pacific transport of East Asian air pollutants enhances springtime surface ozone concentrations over the western United States by 1–5 ppb (Zhang et al., 2008; Brown-Steiner and Hess, 2011; M. Lin et al., 2012). Auvray and Bey (2005) reported that North American and Asian ozone account for 10.9 % and 7.7 % of ozone over Europe, respectively. The Hemispheric Transport of Air Pollution (HTAP) project studied the transcontinental pollution using model sensitivity simulations applying a 20 % perturbation in anthropogenic emissions in four regions (North America, Europe, South Asia, and East Asia, each defined as a broad rectangle-shaped area) (HTAP, 2010). HTAP showed that the annual average impact of North American emissions on East Asian surface ozone is comparable to the impact of East Asian emissions on North America (0.22 ppb averaged over each rectangular region).
Several studies investigated the influence of transboundary transport on surface ozone over Chinese territory (Wang et al., 2011; Li et al., 2014; J. Li et al., 2016; Zhu et al., 2016; Yin et al., 2017). Wang et al. (2011) used tagged ozone simulations with GEOS-Chem to study the global production of surface ozone over China for 2006. They showed that in spring 2006, tropospheric ozone produced over India contributed up to 6 ppb to surface ozone over western China and that ozone produced over Europe and North America each contributed 2–5 ppb of ozone over northeastern China and North China. Using an emission zero-out method with MOZART simulations (i.e., without versus with emissions), Li et al. (2014) reported that modeled trans-Eurasian ozone transport enhanced surface ozone over northwestern China by 2–6 ppb in spring 2000. Using tagged ozone simulations with MOZART, Zhu et al. (2016) revealed significant springtime ozone transport (∼6 ppb) from Europe and Africa to Waliguan averaged from 1997 to 2007 and 3–5 ppb ozone from North and South America together. Using a tagged ozone method based on the nested air quality prediction modeling system (NAQPMS), J. Li et al. (2016) found 0.5–3.0 ppb of ozone over northeastern China produced over the Korean peninsula in 2010. Based on observational and back-trajectory analyses, Yin et al. (2017) found that ozone at the Namco site over Tibet in spring is greatly affected by anthropogenic contributions from South Asia.
Transboundary ozone due to precursor emissions of a source region can be produced both within and outside the source region. The two mechanisms contribute roughly equally for the case of trans-Pacific ozone from East Asia to the western United States (Zhang et al., 2008; Jiang et al., 2016). And the ozone production along the transport pathway is largely associated with thermal dissociation of peroxyacetyl nitrate (PAN) that has been formed in the boundary layer of the NOx emission source region. The transport of ozone precursors means that ozone produced within a region (from emitted and transported precursors worldwide) differs from ozone produced from that region's emissions. This difference affects how ozone over a receptor region is attributed to other regions (Wang et al., 2011; Li et al., 2014). It is thus important that the contribution of ozone produced at a “producing region” from emissions of a source region be quantified explicitly.
Here we simulate the contributions of anthropogenic emissions in individual regions across the globe to ozone at various heights over China. As typically assumed, anthropogenic contributions are associated with anthropogenic NOx, carbon monoxide (CO), and NMVOC emissions, excluding the effect of methane. We use a GEOS-Chem based two-way coupled modeling system (Yan et al., 2014, 2016) that integrates an Asian nested model and a global model in a two-way exchange, which better simulates multi-scale interactions between the nested and global domains. Our study is focused on spring 2008, for which a comprehensive set of ground, aircraft, and ozonesonde measurements over China is available for model evaluation. Also, transboundary transport of ozone is most significant in spring due to active cyclonic activities and strong westerly winds (Liang et al., 2004; HTAP, 2010; Wang et al., 2011).
We explicitly identify ozone produced in 10 individual regions of the world from anthropogenic precursor emissions in each of eight source regions. These 10 producing regions include the troposphere of the eight emitters, the troposphere of total oceanic regions, and the stratosphere. For this purpose, we combine the emission zero-out method and the tagged ozone approach (Wang et al., 1998). The zero-out or similar emission perturbation methods are widely used to quantify the contribution of emissions in a source region to a receptor region as a combined result of the two production–transport mechanisms mentioned before (Lin et al., 2008; HTAP, 2010; Li et al., 2014; Lin et al., 2014). The tagged ozone approach quantifies the ozone produced in any designated region with no information about whether the associated precursors are emitted in that region or are transported from somewhere else (Wang et al., 1998; Wang et al., 2011; J. Li et al., 2016). To account for ozone production nonlinearity, we use a simple linear weighting method to adjust simulation results, similar to that of B. G. Li et al. (2016).
The rest of our paper is organized as follows. Section 2 presents model simulations, measurement data, and the ozone source attribution method. Section 3 evaluates the modeled ozone and CO using ground, aircraft, and ozonesonde observations. Section 4 analyzes the modeled contributions to near-surface ozone over China by natural sources as well as anthropogenic emissions in individual regions. Section 5 shows the ozone source attribution at different heights of the troposphere. For each emission source region, it also separates the contribution of ozone produced within that source region from the contribution produced outside of that source region. Section 6 concludes the study.
2.1 Two-way coupled GEOS-Chem modeling system
The two-way coupled system (Yan et al., 2014; Yan et al., 2016) is built upon version 9-02 of GEOS-Chem (http://wiki.seas.harvard.edu/geos-chem/index.php/Main_Page, last access: 4 April 2017). Here we couple the global GEOS-Chem model (at 2.5∘ longitude × 2∘ latitude) with its nested model covering Asia (70∘ E–150∘ E, 11∘ S–55∘ N, at 0.667∘ longitude × 0.5∘ latitude). Through the PeKing University CouPLer (PKUCPL) for two-way coupling, for every 3 h the global model provides lateral boundary conditions for the nested model, while the nested model results replace the global model results within the nested domain (Yan et al., 2014, 2016). Both models are driven by the GEOS-5 assimilated meteorological fields at their respective horizontal resolutions from the NASA Global Modeling and Assimilation Office. There are 47 vertical layers for both models, and the lowest 10 layers are about 130 m thick each.
Both the global and nested GEOS-Chem models include the full gaseous HOx–Ox–NOx–CO–NMVOC chemistry (Mao et al., 2013) and online aerosol calculations, with further updates detailed in J.-T. Lin et al. (2012) and Yan et al. (2016). As aromatics are not explicitly represented in the model, following J. T.Lin et al. (2012), we approximate the ozone production of aromatics by increasing anthropogenic emissions of propene by a factor of 4, based on their reactivity differences, their similarity in emission spatial variability, and recently estimated emission amounts of aromatics (Liu et al., 2010). We use the Linoz scheme for ozone production in the stratosphere (McLinden et al., 2000). We adjust the stratospheric production rate in the nested model to ensure that the stratosphere–troposphere exchange (STE) of ozone in the nested model matches the STE in the global model over the same nested domain (Yan et al., 2016). Vertical mixing in the planetary boundary layer (PBL) is parameterized by a nonlocal scheme (Holtslag and Boville, 1993; Lin and McElroy, 2010), and convection in the model employs the relaxed Arakawa–Schubert scheme (Moorthi and Suarez, 1992).
Table 1Emissions used in the model.
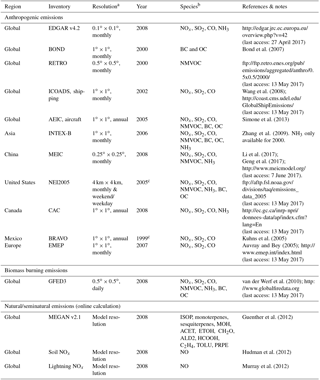
a Before re-gridded to model horizontal resolutions. For more information,
see
http://wiki.seas.harvard.edu/geos-chem/index.php/Anthropogenic_emissions.
b Notes for NMVOC: RETRO includes PRPE, C3H8, ALK4, ALD2, CH2O, and methyl ethyl ketone (MEK); in
the chemical transport model (CTM), MEK emissions are further allocated to MEK (25 %) and ACET
(75 %). AEIC, INTEX-B, and MEIC include PRPE, C2H6, C3H8, ALK4, ALD2, CH2O,
MEK, and ACET. NEI05 includes PRPE, C3H8, ALK4, CH2O, MEK, and ACET. EMEP
includes PRPE, ALK4, ALD2, and MEK. Emissions of C2H6 outside Asia are from
Xiao et al. (2008).
c Over the United States and Mexico, emissions of CO and NOx are scaled to
2008 and 2006, respectively;
(http://wiki.seas.harvard.edu/geos-chem/index.php/Scale_factors_for_anthropogenic_emissions).
Table 1 lists the emission inventories used here. Global anthropogenic emissions of NOx and CO in 2008 are from the Emission Database for Global Atmospheric Research (EDGAR v4.2). Anthropogenic NMVOC emissions are from the REanalysis of TROpospheric chemical composition (RETRO) inventory for 2000. Anthropogenic emissions over China, the rest of Asia, the United States, Canada, Mexico, and Europe are replaced by regional inventories MEIC (for 2008), INTEX-B (for 2006), NEI2005 (for 2005), CAC (for 2008), BRAVO (for 1999), and EMEP (for 2007), respectively. Emissions of CO and NOx are scaled to 2008 in the United States and to 2006 in Mexico (http://wiki.seas.harvard.edu/geos-chem/index.php/Scale_factors_for_anthropogenic_emissions, last access: 27 April 2017). We use daily biomass burning emissions from Global Fire Emission Database version 3 (GFED3) (van der Werf et al., 2010). Biogenic emissions of NMVOCs are calculated online based on the MEGAN v2.1 scheme (Guenther et al., 2012). For lightning NOx emissions, flash rates are calculated based on the cloud-top height and constrained by climatological satellite observations (Murray et al., 2012), and the vertical profile of emitted NOx follows Ott et al. (2010). Online calculation of soil NOx emissions follows Hudman et al. (2012).
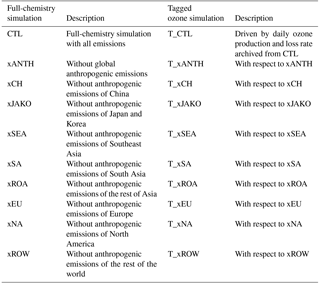
2.2 Zero-out simulations, tagged ozone simulations, and weighted adjustment
Table 2 presents 10 full-chemistry simulations to quantify Chinese and foreign anthropogenic contributions to springtime ozone over China in 2008. A base simulation (CTL) includes all emissions. The second simulation excludes anthropogenic NOx, CO, and NMVOC emissions worldwide to determine the natural ozone (xANTH). Eight additional simulations exclude anthropogenic emissions over China (xCH), Japan and Korea (xJAKO), Southeast Asia (xSEA), South Asia (xSA), the rest of Asia (xROA), Europe (xEU), North America (xNA), and the rest of the world (xROW), respectively (see regional definitions in Fig. 1). All simulations cover November 2007 through May 2008, with the first 4 months used for spin-up, except for additional CTL simulations in other years for model evaluation purposes.
Table 2 also shows 10 tagged simulations (denoted as T_CTL, T_xANTH, etc.) with respect to CTL and the other eight zero-out sensitivity simulations. Each tagged simulation includes 10 tracers to track ozone produced within the troposphere of eight source regions, produced within the troposphere of the oceanic regions, or transported from the stratosphere. Considering the time for STE of air, all tagged ozone simulations are spun up for 10 years.

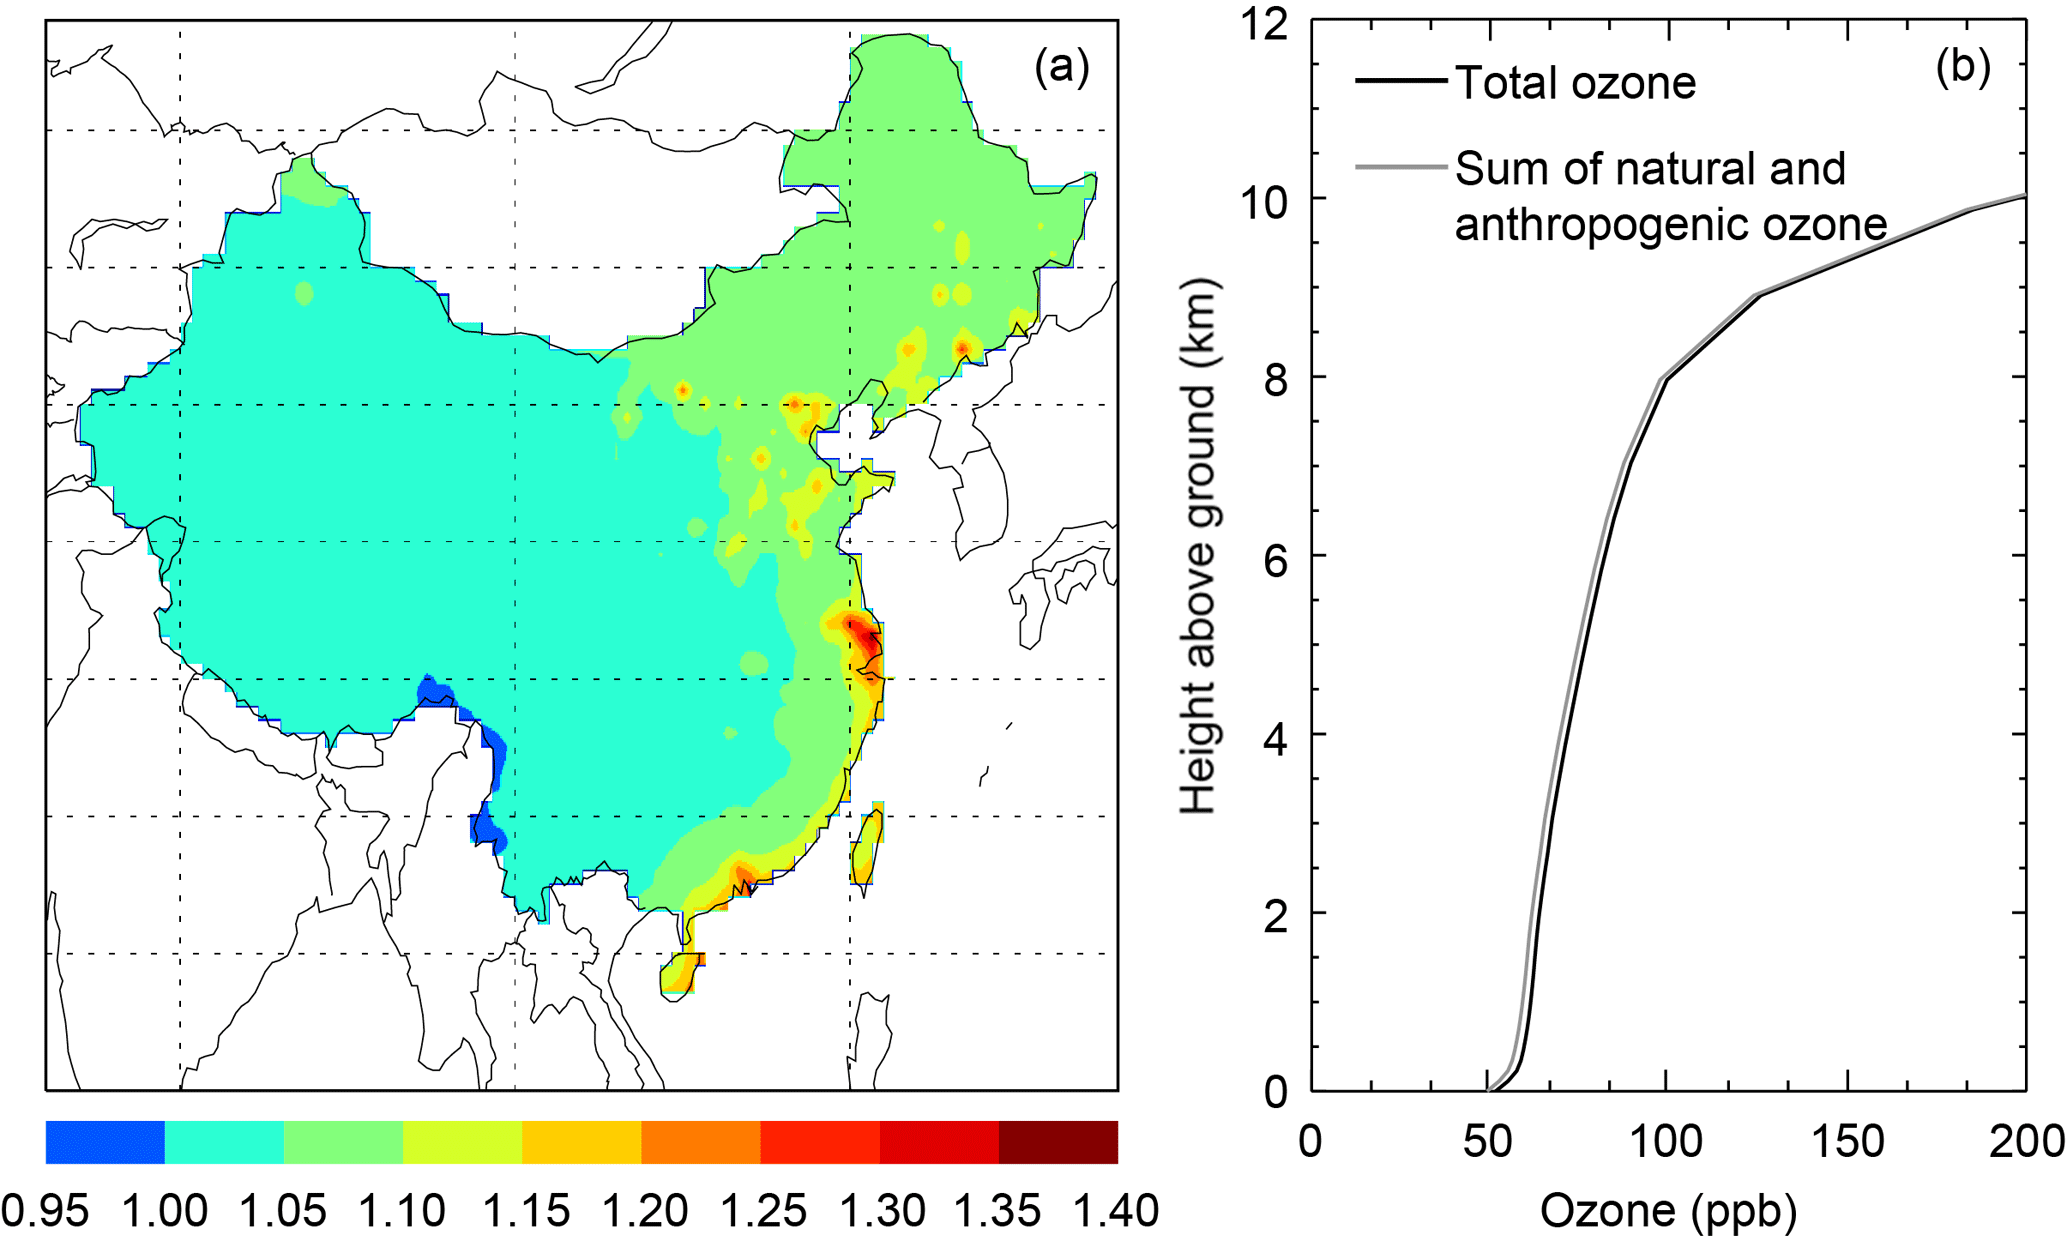
Figure 2(a) Spatial distribution of the ratio of total surface ozone in CTL to the pre-linear-weighting-adjustment sum of natural ozone, domestic anthropogenic ozone, and foreign anthropogenic ozone. (b) Vertical profile of China average total ozone from CTL and the profile of the pre-linear-weighting-adjustment sum of natural ozone, domestic anthropogenic ozone, and foreign anthropogenic ozone.
Ozone production is nonlinearly dependent on its precursors, adding uncertainties to the source attribution calculated by emission perturbation methods (Wu et al., 2009). To account for this issue, we use a linear weighting method to adjust all ozone attribution results, unless stated otherwise. Below is an example to determine the contribution from Chinese anthropogenic emissions (here Ci represents the sensitivity simulation for one of the eight emission source regions). The adjustment is performed for each grid cell over China. Equation (1) calculates the fractional Chinese contribution (α) to the sum of ozone from individual anthropogenic source regions and from natural sources; the simulations involved are all full-chemistry runs (CTL, xCH, xEU, … , xANTH). Equation (2) applies the fractional contribution α to the total ozone in CTL to obtain the final adjusted Chinese contribution.
Figure 2a shows the spatial distribution of the ratio of total surface ozone in CTL to the pre-linear-weighting-adjustment sum of natural ozone, domestic anthropogenic ozone, and foreign anthropogenic ozone. The ratio is close to unity over central and western China. Over most of the eastern regions, the ratio is between 1.05 and 1.10, although it can reach 1.30 at a few locations. Figure 2b further compares the vertical profile of China average total ozone in CTL and the profile of the pre-linear-weighting-adjustment sum of natural ozone, domestic anthropogenic ozone, and foreign anthropogenic ozone. The difference between the two profiles is rather small. These results suggest relative small effects of chemical nonlinearity. And the linear weighting adjustment further removes these effects.
A similar approach was used by B. G. Li et al. (2016) to estimate the contribution of China to global radiative forcing, although in their study 20 % (instead of 100 %) of emissions over individual emission source regions are removed in the sensitivity simulations.
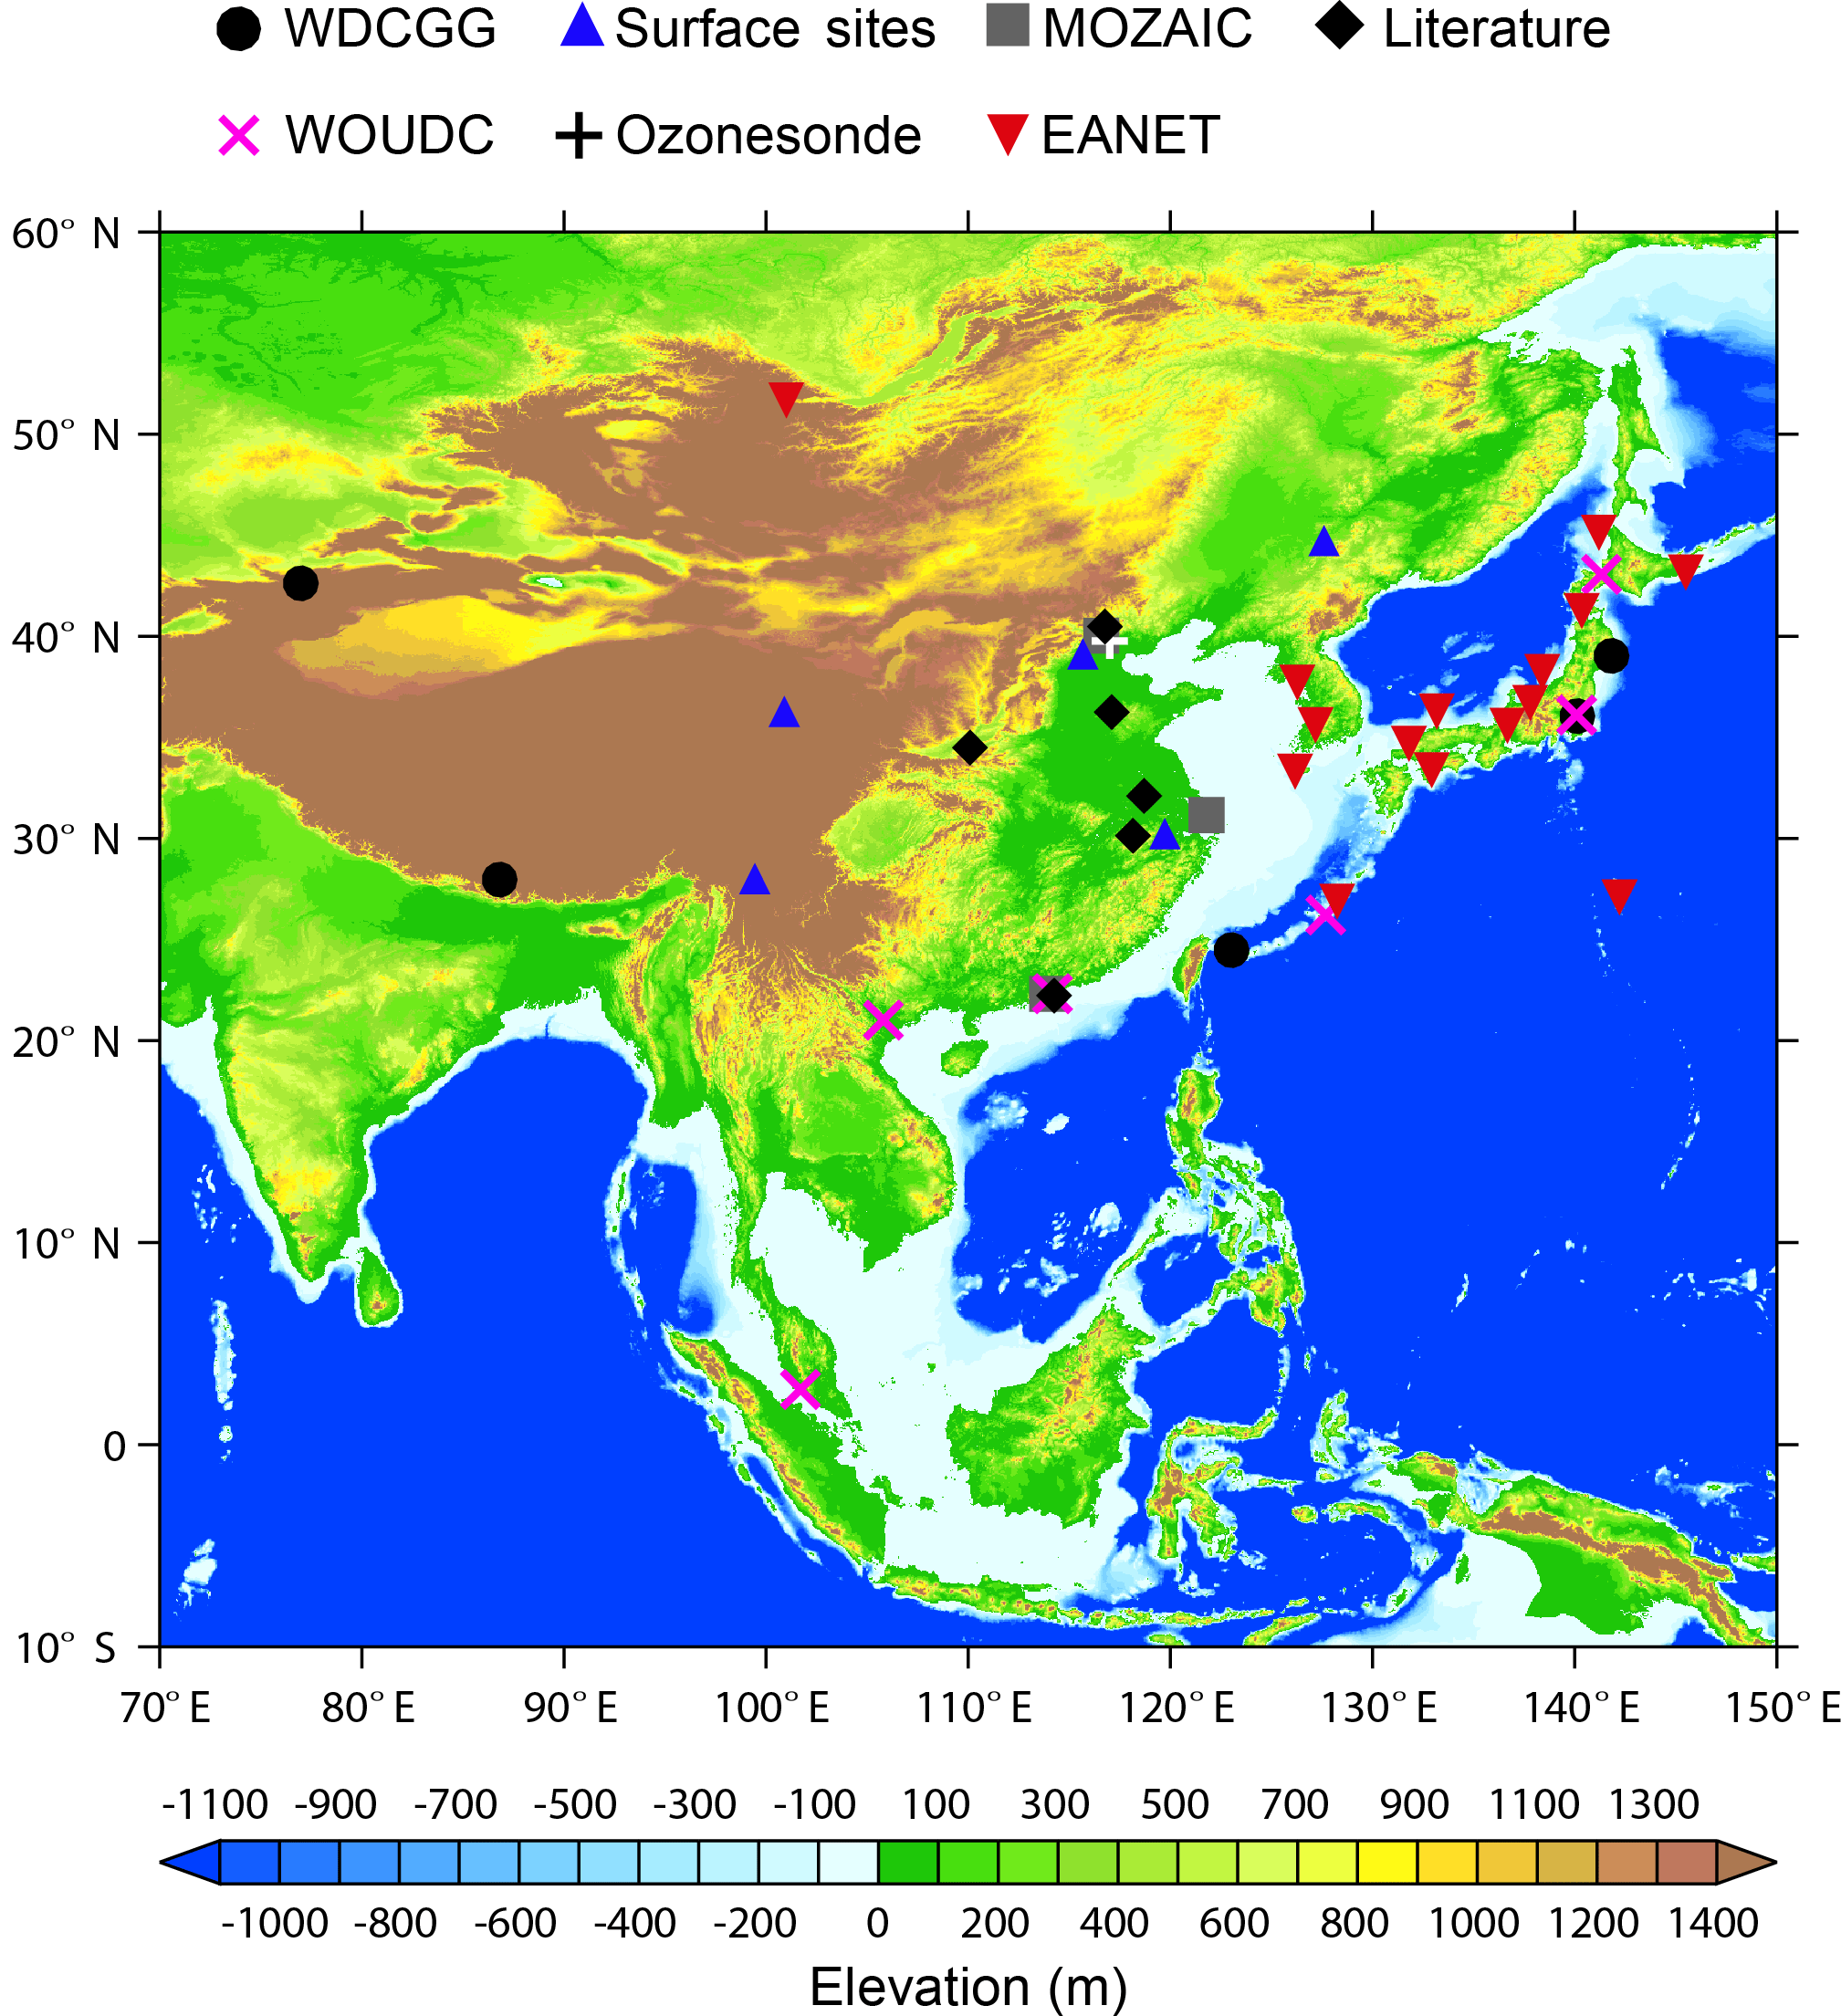
Figure 3Observation sites overlaid on the surface elevation map from the 2 min Gridded Global Relief Data (ETOPO2v2) available at the NGDC Marine Trackline Geophysical database (http://www.ngdc.noaa.gov/mgg/global/etopo2.html, last access: 25 September 2017).
2.3 Measurements
This study presents model evaluation over China and its neighboring countries in spring. We also evaluate the simulation of CO, a relatively long-lived transport tracer. Figure 3 shows the suite of ground, aircraft, and ozonesonde measurements.
2.3.1 Surface measurements
Measurements from a total of 32 ground sites are used here; see Tables 3 and 4 for geographical information. Routine observations of ozone and CO in China were scarcely available before 2013. Hourly data are available for this study from five rural/background sites across China maintained by the Chinese Meteorological Administration (Xu et al., 2008; Lin et al., 2009; Fang et al., 2014; Ma et al., 2014). These sites include a rural site (Gucheng over the North China Plain), three regional background sites (Longfengshan over the northeast, Lin'an over the east, and Shangri-La over the southwest), and a Global Atmosphere Watch (GAW) background site (Waliguan over the west). Data are available for 2007 at Gucheng and Longfengshan and for 2008 at the other three sites.
Table 3Comparison of simulated and observed springtime MDA8 ozone and CO at five regional background sites in China and six global background stations near China with hourly measurements.
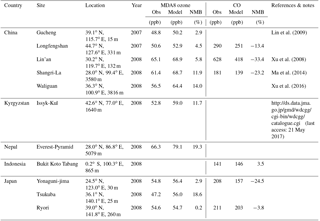
We also use hourly ozone and CO measurements in spring 2008 from six GAW background sites in the vicinity of China from the World Data Centre for Greenhouse Gases (WDCGG, http://ds.data.jma.go.jp/gmd/wdcgg/cgi-bin/wdcgg/catalogue.cgi, last access: 21 August 2017) These sites include Issyk-Kul in Kyrgyzstan, Everest-Pyramid in Nepal, Bukit Koto Tabang in Indonesia, and Yonaguni-jima, Tsukuba, and Ryori in Japan.
Table 4Comparison of simulated springtime monthly mean ozone with observations from EANET and literature.
To obtain a more comprehensive observation dataset for model evaluation, we further use monthly mean ozone data in spring 2008 from 15 remote/rural sites from the Acid Deposition Monitoring Network in East Asia (EANET, http://www.eanet.asia/product/index.html, last access: 19 October 2017). We also collect monthly ozone observation data at six sites over China from the literature, including data at three mountain sites (Mts. Tai, Hua, and Huang).
2.3.2 Measurements of vertical profiles
To evaluate vertical distribution of ozone and CO over China, we use observations from the Measurements of Ozone and Water Vapor by Airbus In-Service Aircraft (MOZAIC) program (Marenco et al., 1998). Data during both ascending and descending processes of the aircrafts are available during spring 2000–2005 at three airports (Beijing, Shanghai, and Hong Kong). The vertical resolution is 150 m.
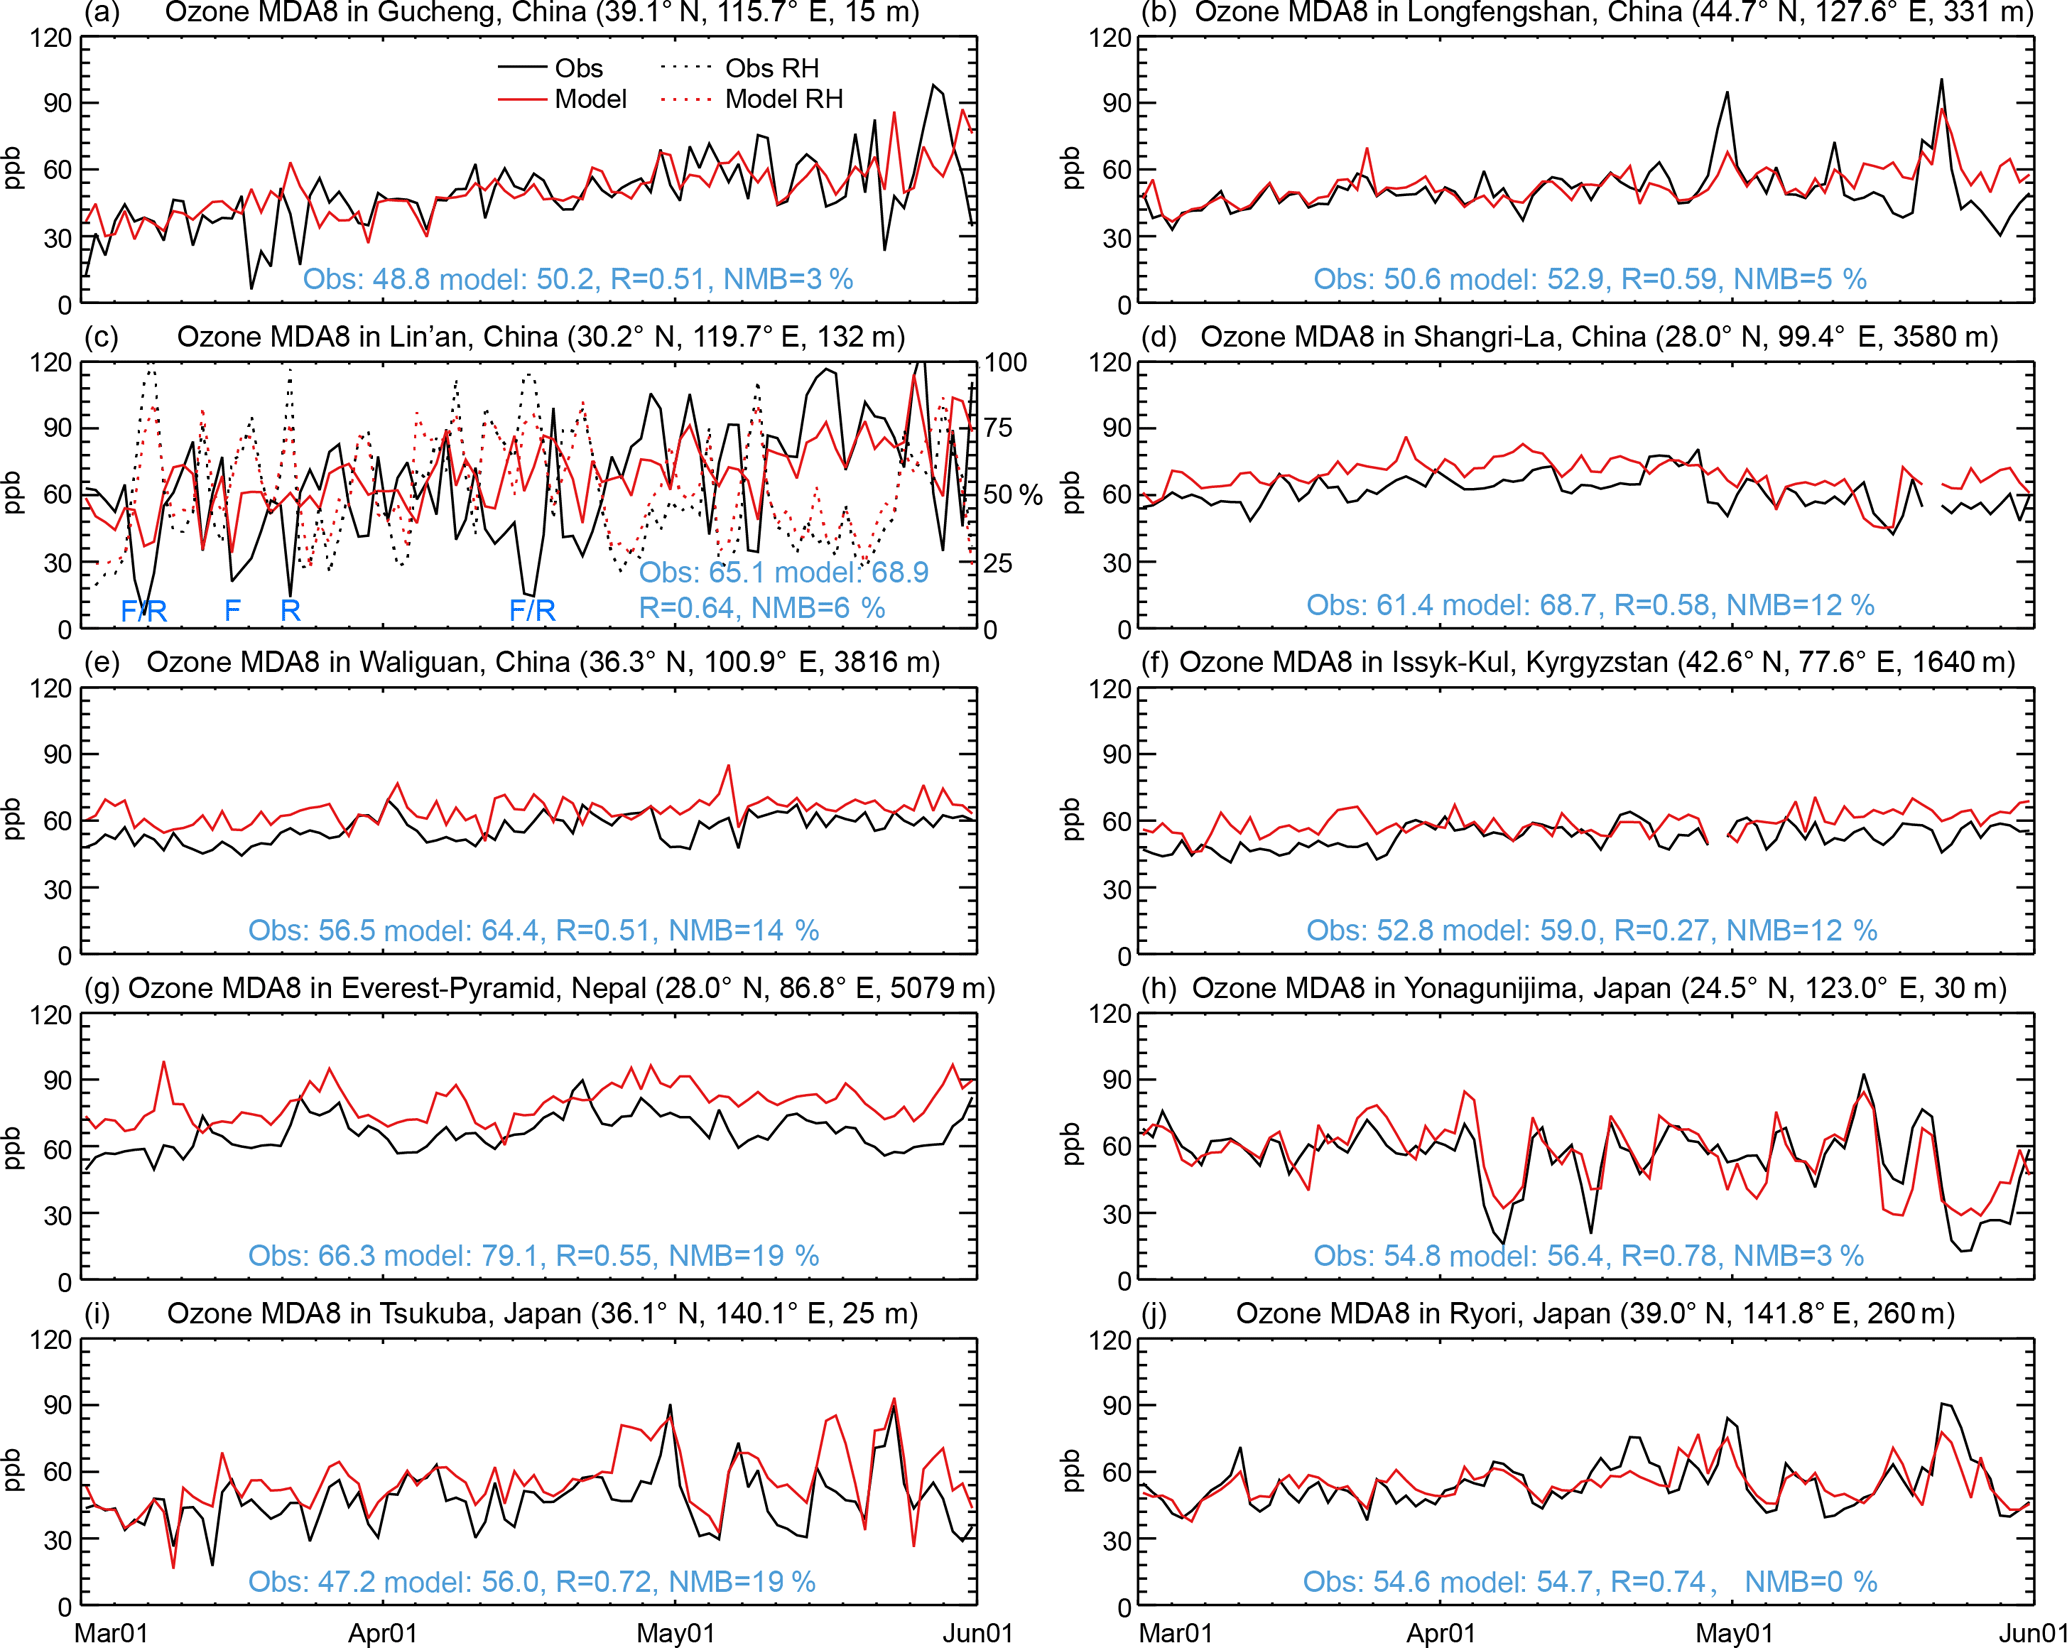
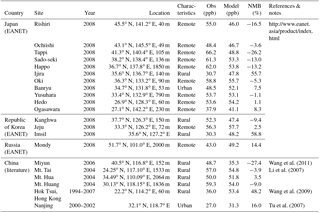
Figure 4Time series of springtime MDA8 ozone at surface sites over (a–e) China and (f–j) nearby countries. Due to lack of measurement data in 2008, comparisons at Gucheng and Longfengshan are based on 2007. In (c), observed and modeled RH are also compared, and the “F” and “R” symbols denote observed fog or rain, respectively.
We further use the ozonesonde data at six sites in spring 2008 from the World Ozone and Ultraviolet Data Centre (WOUDC, http://www.woudc.org/data/explore.php?lang=en, last access: 23 April 2017) operated by the Meteorological Service of Canada. The six sites include Hanoi in Vietnam, Hong Kong in China, Sepang Airport in Malaysia, and Sapporo, Naha, and Tateno in Japan. Ozonesondes are launched every few days; thus the data are relatively scarce. We also use the GPSO3 ozonesonde data in spring 2008 over Beijing measured by the Institute of Atmospheric Physics (IAP) of the Chinese Academy of Sciences (Wang et al., 2012). All ozonesonde measurements were launched at around 14:00 local time.
Here we focus on model evaluation over China and its neighboring area in spring. Global ozone evaluation of the two-way coupled model system is detailed in Yan et al. (2016) using 1420 ground sites, various aircraft observations, and satellite measurements, although the observations over China are sparse.
3.1 Surface ozone and CO over China and nearby countries
Figure 4 compares the springtime time series of modeled (solid red line) and observed (solid black line) maximum daily average 8 h (MDA8) ozone concentrations at 10 sites with daily measurements. Model data are sampled at times and locations coincident with valid observations.
Figure 4a–b evaluate the model results at Gucheng and Longfengshan. To compare to observations in spring 2007 at these two sites, we conduct an additional full-chemistry simulation for 2007. At these sites, the model captures the observed MDA8 ozone, with a normalized mean bias (NMB) of 3 % at Gucheng and 5 % at Longfengshan. The respective correlation coefficients (R) for day-to-day variability are 0.51 and 0.59; the modest correlation is primarily because the model does not capture a few short-term spikes.
At Lin'an (Fig. 4c), the modeled spring average MDA8 ozone matches the observed value (68.9 ppb versus 65.1 ppb, R=0.64). The model cannot reproduce the observed extreme low values on several days. This deficiency is likely due to representative errors of model meteorology. Located in a hilly area, this site often receives rains and fogs in spring, which is not captured by the model meteorology at a resolution of 0.667∘ longitude × 0.5∘ latitude. We find that the extremely low observed ozone values normally occur on days with high relative humidity (black dashed line, reflecting rainy or foggy days), when the model underestimates RH (red dashed line) and overestimates ozone.
At Shangri-La, Waliguan, and Issyk-Kul (Fig. 4d–f), with high altitudes (1640–3816 m) and few local anthropogenic sources, the model overestimates the MDA8 ozone by 7–8 ppb (12 %–14 %). At Everest-Pyramid in Nepal (Fig. 4g, at 5079 m altitude), the overestimate reaches 13 ppb (19 %). These positive biases are due to overestimated transport from the free troposphere and stratosphere. The model captures the temporal variability in MDA8 ozone quite well (R=0.72–0.78) at the three Japanese sites (Yonaguni-jima, Tsukuba, and Ryori; Fig. 4h–j). The model's NMB is within 3 % at Yonaguni-jima and Ryori. There is an overestimate at Tsukuba (NMB =19%), mostly reflecting the large positive biases on a few days.
Table 4 shows model comparisons with monthly mean EANET ozone data. These data represent daily mean rather than MDA8 values, based on the availability of observations. At seven sites, the model results exceed the observations with a mean difference of 7 ppb (16 %). At the other eight sites, the model results are smaller than the observations with a mean difference of 7 ppb (11 %). These differences reflect model biases as well as a sampling bias due to lack of knowledge on which days contain valid observations.
Table 4 further compares the modeled monthly mean daily mean ozone in spring 2008 to the observations in various years collected from the literature. Again, the comparison is affected by a sampling bias. Although not our primary focus, this extended comparison gives a sense of how model ozone is situated in the general ozone pollution phenomena in China. The model reproduces the average magnitude of ozone at the three mountainous sites (Mts. Tai, Hua, and Huang) with a mean bias below 5 ppb (9 %). The model has a large overestimate by 48 % at the Hok Tsui coastal rural site in Hong Kong (36.0 versus 53.4 ppb), although the times are different (2008 versus 1994–2007). Wang et al. (2009) shows that the springtime ozone concentration at this site increased from 1994 to 2007 at a rate of 0.41 ppb yr−1, partly explaining this difference. The remaining difference may reflect that the model resolution is not able to represent the complex local terrain and land–sea contrast at this site. The model overestimates ozone at an urban site in Nanjing by 16 %, although the observations were made in 2000–2002 when Chinese anthropogenic emissions of NOx were only about half of those in 2008 (Xia et al., 2016).
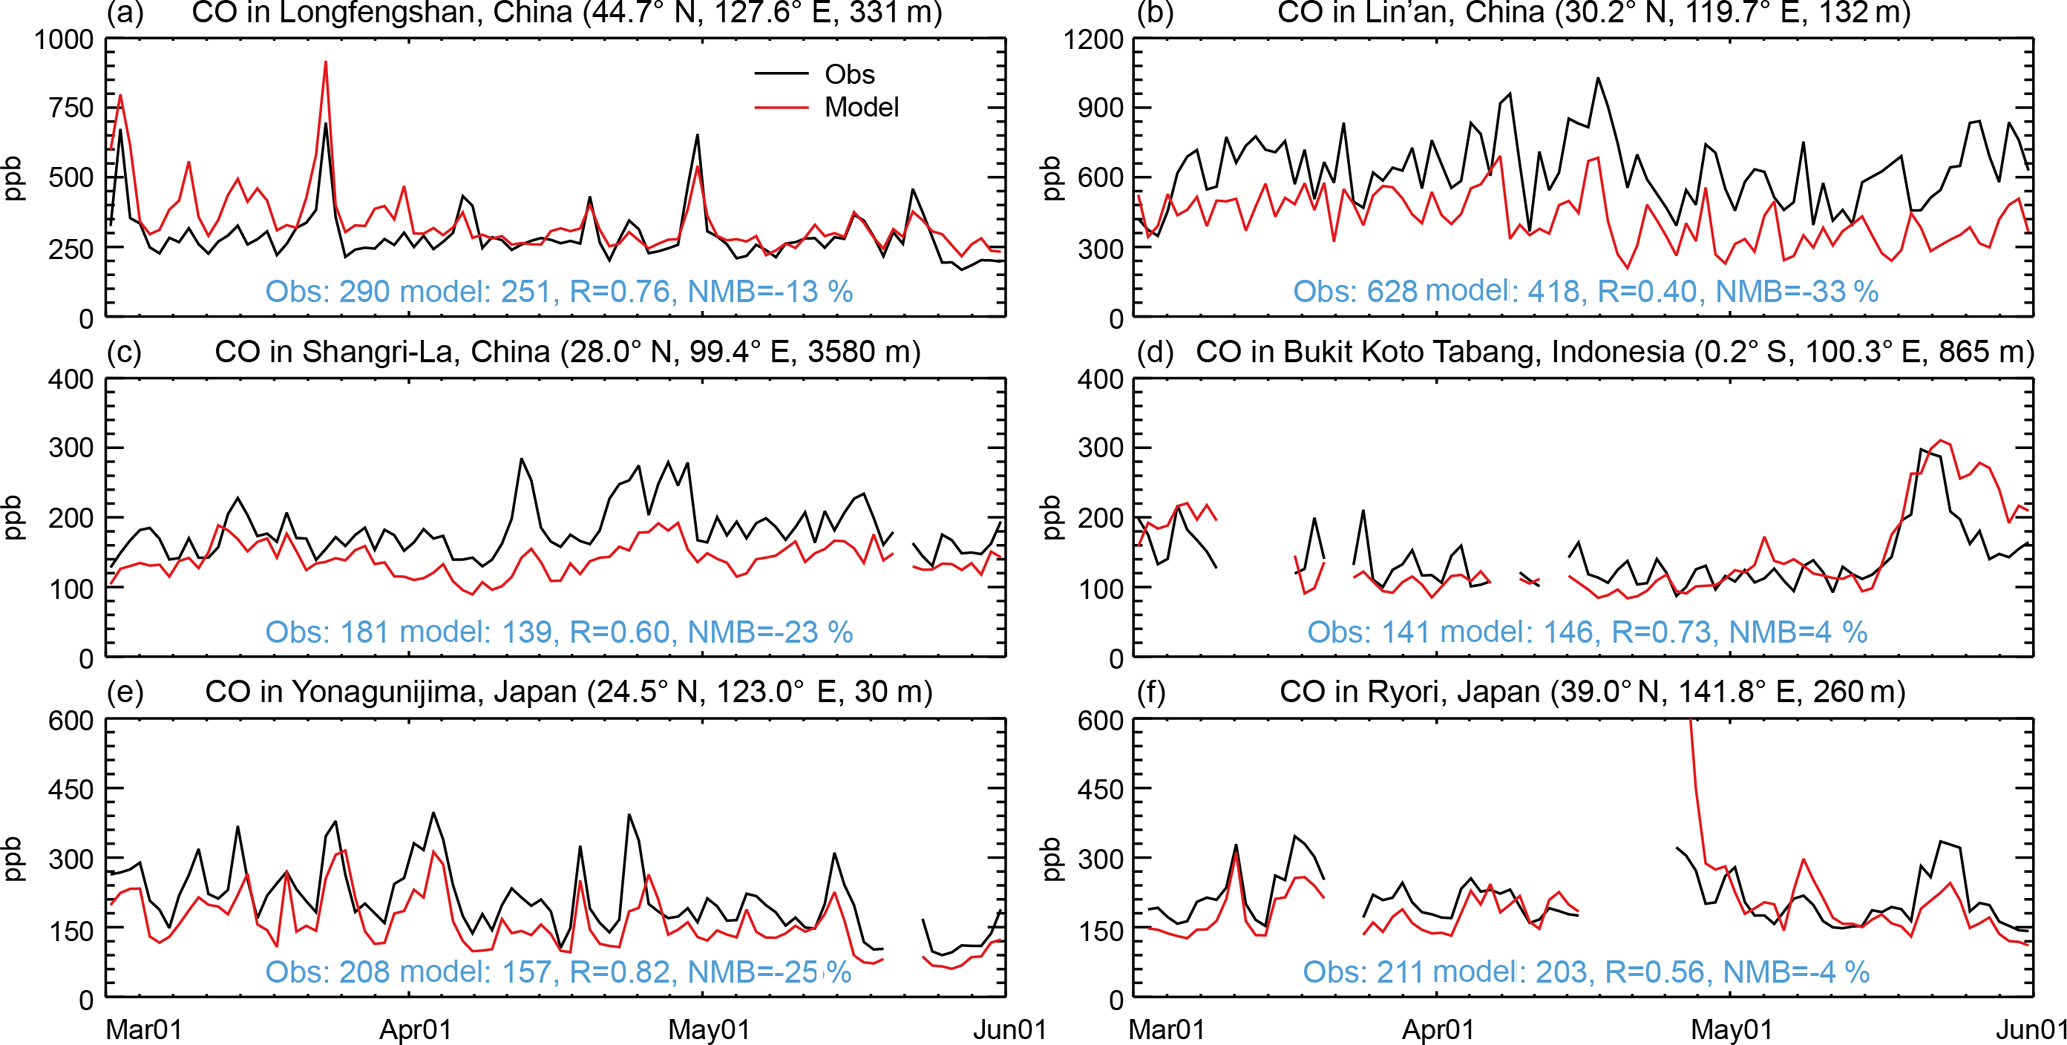
Figure 5Time series of daily mean CO at six surface sites over (a–c) China and (d–f) nearby countries.
We also evaluate the modeled daily average CO at six sites within and outside China with available hourly observations (Fig. 5). Overall, the model captures the day-to-day variability in daily mean CO fairly well (R=0.40 at Lin'an, 0.60 at Shangri-La, 0.56 at Ryori, and 0.73–0.82 at the other three sites). It has a small mean bias (within 4 %) at Bukit Koto Tabang, and Ryori, although with negative biases (by 13 %–33 %) at the other four sites. Such an underestimate is typical in global simulations (Young et al., 2013), and it may be related to excessive OH (Young et al., 2013; Yan et al., 2014, 2016) and/or underestimated emissions (Kopacz et al., 2010; Wang et al., 2011). Compared to the coarse-resolution global model alone, our two-way coupling results in less CO underestimation (Yan et al., 2014), although it does not eliminate the bias.
3.2 Vertical profiles of ozone and CO
Figure 6a–c compare modeled ozone in 2008 to MOZAIC data over 2000–2005 at the airports of Beijing, Shanghai, and Hong Kong. Although model and MOZAIC data are in different years, to achieve the best sampling consistency, we sample the model results at times of day when the commercial aircrafts take off or land with available MOZAIC data. The timing information is shown in Fig. 6. GEOS-Chem reproduces the vertical gradient of MOZAIC ozone in general. The model underestimates MOZAIC ozone in the PBL over the Beijing airport mainly due to inconsistent temporal sampling, as further comparison with GPSO3 ozonesonde data (Bian et al., 2007; Wang et al., 2012), in which model results are sampled at times coincident with the observations, show little model bias (within 4 %, Fig. 6g). Over Hong Kong, the model captures the weak vertical gradient between 2 and 11 km, although it has a positive bias below 2 km due to its inability to capture the complex terrains and local pollution source characteristics around the airport. The model overestimates ozone in the middle and upper troposphere over Shanghai, with larger biases at higher altitudes, likely indicating too strong STE. Other causes may include differences in meteorology and growth in emissions between 2000–2005 and 2008, as discussed for the surface ozone in Sect. 3.1.
Figure 7 compares the modeled ozone profiles to WOUDC data at six sites. Here model results are sampled at ozonesonde launch times, and ozonesonde data are regridded to match the model vertical resolution. Overall, GEOS-Chem captures the vertical gradient of ozone fairly well. The model reproduces the overall weak vertical gradients at Hanoi, Hong Kong, Sepang, and Naha. It also reproduces the rapid increases above 8 km at Sapporo and Tateno, although it has positive biases at 10–20 ppb. GEOS-Chem reproduces the observed middle and upper tropospheric ozone at Hong Kong and Sepang, although it has an overestimate in the lower troposphere, consistent with the bias shown in Fig. 6c.
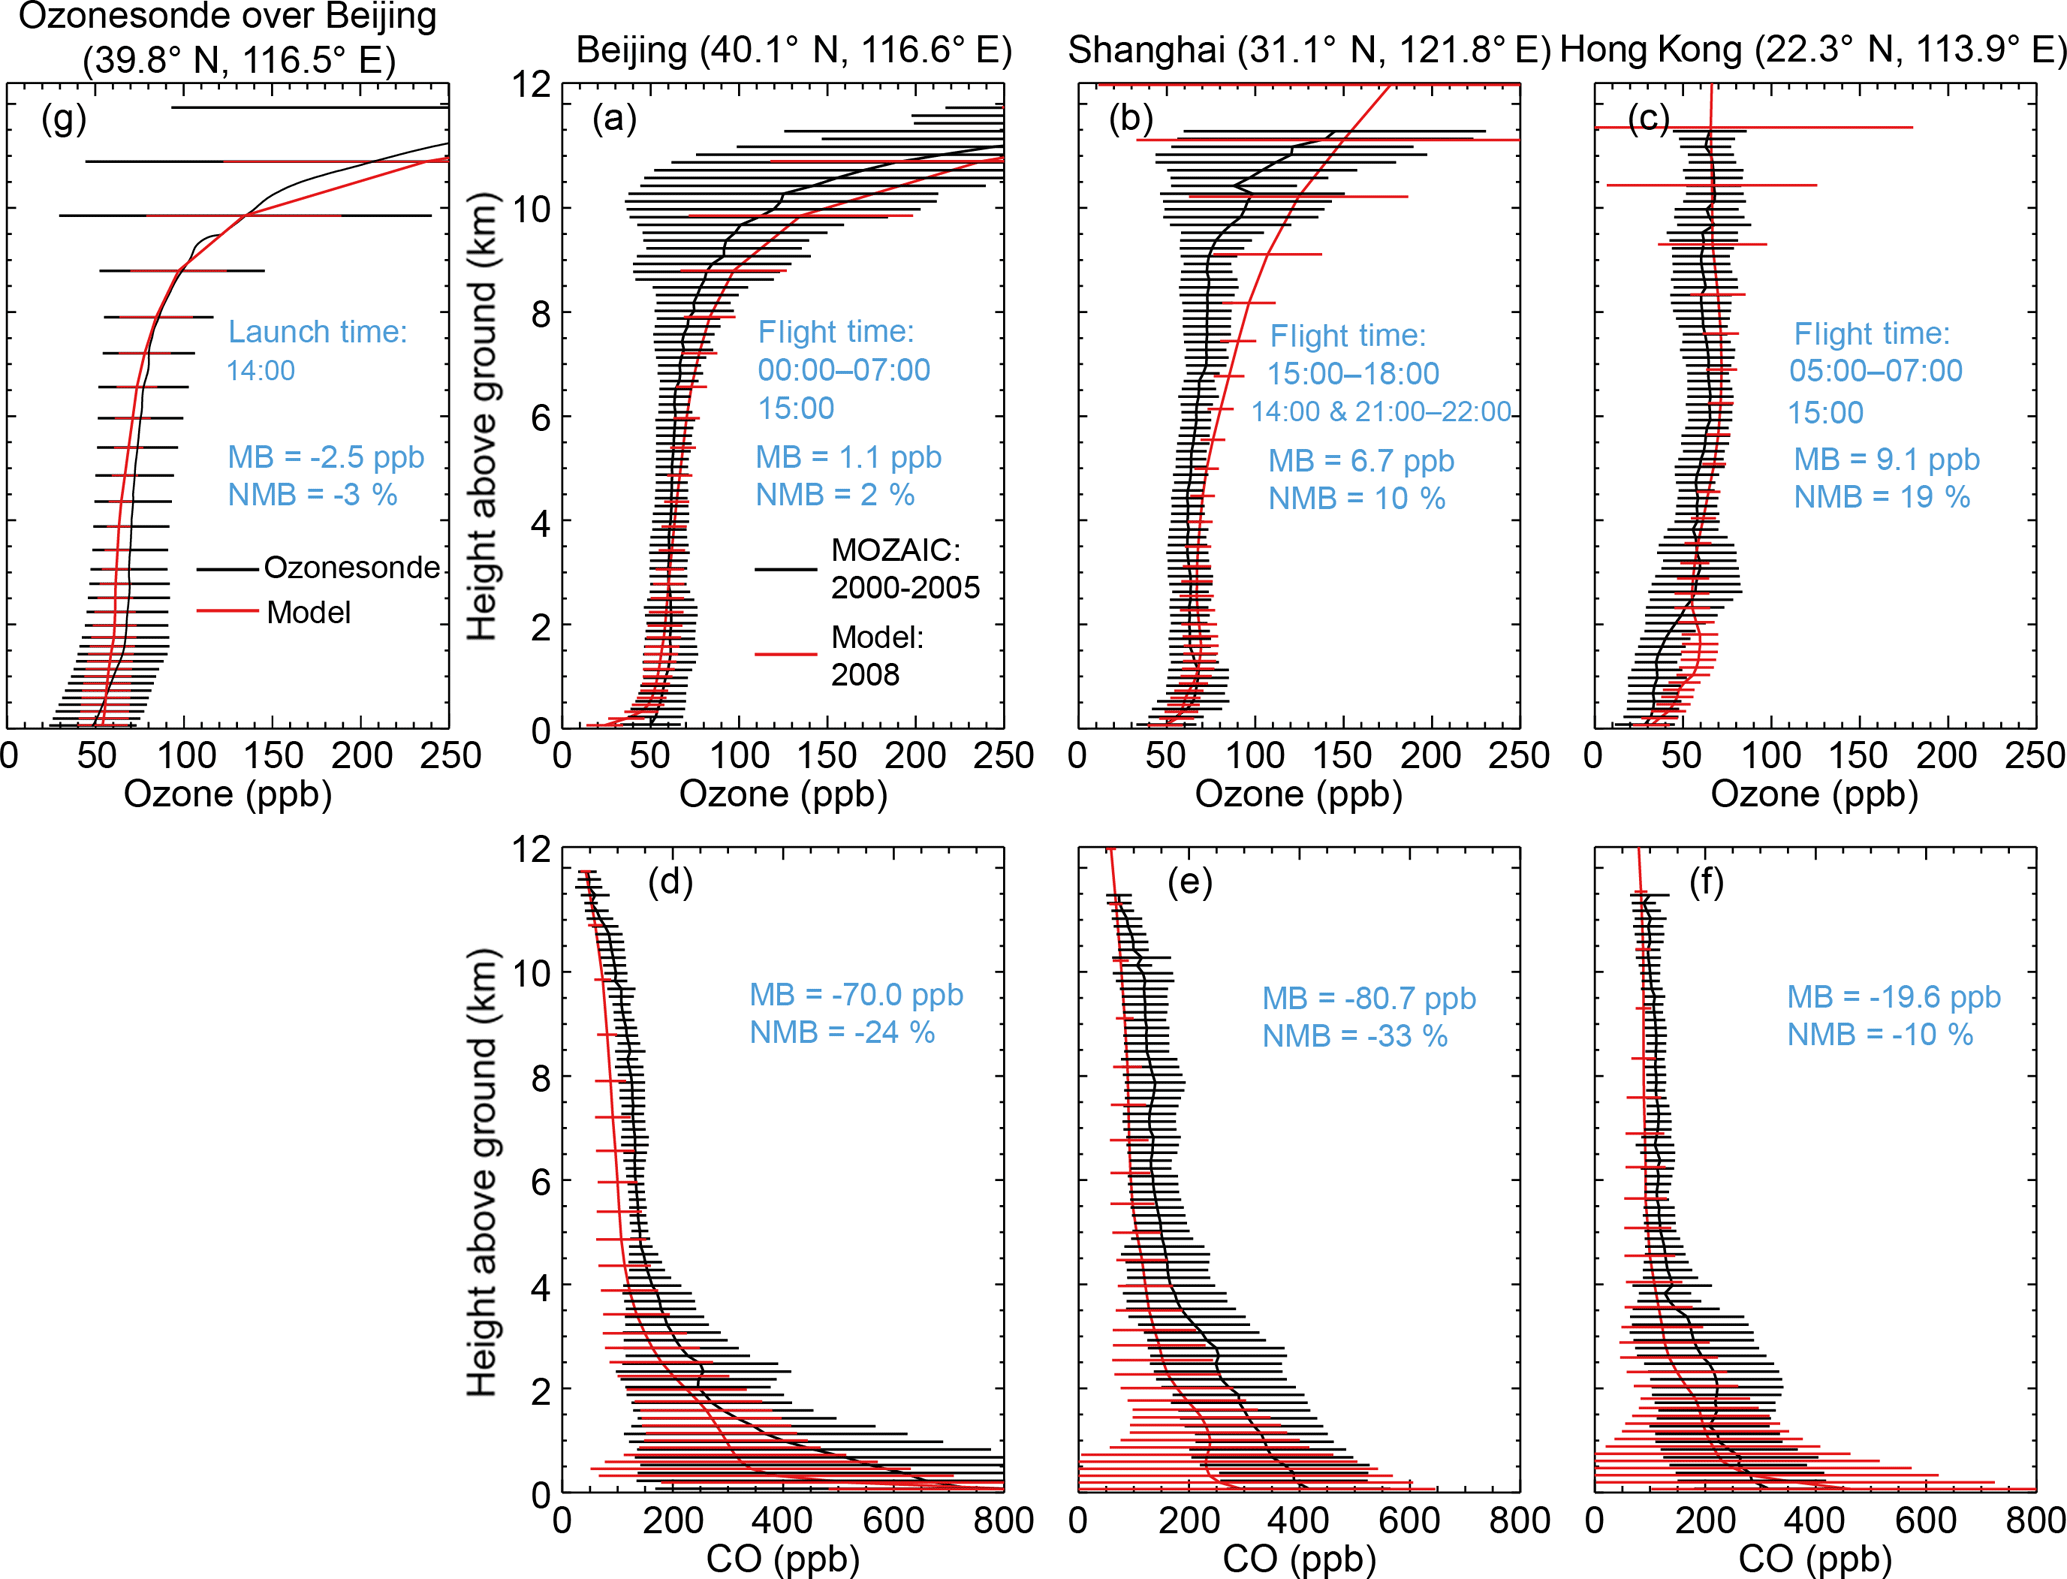
Figure 6Model and MOZAIC vertical profiles of (a–c) ozone and (d–f) CO over airports of Beijing, Shanghai, and Hong Kong, averaged over multiple profiles. (g) Model and GPSO3 ozonesonde data over Beijing in spring 2008. Horizontal bars indicate 1 standard deviation across multiple profiles. Mean bias (MB), normalized mean bias (NMB), main fight times (local time) at each MOZAIC site, and GPSO3 ozonesonde launch time (local time) are also shown.
Figure 6d–f also compare the modeled CO with the MOZAIC data. Similar to the evaluation results for surface CO, GEOS-Chem generally underestimates the MOZAIC CO at most heights above the three airports, although it captures the vertical shape fairly well.
3.3 Summarizing remark on model evaluation
Our simulation has a small NMB for surface ozone, about 10 % averaged over 10 sites with hourly data (Fig. 4 and Table 3) and about 15 % averaged over 21 sites with monthly data from EANET and the literature (Table 4). The model also captures the general vertical distribution of ozone at 10 locations over China and nearby regions, with a tropospheric mean bias at 12 %. These agreements allow using the model for source attribution studies in the next sections. Conversely, with a horizontal resolution of about 50 km over Asia, the model often fails to simulate the complex terrains, local meteorological conditions, and/or local emission characteristics at several hilly or airport sites. The model also tends to overestimate the STE influences over Asia. Addressing these issues warrants future research with improved model resolutions and STE representation.
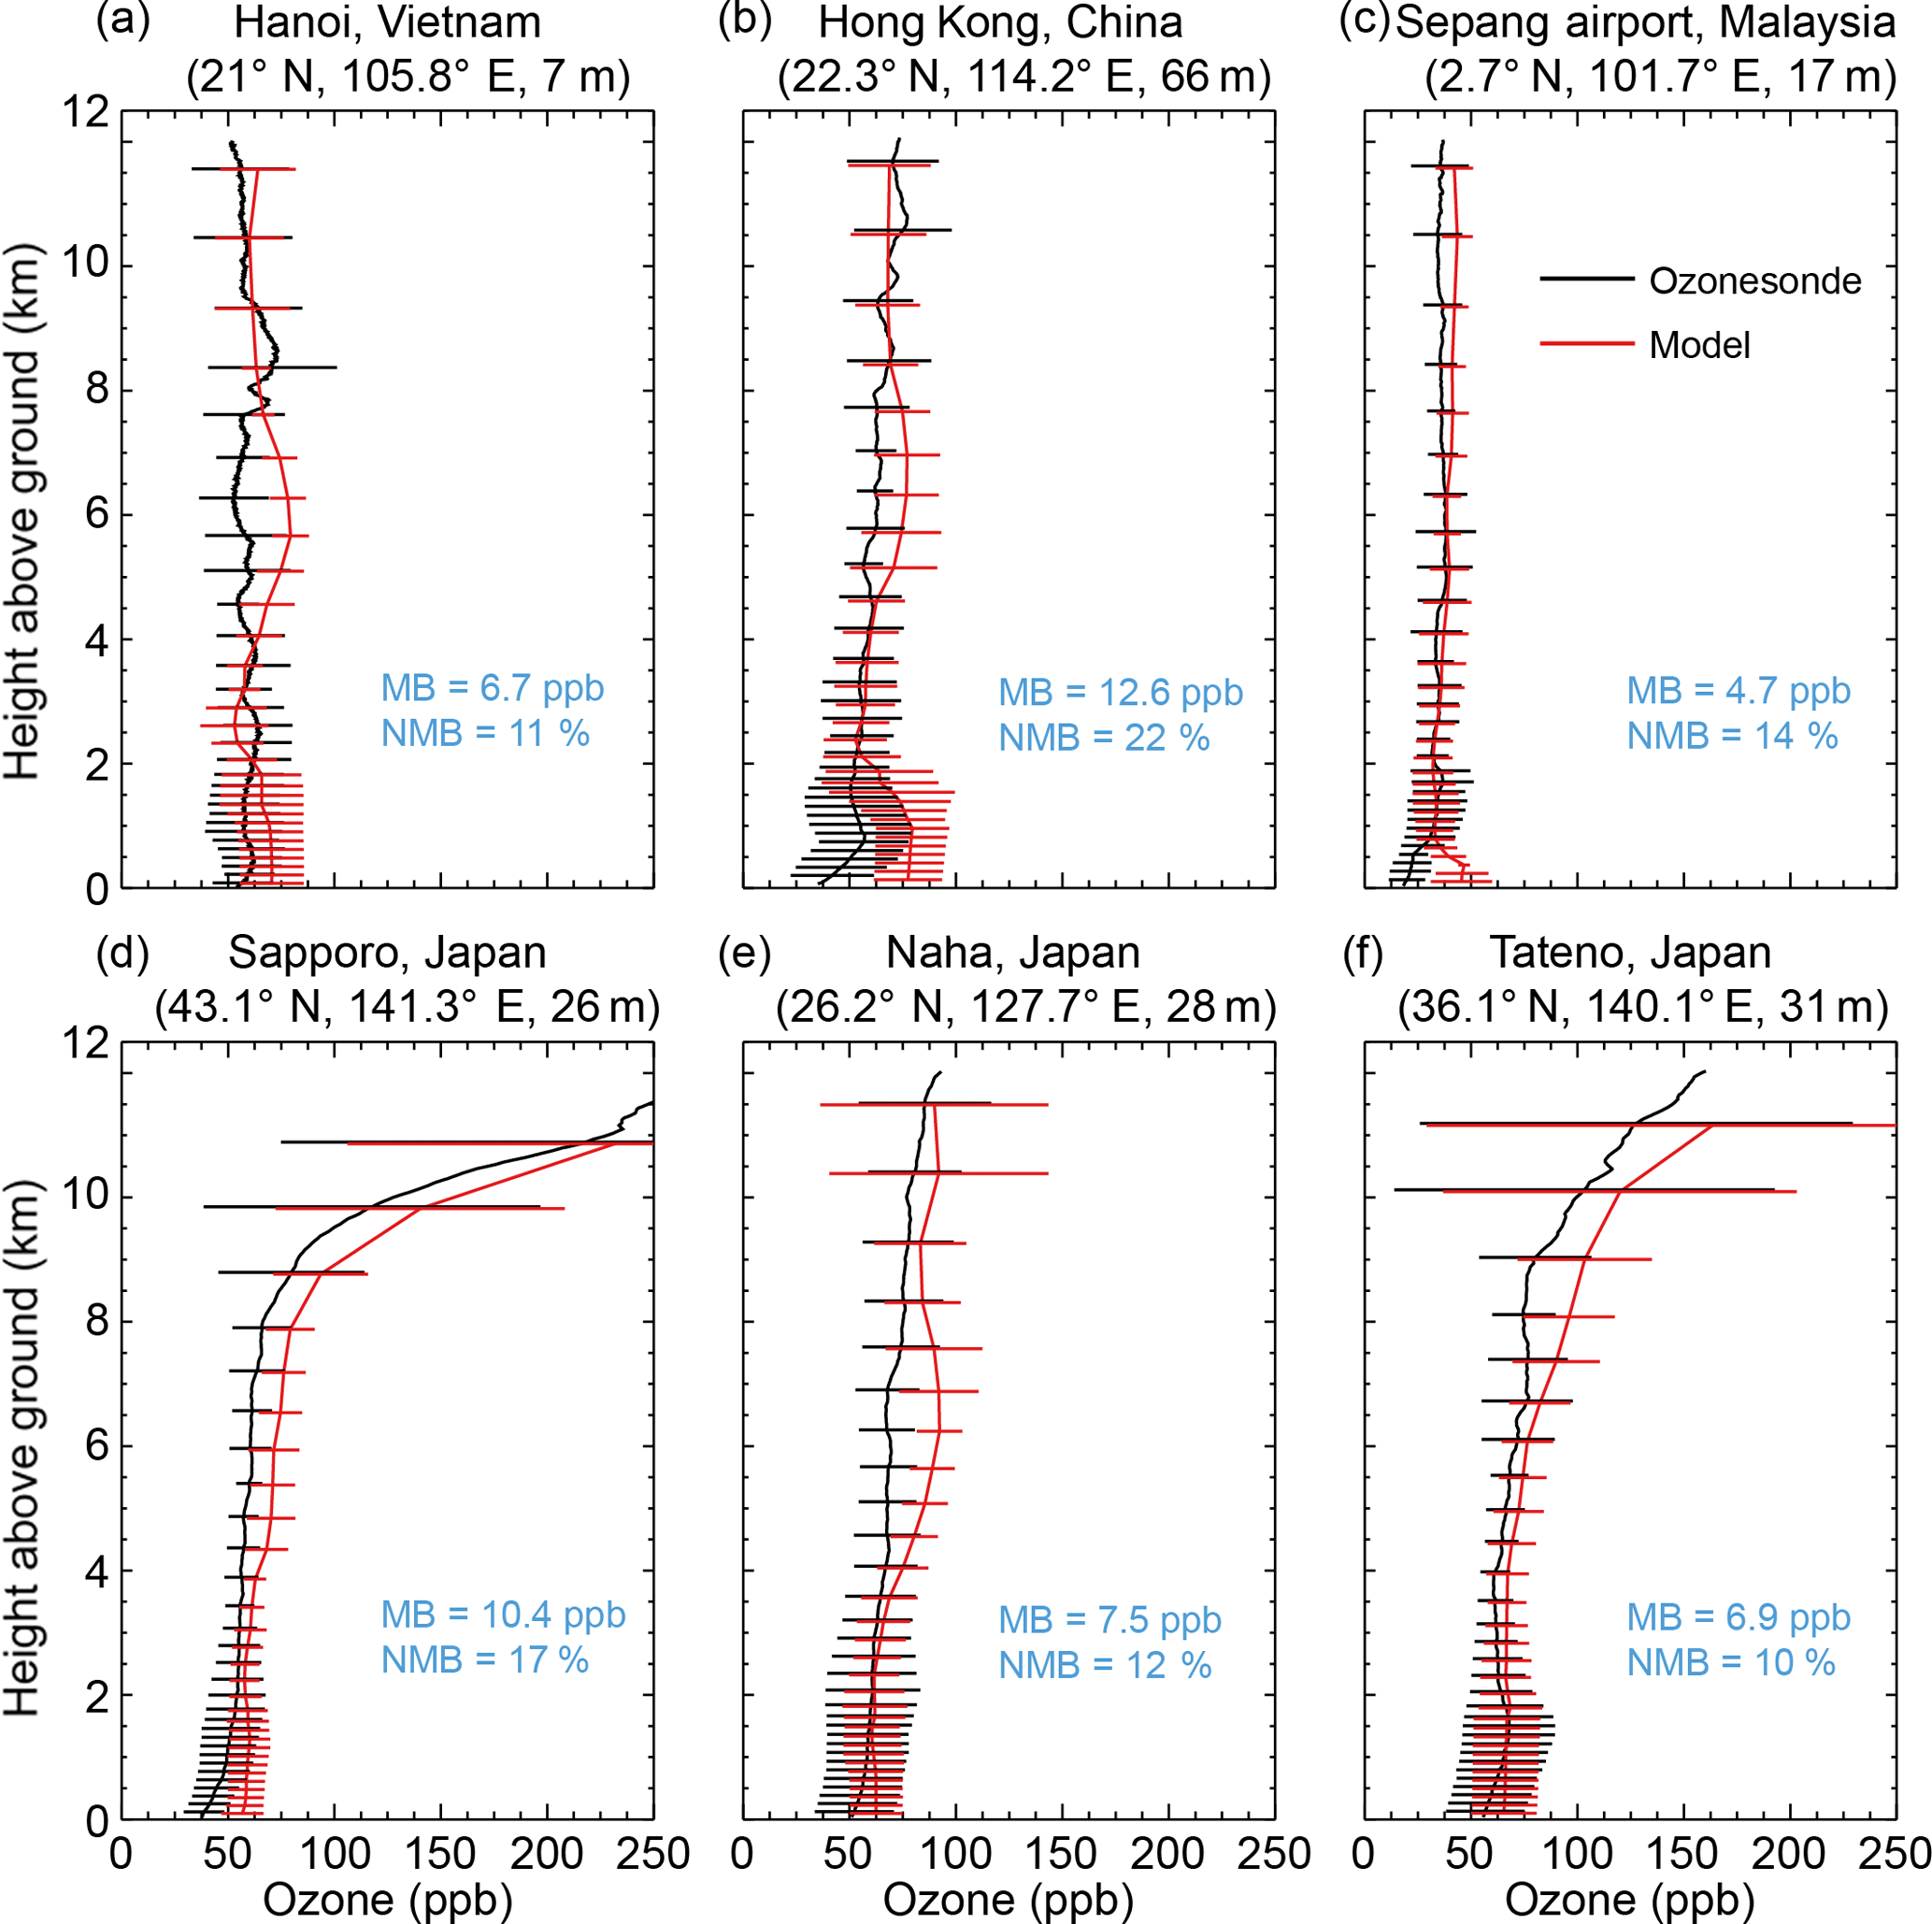
Figure 7Model and WOUDC ozone profiles at six sites, averaged over multiple profiles. Horizontal lines indicate 1 standard deviation across multiple profiles. Mean bias (MB) and normalized mean bias (NMB) are shown in blue.
GEOS-Chem tends to underestimate CO over Asia (by 20 % on average), similar to many other models (Kopacz et al., 2010; Young et al., 2013). We conduct a sensitivity simulation by doubling Chinese anthropogenic CO emissions, which results in a slight increase in surface ozone by 0.1–0.4 and 2–3 ppb over clean and polluted areas of China, respectively. The low sensitivity of ozone to CO emissions was also found by Z. Jiang et al. (2015). We thus conclude that our ozone simulations over China are influenced insignificantly by the underestimate in CO.
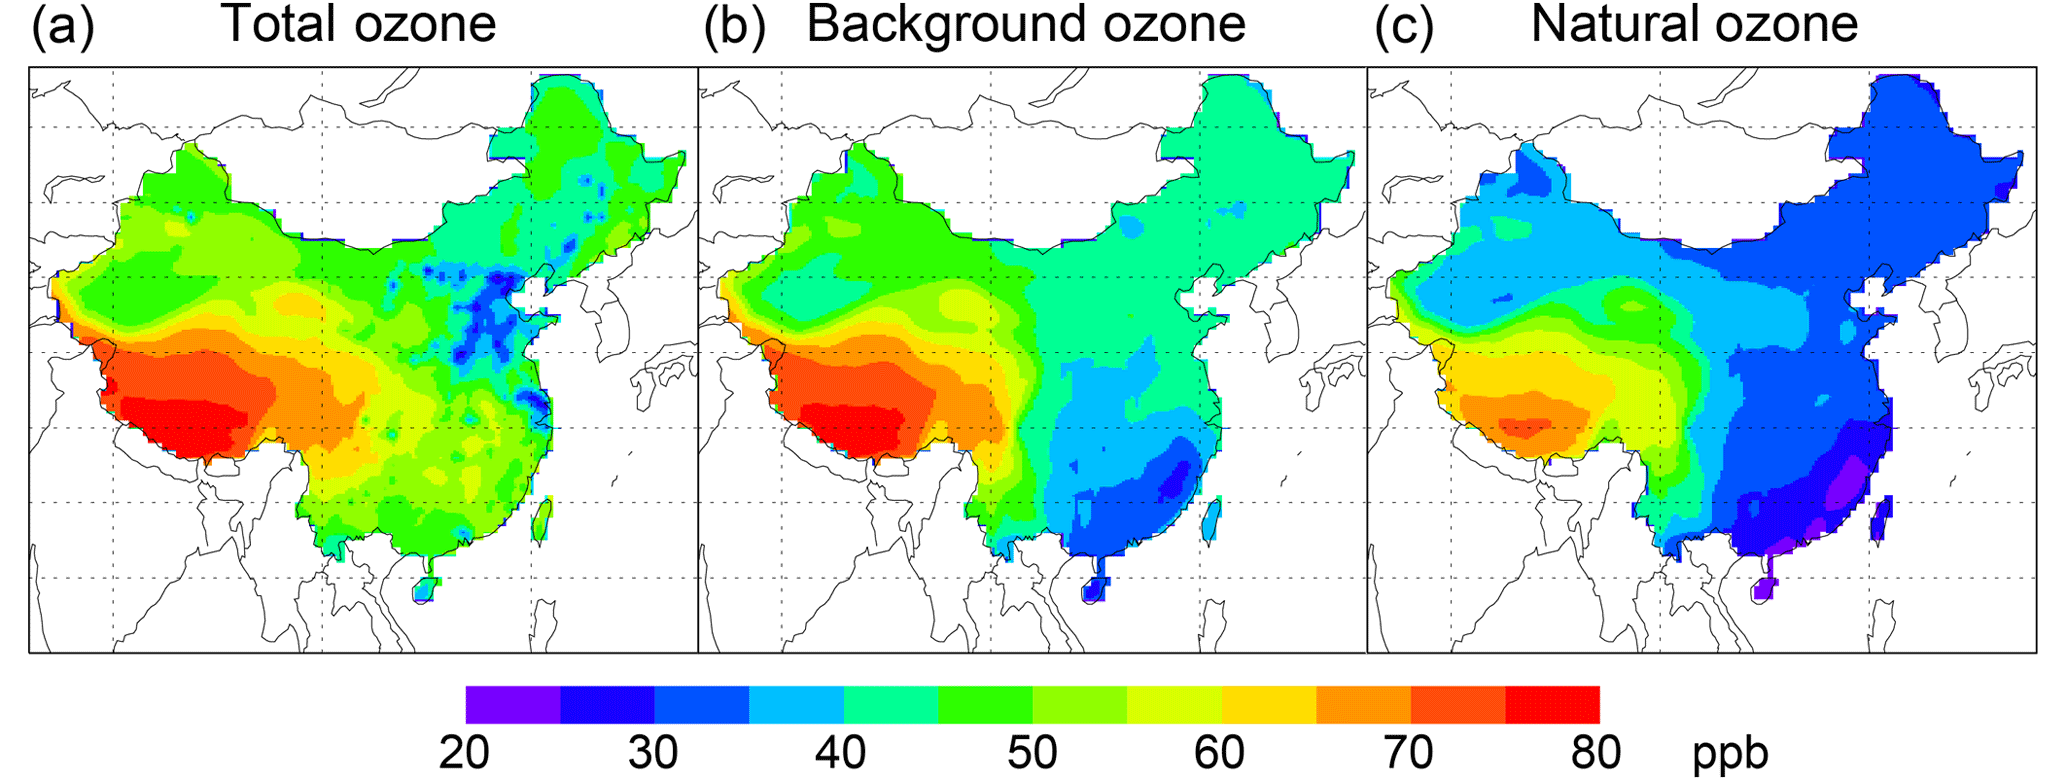
Figure 8Spatial distribution of springtime daily mean (a) total surface ozone, (b) background ozone, and (c) natural ozone over China.
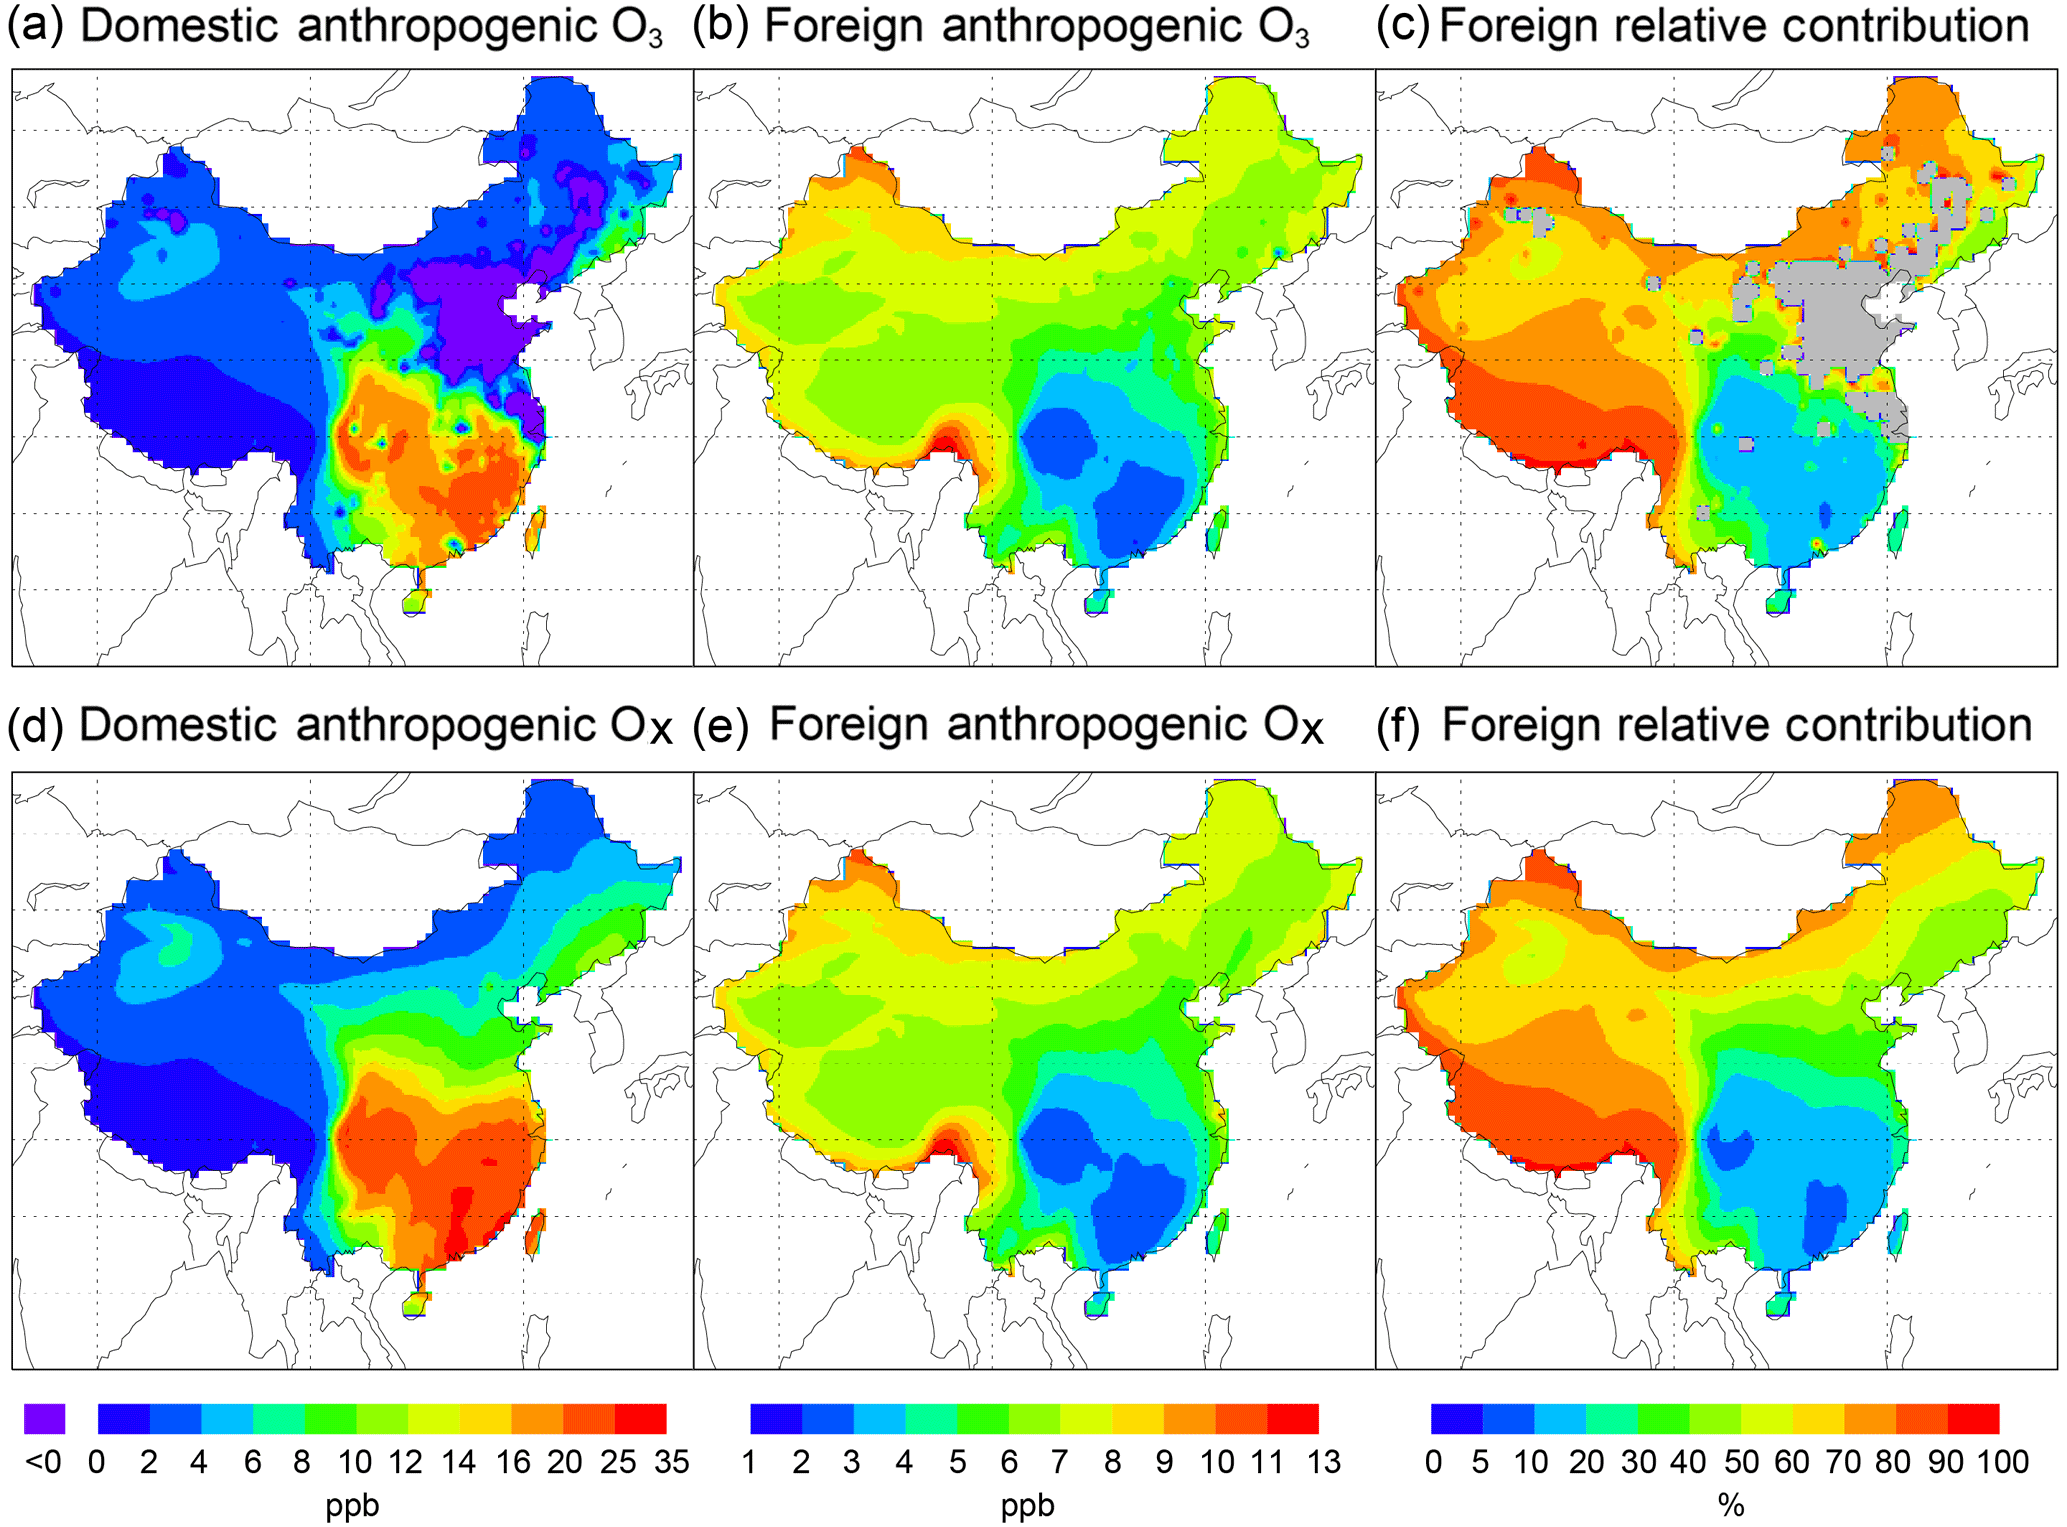
Figure 9Spatial distribution of springtime daily mean surface ozone over China contributed by (a) domestic and (b) foreign anthropogenic emissions. (c) Percentage contribution of foreign anthropogenic emissions to total anthropogenic ozone; areas with negative Chinese contributions (due to NOx titration) are marked in grey. (d–f) Similar to (a–c) but for Ox (). The linear weighting adjustment is applied to derive all results. Note that the color scales are different between (a, d) and (b, e).
4.1 Total, background, and natural ozone
Figure 8a shows the modeled spatial distribution of near-surface daily mean ozone in spring 2008 over China from all natural and anthropogenic sources, i.e., the CTL case. Ozone concentrations reach 75–80 ppb over the southern Tibetan Plateau, and they are minimum (25–40 ppb) over the North China Plain and many populous cities across eastern China. Ozone is about 45–60 ppb over the vast southeast, northwest, and northeast.
The simulated natural ozone (i.e., without anthropogenic emissions worldwide, the xANTH case) shows a strong gradient from the southern Tibetan Plateau (65–75 ppb) to the northwest (35–40 ppb) and the east (20–35 ppb) (Fig. 8c). Wang et al. (2011) show similar gradients of natural ozone in 2006. Natural ozone contributes 80 %–90 % of total surface ozone over Tibet and the northwest with low local anthropogenic emissions. The large natural ozone concentrations over Tibet are a result of vertical transport from the free troposphere and stratosphere due to Tibet's high altitudes and hilly terrains (that are conducive to vertical exchange) (Ding and Wang, 2006; Lin et al., 2015; Xu et al., 2017). They pose potential threats for public health and ecosystems there.
The simulated background ozone (i.e., without Chinese anthropogenic emissions, the xCH case) is shown in Fig. 8b. The background ozone is higher than the natural ozone by 2–11 ppb over most Chinese regions (Fig. 9b). This indicates large influences of foreign anthropogenic emissions through atmospheric transport of ozone and its precursors, as discussed in detail below.
4.2 Domestic versus foreign anthropogenic contributions to ozone
Figure 9a shows the spatial distribution of domestic anthropogenic contributions to daily mean surface ozone over China (difference between the control run and the sensitivity simulation, CTL–xCH, followed by a linear weighting adjustment). Over most of the west and northeast, Chinese anthropogenic emissions are relatively low, and they result in ozone concentrations of 0–4 ppb. In contrast, domestic contributions reach 16–25 ppb over the south due to more emissions and favorable conditions for photochemistry. Over the North China Plain and many populous cities, Chinese anthropogenic emissions lead to reductions (instead of enhancements) of surface ozone. This is because of a weak ozone production efficiency and a strong titration effect by excessive domestic NOx emissions. Figure 9d–f show that when Ox ( is considered, Chinese anthropogenic contributions vary from 2–4 ppb over the west to 6–12 ppb over the North China Plain and 20–35 ppb over the southeast (Fig. 9d).
Figure 9b shows the simulated contributions to Chinese surface ozone by all foreign anthropogenic emissions. Foreign contributions reach 7–11 ppb along much of the Chinese borders and they exceed 6 ppb over the vast northern regions. The foreign contribution reduces from the border to the inner areas, with a minimum (2–3 ppb) over the Sichuan Basin where the air is more isolated. In terms of anthropogenic ozone, foreign contributions account for up to 90 % over most of western and northeastern China (Fig. 9c), consistent with the findings by Li et al. (2015) for western China in 2000. Foreign anthropogenic contributions to Ox over China are similar to their contributions to ozone (Fig. 9e), except at places with strong Chinese NOx emissions that lead to titration of ozone.

Figure 10Spatial distribution of springtime daily mean surface ozone over China contributed by anthropogenic emissions of individual regions. The ozone enhancement over China by anthropogenic emissions of each region is determined by the difference between the base case simulation CTL and zero-out simulation without that region's anthropogenic emissions, followed by the linear weighting adjustment.
Figure 10 further shows the contributions to Chinese surface ozone by anthropogenic emissions in seven individual foreign regions. The pattern of influence differs among these source regions due to differences in the location of source region, emission magnitude, pollutant lifetimes, and transport pathways. Anthropogenic emissions in Japan and Korea result in 0.6–2.1 ppb of ozone enhancement along the Chinese coast. The tagged ozone simulation with NAQPMS by J. Li et al. (2016) also showed that about 0.5–3.0 ppb of ozone over northeastern China in spring 2010 was produced over the Korean Peninsula, although there is a difference between ozone produced over a region and ozone produced from that region's emissions. Emissions from Southeast Asia contribute 1–5 ppb over much of the southern provinces. Emissions from South Asia mostly affect southwestern China and Tibet (by up to 5–10 ppb over the border), due to effective transport by strong southwesterly winds associated with the Indian monsoon. The rest of Asia consists of many countries to the west of China, whose total contributions are about 2–5 ppb over much of northwestern China.
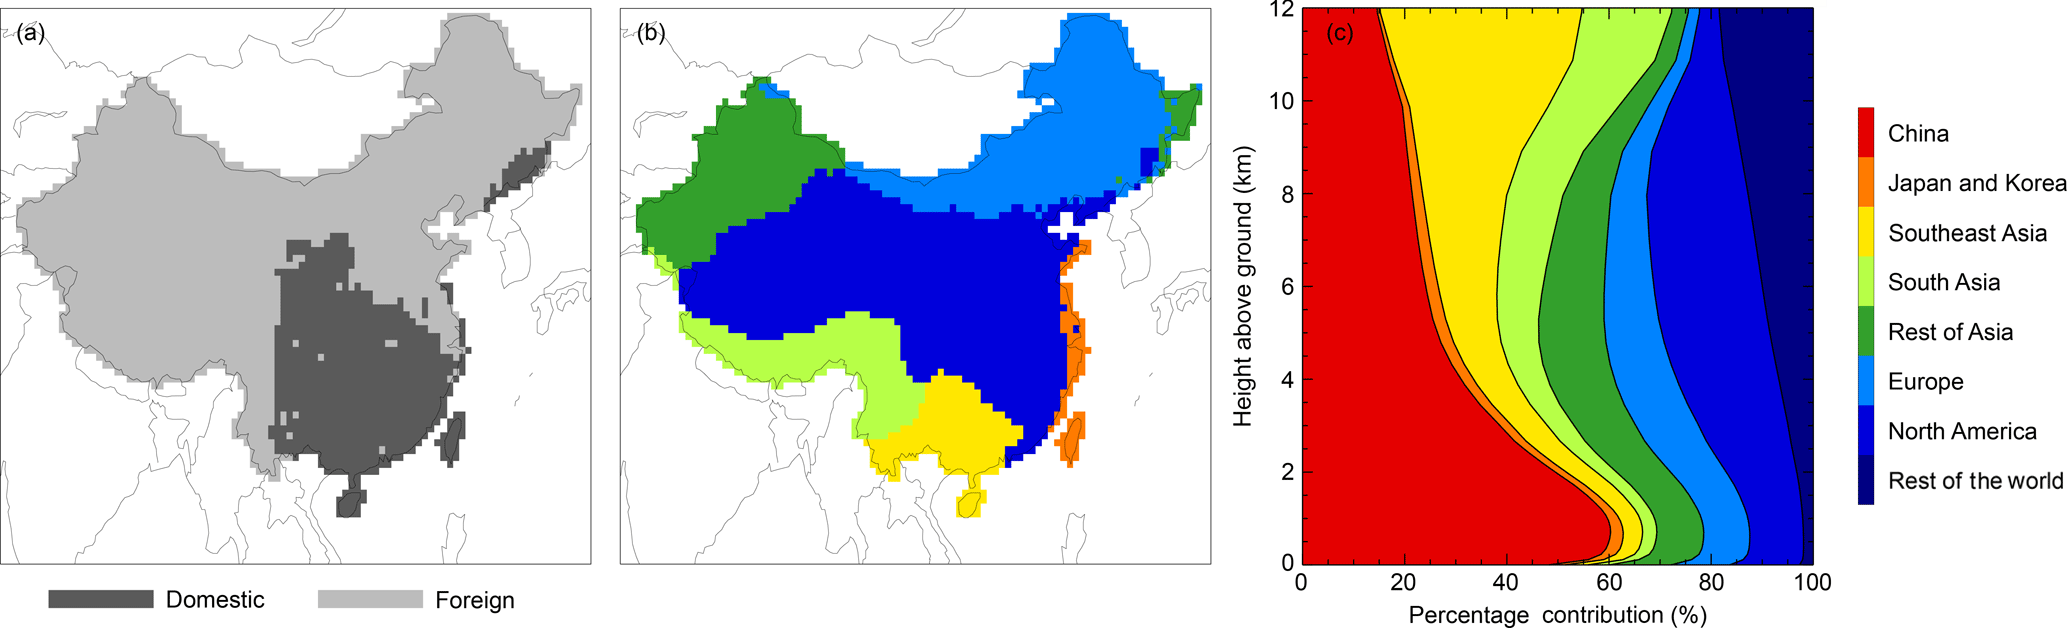
Figure 11(a) Indication of the largest anthropogenic contributor (domestic or foreign) to surface ozone at individual locations of China. (b) Indication of the largest foreign anthropogenic contributor to surface ozone at individual locations of China. (c) Vertical distribution of percentage contribution of each region to total anthropogenic ozone over China.
European anthropogenic emissions contribute 2.1–3.0 ppb of ozone along the northern border of China. The contributions decrease southward and are above 1 ppb over half of Chinese land areas. The Model for Ozone and Related chemical Tracers (MOZART) simulations by Li et al. (2015) also showed a European contribution of 2 ppb to surface ozone over northern China in 2000. North American anthropogenic emissions increase ozone by 1.8–2.7 ppb over much of western China, by 1.5–2.1 ppb over the populous North China Plain, and by less than 0.9 ppb over the south. The contributions are smaller than springtime Asian anthropogenic influences on western North America (e.g., 1–5 ppb averaged over 2001–2005; Brown-Steiner and Hess, 2011b), although the affected population is larger by roughly an order of magnitude.

Figure 12(a–c) Similar to Fig. 9a–c but for springtime daily mean ozone calculated using the 20 % perturbation method. (d–f) Similar to Fig. 9a–c but for the springtime extreme ozone value (defined as the average of the top 5 % hourly ozone concentrations). (g–i) Similar to Fig. 9a–c but for springtime daily mean ozone in 2012. The linear weighting adjustment is applied to derive all results. Note that the color scales are different in each panel.
Influences from the rest of the world are about 0.6–1.2 ppb over Tibet and smaller over other Chinese land territory. The larger values over Tibet reflect its higher altitude and greater sensitivity to long-range transport via the free troposphere.
Figure 11a shows whether domestic or foreign anthropogenic contributions are higher at individual locations. Domestic anthropogenic contributions are higher than foreign contributions over southern China and parts of northern China. However, foreign anthropogenic contributions exceed domestic contributions over western China and most of the north, including the populated North China Plain. Over western China, foreign emissions contribute 70 %–90 % of the total anthropogenic ozone (Fig. 9c).
Figure 11b further highlights the largest foreign contributor to surface anthropogenic ozone at each location of China. North America is the largest foreign contributor over about half of Chinese land territory, including the populated North China Plain. Europe is the largest foreign contributor for the vast northeastern region, the rest of Asia for the western border region, South Asia for southwestern China, Southeast Asia for southern China, and Japan and Korea for the eastern coast of China.
4.3 Discussion of source attribution with an alternative 20 % perturbation method, for extreme ozone and for other years
The HTAP and several other studies have used 20 % perturbation simulations (i.e., reducing anthropogenic emissions in each source region by 20 %) to study the transboundary ozone problem. Such studies are source–receptor analyses that are more relevant to the question of how much a modest cut in foreign emissions would reduce ozone pollution over a targeted receptor region. To compare with such a method, here we ran one more set of full-chemistry simulations by decreasing 20 % anthropogenic emissions over each of the eight emission source regions (similar to the zero-out method in Table 1). We also applied the linear weighting method to account for the nonlinearity of ozone chemistry. Figures 9a and 12a compare the Chinese anthropogenic contributed ozone calculated from zero-out and from 20 % perturbation simulations. Compared to the zero-out method, the 20 % perturbation method leads to less Chinese contributed ozone, with negative values over more regions and smaller positive values over southern China. This result confirms our general finding that in spring 2008, the excessive domestic NOx emissions lead to relatively weak ozone production and/or strong ozone titration. Comparing with the zero-out method, the absolute foreign anthropogenic ozone obtained from 20 % perturbation simulations is smaller by 2–3 ppb over the northern border of China (comparing Figs. 9b and 12b), whereas the percentage of foreign contributions increase from 10 %–20 % to 20 %–40 % over southeastern China (comparing Figs. 9c and 12c). Nonetheless, the spatial patterns are similar between the two methods for both the absolute and the relative foreign contributions.
Table 5Springtime anthropogenic emissions of NOx, CO, and NMVOC in 2008 and 2012 in each source region defined in Fig. 1.
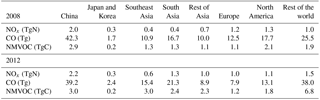
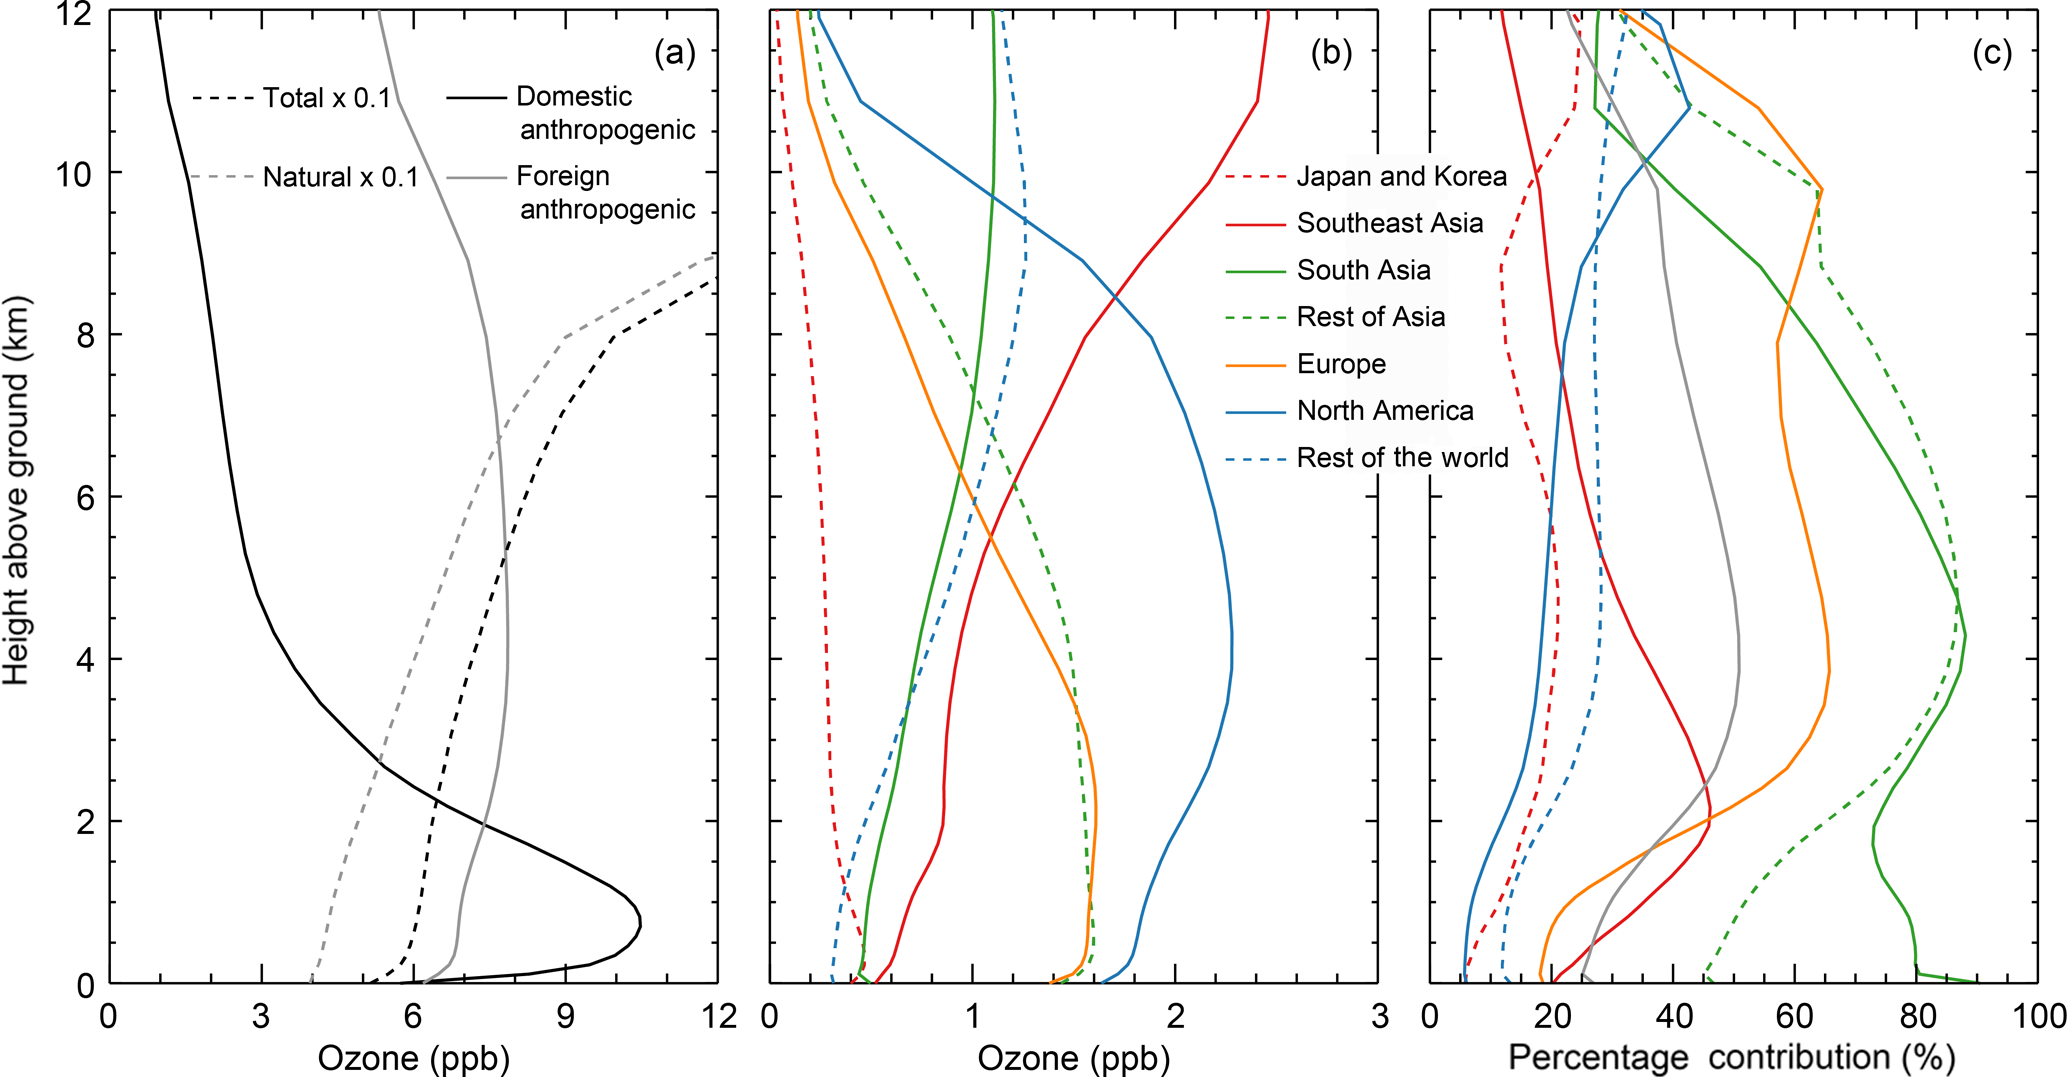
Figure 13(a) Vertical distribution of China average daily mean ozone contributed by domestic anthropogenic emissions, foreign anthropogenic emissions, natural sources (scaled by 0.1), and total sources (scaled by 0.1). (b) Contribution by anthropogenic emissions of each foreign source region. (c) Of the ozone over China due to anthropogenic emissions of each foreign region, the portion produced within each foreign source region's territory was calculated based on a combination of zero-out and tagged simulations. The linear weighting adjustment is applied to derive all results.

Figure 14(a) Vertical distribution of regional average daily mean ozone contributed by domestic anthropogenic emissions, foreign anthropogenic emissions, natural sources (scaled by 0.1), and total sources (scaled by 0.1) over regions where Chinese anthropogenic emissions contribute more surface ozone than total foreign anthropogenic emissions. (c) Contribution by anthropogenic emissions of each foreign source region over regions where Chinese anthropogenic emissions contribute more surface ozone than total foreign anthropogenic emissions. (b, d) Similar to (a, c) but for regional average daily mean ozone over regions where foreign anthropogenic emissions dominate. The linear weighting adjustment is applied to derive all results.
As peak ozone is a critical problem for human health, here we show the domestic versus foreign contributions to modeled extreme ozone values in spring 2008 (defined as the average of the top 5 % hourly ozone concentrations) (Fig. 12d–f). As expected, the Chinese domestic contribution is larger for extreme ozone than for mean ozone; the negative values also disappear over the North China Plain and northeastern China (comparing Figs. 9a and 12d). The absolute foreign contribution (in parts per billion) is also enhanced across China (comparing Figs. 9b and 12e). The percentage foreign contribution is within 10 % over southern China, about 10 %–50 % over the north, and above 70 % over the west. Nevertheless, these results for extreme ozone should be interpreted with more caution, as the model cannot simulate the dates of extreme ozone very well (Fig. 4).
Previous studies have shown notable interannual variability in surface ozone over China driven by changes in precursor emissions and meteorology (Xu et al., 2008; Jin et al., 2015; Wang et al., 2017). To test how the interannual variability in meteorology and emissions would affect our source attribution findings, we have repeated all zero-out runs for spring 2012, the latest year when the GEOS-5 meteorological fields are available. Emissions for 2012 were adopted from the Community Emissions Data System (CEDS) inventory (Hoesly et al., 2018); 2012 is also the latest year the CEDS emissions for China are adjusted by the MEIC inventory. Table 5 shows the anthropogenic emissions in the two years. All zero-out simulation results in 2012 underwent the same linear weighting adjustment as for those in 2008. Figure 12g–i show the results for domestic versus foreign contributed ozone in spring 2012, compared to the results for spring 2008 (Fig. 9a–c). In absolute terms, Chinese contributed ozone is similar between 2008 and 2012 (comparing Figs. 12g and 9a), reflecting the slight changes in domestic precursor emissions (Table 5). From 2008 to 2012, the absolute foreign contributed ozone increased along the southern boarder due to much enhanced emissions in Southeast Asia and South Asia. The absolute foreign contributions decrease over the north and south, reflecting the net effect of changes in European and North American emissions (within 20 % for both NOx and NMVOC), increased emissions in the rest of Asia, and changes in meteorology. In relative terms (Figs. 9c and 12i), the percentage of foreign anthropogenic contributions to total anthropogenic ozone decrease from 2008 to 2012 over southern China. Nonetheless, in both years the percentage of foreign contributions exceeds 50 % over western China and is 5 %–40 % over southern China. Therefore our general finding that both foreign and domestic contributions to Chinese anthropogenic ozone are important holds true for these two years.
Figure 13a shows the domestic and foreign anthropogenic contributions to daily mean ozone at different heights above the ground averaged over China. The black line shows that Chinese emissions contribute 6.0–10.5 ppb of ozone below 2 km over China, with a maximum value at 0.7 km. This average amount of contribution reflects compensation between positive values over most regions and negative values over the North China Plain and many populous cities (see Sect. 4.2). Above 0.7 km, the Chinese contribution decreases rapidly until 3 ppb at 5 km, above which the contribution declines slowly until a value of 1 ppb at 12 km. By comparison, Chinese contribution to Ox is about 7–11 ppb below 2 km, and at higher altitudes the contribution is almost identical to that for ozone (not shown). The small contributions above 2 km for both ozone and Ox are because as ozone and precursors associated with Chinese emissions are lifted to higher altitudes they are transported out of Chinese territory and destroyed gradually.
The grey line in Fig. 13a shows that the total foreign contribution is about 5.2–7.8 ppb at different heights with a reverse “C” shape, i.e., higher values at 3–9 km and lower values above or below that layer. The foreign contribution exceeds the Chinese contribution at all heights above 2 km. Nonetheless, the total (Chinese + foreign) anthropogenic ozone is less than one-third of natural ozone throughout the troposphere. Figure 11c shows that of ozone over China produced from all anthropogenic emissions, foreign emissions together contribute 50 % at the surface, 40 % at 0.7 km as a minimum, and 85 % in the upper troposphere.
Figure 13b specifies the contribution of each foreign emission source region. Figure 13c further separates the portion of ozone produced within each source region's territory from the portion produced outside of that source region; results here were derived from a combination of zero-out simulations (e.g., CTL and xEU) and tagged simulations (e.g., T_CTL and T_xEU). The Southeast Asian contribution is about 0.5–2.5 ppb averaged over China, and it increases with height due to strong upwelling that lifts pollutants to the middle and upper troposphere. The contribution from Japan and Korea is below 0.5 ppb throughout the troposphere averaged over China (Fig. 13b). The share of transboundary ozone produced within the Southeast Asian territory and transported to China is about 10 %–45 % (mostly below 30 %), and the share for ozone produced within Japan and Korea is even smaller (5 %–25 %) (Fig. 13c), highlighting the importance of ozone produced by precursors transported out of these two emission source regions.
South Asian contribution is only about 0.5–1.2 ppb throughout the troposphere (Fig. 13b). Although South Asia has more anthropogenic emissions than Southeast Asia (Table 2), its contribution to ozone over China is smaller due to blocking of transport by the Himalayas with high elevation (Fig. 3). In addition, the share of transboundary ozone produced within South Asian territory reaches 70 %–90 % below 6 km but declines rapidly to 28 % at 12 km (Fig. 13c), a characteristic drastically different from the share for Southeast Asia.
The contribution from the rest of Asia is below 1.8 ppb at all heights with a negative vertical gradient (Fig. 13b). Above 3 km, the portion of transboundary ozone produced within the territory of the rest of Asia is similar to that for South Asia (Fig. 13c). However, the portion exhibits a strong vertical gradient below 3 km, with a minimum value at 45 % near the ground.
The European contribution declines from 1.5 ppb in the lower troposphere to 0.2 ppb at 12 km, similar to that for the rest of Asia (Fig. 13b). In spring, Eurasian frontal activities transport and gradually lift European pollutants to downwind areas. The portion of transboundary ozone produced within European territory is about 55 %–65 % at 3–10 km but is as low as 20 % below 1 km (Fig. 13c), suggesting that most Europe-contributed near-surface ozone over China is produced from precursors transported out of Europe.
Figure 13b shows that North American anthropogenic emissions contribute about 1.5–2.5 ppb of ozone below 8 km, although the contribution declines rapidly to 0.2 ppb at 12 km. Compared to Europe, North America is further away from China, but its pollutants can be transported via the strong midlatitude westerly wind. Averaged over China, the North American contribution is larger than the European contribution at all heights, e.g., by a factor of 2 in the middle and upper troposphere. The higher contribution is due to much more anthropogenic emissions in North America than in Europe. Table 3 shows that North America emits NMVOCs nearly twice as much as Europe does, and Wu et al. (2009) showed that the amount of transboundary ozone is nearly proportional to NMVOC emissions of the source region. In addition, Fig. 13c shows that the portion of transboundary ozone produced within the North American territory is only about 5–20 % below 8 km, reflecting the dominant contribution by ozone produced from transported precursors. The low share of ozone produced within North America is primarily because most of such ozone is destroyed during the transport from North America to China (about 2 weeks), given the tropospheric lifetime of ozone at about 3 weeks (Yan et al., 2016).
The grey line in Fig. 13c shows the average portion of transboundary ozone from all foreign source regions that is produced within the territories of respective foreign regions. The average portion is less than 50 % throughout the troposphere, is about 40 % at 2 km, and is as low as 25 % near the surface. This again highlights the dominant importance of ozone production along with the transport of precursors.
Figure 14 further shows the vertical profiles of ozone from different sources averaged over regions where Chinese anthropogenic emissions contribute more surface ozone than total foreign anthropogenic emissions (i.e., southern China; Fig. 14a, b), as well as averaged over regions where foreign anthropogenic emissions dominate (Fig. 14c, d). Even over areas where domestic contributions to near-surface ozone exceed total foreign contributions, the regional average ozone contributed by foreign emissions exceeds that contributed by domestic emissions above 3.5 km (Fig. 14a). Figure 14b and d further show that the (relative) vertical shape of regional average ozone contributed by each foreign source region is similar to the averaged China results in Fig. 13b, although the absolute values (in parts per billion) are different.
This study uses a GEOS-Chem-based two-way coupled modeling system to simulate Chinese and foreign anthropogenic contributions to springtime ozone at different heights over China. Anthropogenic contributions are associated with anthropogenic NOx, CO, and NMVOC emissions, excluding the effect of methane. We combine the zero-out simulations and tagged ozone simulations to separate the transboundary ozone produced within the territory of each emission source region from the ozone produced by anthropogenic precursors transported out of that source region. We use a weighting approach to accounting for the effect of nonlinear ozone chemistry on source attribution estimates. Model evaluation using a suite of ground, aircraft, and ozonesonde measurements show an overall small bias for ozone near the surface and in the troposphere (10 % at 10 surface sites with hourly measurements, 15 % at 21 surface sites with monthly observations, and 12 % for vertical profiles). The model underestimates CO by 20 % on average over China and nearby areas, which however does not affect the simulated ozone significantly.
Model simulations reveal that both total and natural ozone near the surface over China show a decreasing gradient from the southern Tibetan Plateau to the northwest and the east. Natural ozone contributes 80 %–90 % of total surface ozone over Tibet and the northwest with low local anthropogenic emissions. Chinese anthropogenic emissions enhance surface ozone concentrations by 0–4 ppb over most of the west and northeast due to low emissions and by 16–25 ppb over the south due to more emissions and chemically conducive conditions. Chinese anthropogenic emissions result in reduced ozone, albeit with enhanced Ox, over the North China Plain and many populous cities, as a result of weak ozone production efficiency and strong titration by excessive Chinese NOx emissions.
Near the surface, foreign anthropogenic emissions contribute 2–11 ppb of Chinese ozone, with peak contributions at 7–11 ppb over the border and coastal regions of China. Over western and northeastern China, foreign emissions account for up to 90 % of ozone of anthropogenic origin. Anthropogenic emissions in Japan and Korea result in 0.6–2.1 ppb of ozone along the Chinese coast. Emissions in Southeast Asia contribute 1–5 ppb over much of southeastern China. South Asian emissions mostly affect southwestern China and Tibet (by up to 5 ppb) due to effective transport by strong southwesterly winds associated with the Indian monsoon. European anthropogenic emissions contribute 2.1–3 ppb along the northern border of China and the contribution decreases southwards. North American anthropogenic emissions increase ozone by 1.8–2.7 ppb over much of the west, by 1.5–2.1 ppb over the populous North China Plain, and by less than 0.9 ppb over the south.
Vertically, for ozone of anthropogenic origin averaged over China, Chinese emissions contribute ∼6 ppb (50 %) of ozone at the surface and 6.0–10.5 ppb below 2 km, decreasing to 3 ppb at 5 km and 1 ppb at 12 km. The total foreign contribution increases from 40 %–50 % below 2 km to 50 %–85 % above that height. The contribution from Japan and Korea is below 0.5 ppb throughout the troposphere averaged over China. Despite its large emissions, South Asia contributes only about 0.5–1.2 ppb throughout the troposphere due to blocking of transport by the Himalayas. The Southeast Asian contribution increases with height due to strong upwelling that lifts pollutants to the upper troposphere. Conversely, European contributions decrease from 1.5 ppb in the lower troposphere to 0.2 ppb at 12 km. Despite the long transport distance, the North American contribution reaches as much as 1.5–2.5 ppb below 8 km due to its large anthropogenic emissions and the strong midlatitude westerly wind favorable for transboundary transport.
For ozone of foreign anthropogenic origin averaged over China, the portion of transboundary ozone produced within foreign source regions is less than 50 % throughout the troposphere, albeit with a strong vertical variability, indicating the importance of ozone produced by precursors transported out of those source regions. The portion also differs among each foreign source region of Southeast Asia (10 %–45 %), Japan and Korea (5 %–25 %), South Asia (from 70 %–90 % below 6 km to 28 % at 12 km), Europe (from 20 % below 1 km to 55 %–65 % at 3–10 km), and North America (5 %–20 % below 8 km). Thus, tracing ozone produced within the territory of a particular region is drastically different from tracing ozone associated with emissions in that region.
In summary, although China is a major pollutant emitter, the ozone above its territory consists primarily of natural sources, especially over western China with low local anthropogenic emissions. Moreover, for ozone of anthropogenic origin, a large portion results from foreign emissions, as analyzed here for spring 2008. In more recent years, Chinese anthropogenic NOx emissions have undergone a rapid decline as a result of domestic emission control (Xia et al., 2016), along with continuous reductions in North America and western Europe (Yan et al., 2018a, b) and changes in other regions. Future research is needed to quantify the resulting changes in ozone and its geographical origin. In addition, this study does not account for the fact that a substantial portion of anthropogenic emissions in any region are associated with economic production for foreign consumption (Lin et al., 2014; X. Jiang et al., 2015), which would affect how pollution is attributed to individual producing or consuming regions (Guan et al., 2014; Lin et al., 2016; Zhang et al., 2017). Nevertheless, our study suggests the great importance of global collaboration on emission reduction to mitigate ozone pollution in addition to domestic emission control efforts.
Observation data are obtained from individual sources (see links in the text and acknowledgments). Model results are available upon request.
RN and JL conceived and designed the research. RN performed the data processing, model simulations, and analyses. YY assisted in the two-way model simulations. WL provided the observation data over China. RN and JL wrote the paper with input from all authors.
The authors declare that they have no conflict of interest.
This article is part of the special issue“Regional transport and transformation of air pollution in eastern China”. It is not associated with a conference.
This research is supported by the National Natural Science Foundation of
China (41775115) and the 973 program (2014CB441303). We acknowledge Chen
Hongbin's team at IAP LAGEO for providing the GPSO3 ozonesonde data. We
acknowledge the free use of ozone data from WDCGG
(http://ds.data.jma.go.jp/gmd/wdcgg/), EANET
(http://www.eanet.asia/product/index.html), WOUDC
(http://www.woudc.org/data/explore.php?lang=en), and MOZAIC-IAGOS
(http://www.iagos.fr, last access: 21 October 2017). We thank the European Commission for the support
to the MOZAIC project (1994–2003) and the preparatory phase of IAGOS
(2005–2012) partner institutions of the IAGOS Research Infrastructure (FZJ,
DLR, MPI, and KIT in Germany; CNRS, CNES, and Météo-France in France; and
the University of Manchester in the United Kingdom), ETHER (CNES-CNRS/INSU) for
hosting the database, and the participating airlines (Lufthansa, Air France,
Austrian, China Airlines, Iberia, Cathay Pacific) for the transport of the instrumentation free of
charge.
Edited by: Jason West
Reviewed by: two anonymous referees
Auvray, M. and Bey, I.: Long-range transport to Europe: Seasonal variations and implications for the European ozone budget, J. Geophys. Res.-Atmos., 110, D11303, https://doi.org/10.1029/2004jd005503, 2005.
Bian, J. C., Gettelman, A., Chen, H. B., and Pan, L. L.: Validation of satellite ozone profile retrievals using Beijing ozonesonde data, J. Geophys. Res.-Atmos., 112, D06305, https://doi.org/10.1029/2006jd007502, 2007.
Bond, T. C., Bhardwaj, E., Dong, R., Jogani, R., Jung, S., Roden, C., Streets, D. G., and Trautmann, N. M.: Historical emissions of black and organic carbon aerosol from energy-related combustion, 1850–2000, Global Biogeochem. Cy., 21, GB2018, https://doi.org/10.1029/2006GB002840, 2007.
Brown-Steiner, B. and Hess, P.: Asian influence on surface ozone in the United States: A comparison of chemistry, seasonality, and transport mechanisms, J. Geophys. Res.-Atmos., 116, D17309, https://doi.org/10.1029/2011jd015846, 2011.
Cooper, O. R., Parrish, D. D., Stohl, A., Trainer, M., Nedelec, P., Thouret, V., Cammas, J. P., Oltmans, S. J., Johnson, B. J., Tarasick, D., Leblanc, T., McDermid, I. S., Jaffe, D., Gao, R., Stith, J., Ryerson, T., Aikin, K., Campos, T., Weinheimer, A., and Avery, M. A.: Increasing springtime ozone mixing ratios in the free troposphere over western North America, Nature, 463, 344–348, https://doi.org/10.1038/nature08708, 2010.
Derwent, R. G., Stevenson, D. S., Collins, W. J., and Johnson, C. E.: Intercontinental transport and the origins of the ozone observed at surface sites in Europe, Atmos. Environ.t, 38, 1891–1901, https://doi.org/10.1016/j.atmosenv.2004.01.008, 2004.
Ding, A. J. and Wang, T.: Influence of stratosphere-to-troposphere exchange on the seasonal cycle of surface ozone at Mount Waliguan in western China, Geophys. Res. Lett., 33, L03803, https://doi.org/10.1029/2005gl024760, 2006.
Fang, S. X., Zhou, L. X., Tans, P. P., Ciais, P., Steinbacher, M., Xu, L., and Luan, T.: In situ measurement of atmospheric CO2 at the four WMO/GAW stations in China, Atmos. Chem. Phys., 14, 2541–2554, https://doi.org/10.5194/acp-14-2541-2014, 2014.
Geng, G., Zhang, Q., Martin, R. V., Lin, J., Huo, H., Zheng, B., Wang, S., and He, K.: Impact of spatial proxies on the representation of bottom-up emission inventories: A satellite-based analysis, Atmos. Chem. Phys., 17, 4131-4145, https://doi.org/10.5194/acp-17-4131-2017, 2017.
Guan, D., Su, X., Zhang, Q., Peters, G. P., Liu, Z., Lei, Y., and He, K.: The socioeconomic drivers of China's primary PM2.5 emissions, Environ. Res. Lett., 9, 024010, https://doi.org/10.1088/1748-9326/9/2/024010, 2014.
Guenther, A. B., Jiang, X., Heald, C. L., Sakulyanontvittaya, T., Duhl, T., Emmons, L. K., and Wang, X.: The Model of Emissions of Gases and Aerosols from Nature version 2.1 (MEGAN2.1): an extended and updated framework for modeling biogenic emissions, Geosci. Model Dev., 5, 1471–1492, https://doi.org/10.5194/gmd-5-1471-2012, 2012.
Hoesly, R. M., Smith, S. J., Feng, L., Klimont, Z., Janssens-Maenhout, G., Pitkanen, T., Seibert, J. J., Vu, L., Andres, R. J., Bolt, R. M., Bond, T. C., Dawidowski, L., Kholod, N., Kurokawa, J.-I., Li, M., Liu, L., Lu, Z., Moura, M. C. P., O'Rourke, P. R., and Zhang, Q.: Historical (1750–2014) anthropogenic emissions of reactive gases and aerosols from the Community Emissions Data System (CEDS), Geosci. Model Dev., 11, 369–408, https://doi.org/10.5194/gmd-11-369-2018, 2018.
Holtslag, A. A. M. and Boville, B. A.: Local versus nonlocal boundary-layer diffusion in a global climate model, J. Climate, 6, 1825–1842, https://doi.org/10.1175/1520-0442(1993)006<1825:lvnbld>2.0.co;2, 1993.
HTAP: Hemispheric Transport of Air Pollution 2010 Executive Summary ECE/EB.AIR/2010/10 Corrected, United Nations, available at: http://www.htap.org/publications/2010_report/2010_Final_Report/EBMeeting2010.pdf (last access: 1 February 2015), 2010.
Hudman, R. C., Moore, N. E., Mebust, A. K., Martin, R. V., Russell, A. R., Valin, L. C., and Cohen, R. C.: Steps towards a mechanistic model of global soil nitric oxide emissions: implementation and space based-constraints, Atmos. Chem. Phys., 12, 7779–7795, https://doi.org/10.5194/acp-12-7779-2012, 2012.
Jacob, D. J., Logan, J. A., and Murti, P. P.: Effect of rising Asian emissions on surface ozone in the United States, Geophys. Res. Lett., 26, 2175–2178, https://doi.org/10.1029/1999gl900450, 1999.
Jiang, X., Zhang, Q., Zhao, H., Geng, G., Peng, L., Guan, D., Kan, H., Huo, H., Lin, J.-T., Brauer, M., Martin, R. V., and He, K.: Revealing the hidden health costs embodied in Chinese exports, Environ. Sci. Technol., 49, 4381–4388, https://doi.org/10.1021/es506121s, 2015.
Jiang, Z., Worden, J. R., Jones, D. B. A., Lin, J.-T., Verstraeten, W. W., and Henze, D. K.: Constraints on Asian ozone using Aura TES, OMI and Terra MOPITT, Atmos. Chem. Phys., 15, 99–112, https://doi.org/10.5194/acp-15-99-2015, 2015.
Jiang, Z., Worden, J. R., Payne, V. H., Zhu, L. Y., Fischer, E., Walker, T., and Jones, D. B. A.: Ozone export from East Asia: The role of PAN, J. Geophys. Res.-Atmos., 121, 6555–6563, https://doi.org/10.1002/2016jd024952, 2016.
Jin, X. and Holloway, T.: Spatial and temporal variability of ozone sensitivity over China observed from the Ozone Monitoring Instrument, J. Geophys. Res.-Atmos., 120, 7229–7246, https://doi.org/10.1002/2015JD023250, 2015.
Kopacz, M., Jacob, D. J., Fisher, J. A., Logan, J. A., Zhang, L., Megretskaia, I. A., Yantosca, R. M., Singh, K., Henze, D. K., Burrows, J. P., Buchwitz, M., Khlystova, I., McMillan, W. W., Gille, J. C., Edwards, D. P., Eldering, A., Thouret, V., and Nedelec, P.: Global estimates of CO sources with high resolution by adjoint inversion of multiple satellite datasets (MOPITT, AIRS, SCIAMACHY, TES), Atmos. Chem. Phys., 10, 855–876, https://doi.org/10.5194/acp-10-855-2010, 2010.
Kuhns, H., Knipping, E. M., and Vukovich, J. M.: Development of a United States-Mexico emissions inventory for the Big Bend Regional Aerosol and Visibility Observational (BRAVO) Study, JAPCA J. Air Waste Ma., 55, 677–692, 2005.
Li, B. G., Gasser, T., Ciais, P., Piao, S. L., Tao, S., Balkanski, Y., Hauglustaine, D., Boisier, J. P., Chen, Z., Huang, M. T., Li, L. Z., Li, Y., Liu, H. Y., Liu, J. F., Peng, S. S., Shen, Z. H., Sun, Z. Z., Wang, R., Wang, T., Yin, G. D., Yin, Y., Zeng, H., Zeng, Z. Z., and Zhou, F.: The contribution of China's emissions to global climate forcing, Nature, 531, 357–361, https://doi.org/10.1038/nature17165, 2016.
Li, J., Yang, W. Y., Wang, Z. F., Chen, H. S., Hu, B., Li, J. J., Sun, Y. L., Fu, P. Q., and Zhang, Y. Q.: Modeling study of surface ozone source-receptor relationships in East Asia, Atmos. Res., 167, 77-88, https://doi.org/10.1016/j.atmosres.2015.07.010, 2016.
Li, M., Zhang, Q., Kurokawa, J.-I., Woo, J.-H., He, K., Lu, Z., Ohara, T., Song, Y., Streets, D. G., Carmichael, G. R., Cheng, Y., Hong, C., Huo, H., Jiang, X., Kang, S., Liu, F., Su, H., and Zheng, B.: MIX: a mosaic Asian anthropogenic emission inventory under the international collaboration framework of the MICS-Asia and HTAP, Atmos. Chem. Phys., 17, 935–963, https://doi.org/10.5194/acp-17-935-2017, 2017.
Li, X. Y., Liu, J. F., Mauzerall, D. L., Emmons, L. K., Walters, S., Horowitz, L. W., and Tao, S.: Effects of trans-Eurasian transport of air pollutants on surface ozone concentrations over Western China, J. Geophys. Res.-Atmos., 119, 12338–12354, https://doi.org/10.1002/2014jd021936, 2014.
Liang, Q., Jaegle, L., Jaffe, D. A., Weiss-Penzias, P., Heckman, A., and Snow, J. A.: Long-range transport of Asian pollution to the northeast Pacific: Seasonal variations and transport pathways of carbon monoxide, J. Geophys. Res.-Atmos., 109, D23S07, https://doi.org/10.1029/2003jd004402, 2004.
Lin, J. T. and McElroy, M. B.: Impacts of boundary layer mixing on pollutant vertical profiles in the lower troposphere: Implications to satellite remote sensing, Atmos. Environ., 44, 1726–1739, https://doi.org/10.1016/j.atmosenv.2010.02.009, 2010.
Lin, J.-T., Wuebbles, D. J., and Liang, X.-Z.: Effects of intercontinental transport on surface ozone over the United States: Present and future assessment with a global model, Geophys. Res. Lett., 35, L02805, https://doi.org/10.1029/2007gl031415, 2008.
Lin, J.-T., Liu, Z., Zhang, Q., Liu, H., Mao, J., and Zhuang, G.: Modeling uncertainties for tropospheric nitrogen dioxide columns affecting satellite-based inverse modeling of nitrogen oxides emissions, Atmos. Chem. Phys., 12, 12255–12275, https://doi.org/10.5194/acp-12-12255-2012, 2012.
Lin, J.-T., Pan, D., Davis, S. J., Zhang, Q., He, K., Wang, C., Streets, D. G., Wuebbles, D. J., and Guan, D.: China's international trade and air pollution in the United States, P. Natl. Acad. Sci., 111, 1736–1741, https://doi.org/10.1073/pnas.1312860111, 2014.
Lin, J. T., Tong, D., Davis, S., Ni, R. J., Tan, X. X., Pan, D., Zhao, H. Y., Lu, Z. F., Streets, D., Feng, T., Zhang, Q., Yan, Y. Y., Hu, Y. Y., Li, J., Liu, Z., Jiang, X. J., Geng, G. N., He, K. B., Huang, Y., and Guan, D. B.: Global climate forcing of aerosols embodied in international trade, Nat. Geosci., 9, 790–794, https://doi.org/10.1038/ngeo2798, 2016.
Lin, M., Fiore, A. M., Horowitz, L. W., Cooper, O. R., Naik, V., Holloway, J., Johnson, B. J., Middlebrook, A. M., Oltmans, S. J., Pollack, I. B., Ryerson, T. B., Warner, J. X., Wiedinmyer, C., Wilson, J., and Wyman, B.: Transport of Asian ozone pollution into surface air over the western United States in spring, J. Geophys. Res.-Atmos., 117, D00v07, https://doi.org/10.1029/2011jd016961, 2012.
Lin, W., Xu, X., Zheng, X., Dawa, J., Baima, C., and Ma, J.: Two-year measurements of surface ozone at Dangxiong, a remote highland site in the Tibetan Plateau, Journal of Environmental Sciences, 31, 133-145, https://doi.org/10.1016/j.jes.2014.10.022, 2015.
Lin, W. L., Xu, X. B., Ge, B. Z., and Zhang, X. C.: Characteristics of gaseous pollutants at Gucheng, a rural site southwest of Beijing, J. Geophys. Res.-Atmos., 114, D00G14, https://doi.org/10.1029/2008jd010339, 2009.
Liu, Z., Wang, Y. H., Gu, D. S., Zhao, C., Huey, L. G., Stickel, R., Liao, J., Shao, M., Zhu, T., Zeng, L. M., Liu, S. C., Chang, C. C., Amoroso, A., and Costabile, F.: Evidence of Reactive Aromatics As a Major Source of Peroxy Acetyl Nitrate over China, Environ. Sci. Technol., 44, 7017–7022, https://doi.org/10.1021/es1007966, 2010.
Ma, J., Lin, W. L., Zheng, X. D., Xu, X. B., Li, Z., and Yang, L. L.: Influence of air mass downward transport on the variability of surface ozone at Xianggelila Regional Atmosphere Background Station, southwest China, Atmos. Chem. Phys., 14, 5311–5325, https://doi.org/10.5194/acp-14-5311-2014, 2014.
Mao, J. Q., Paulot, F., Jacob, D. J., Cohen, R. C., Crounse, J. D., Wennberg, P. O., Keller, C. A., Hudman, R. C., Barkley, M. P., and Horowitz, L. W.: Ozone and organic nitrates over the eastern United States: Sensitivity to isoprene chemistry, J. Geophys. Res.-Atmos., 118, 11256–11268, https://doi.org/10.1002/jgrd.50817, 2013.
Marenco, A., Thouret, V., Nedelec, P., Smit, H., Helten, M., Kley, D., Karcher, F., Simon, P., Law, K., Pyle, J., Poschmann, G., Von Wrede, R., Hume, C., and Cook, T.: Measurement of ozone and water vapor by Airbus in-service aircraft: The MOZAIC airborne program, An overview, J. Geophys. Res.-Atmos., 103, 25631–25642, https://doi.org/10.1029/98jd00977, 1998.
McLinden, C. A., Olsen, S. C., Hannegan, B., Wild, O., Prather, M. J., and Sundet, J.: Stratospheric ozone in 3-D models: A simple chemistry and the cross-tropopause flux, J. Geophys. Res.-Atmos., 105, 14653–14665, https://doi.org/10.1029/2000jd900124, 2000.
Moorthi, S. and Suarez, M. J.: Relaxed Arakawa-Schubert. A Parameterization of Moist Convection for General Circulation Models, Mon. Weather Rev., 120, 978–1002, 1992.
Murray, L. T., Jacob, D. J., Logan, J. A., Hudman, R. C., and Koshak, W. J.: Optimized regional and interannual variability of lightning in a global chemical transport model constrained by LIS/OTD satellite data, J. Geophys. Res.-Atmos., 117, D20307, https://doi.org/10.1029/2012jd017934, 2012.
Ott, L. E., Pickering, K. E., Stenchikov, G. L., Allen, D. J., DeCaria, A. J., Ridley, B., Lin, R. F., Lang, S., and Tao, W. K.: Production of lightning NOx and its vertical distribution calculated from three-dimensional cloud-scale chemical transport model simulations, J. Geophys. Res.-Atmos., 115, D04301, https://doi.org/10.1029/2009jd011880, 2010.
Simone, N. W., Stettler, M. E. J., and Barrett, S. R. H.: Rapid estimation of global civil aviation emissions with uncertainty quantification, Transport. Res. D-Tr. E., 25, 33–41, https://doi.org/10.1016/j.trd.2013.07.001, 2013.
Tu, J., Xia, Z., Wang, H., and Li, W.: Temporal variations in surface ozone and its precursors and meteorological effects at an urban site in China, Atmos. Res. 85, 310–337, https://doi.org/10.1016/j.atmosres.2007.02.003, 2007 .
van der Werf, G. R., Randerson, J. T., Giglio, L., Collatz, G. J., Mu, M., Kasibhatla, P. S., Morton, D. C., DeFries, R. S., Jin, Y., and van Leeuwen, T. T.: Global fire emissions and the contribution of deforestation, savanna, forest, agricultural, and peat fires (1997–2009), Atmos. Chem. Phys., 10, 11707–11735, https://doi.org/10.5194/acp-10-11707-2010, 2010.
Verstraeten, W. W., Neu, J. L., Williams, J. E., Bowman, K. W., Worden, J. R., and Boersma, K. F.: Rapid increases in tropospheric ozone production and export from China, Nat. Geosci., 9, 643–643, https://doi.org/10.1038/ngeo2768, 2016.
Wang, C., Corbett, J. J., and Firestone, J.: Improving Spatial representation of Global Ship Emissions Inventories, Environ. Sci. Technol., 42, 193–199, https://doi.org/10.1021/es0700799, 2008.
Wang, T., Ding, A. J., Gao, J., and Wu, W. S.: Strong ozone production in urban plumes from Beijing, China, Geophys. Res. Lett., 33, L21806, https://doi.org/10.1029/2006gl027689, 2006.
Wang, W., Cheng, T., Gu, X., Chen, H., Guo, H., Wang, Y., Bao, F., Shi, S., Xu, B., Zuo, X., Meng, C., and Zhang, X.: Assessing spatial and temporal patterns of observed ground-level ozone in China, Sci. Rep., 7, 3651, https://doi.org/10.1038/s41598-017-03929-w, 2017.
Wang, Y., Zhang, Y., Hao, J., and Luo, M.: Seasonal and spatial variability of surface ozone over China: contributions from background and domestic pollution, Atmos. Chem. Phys., 11, 3511–3525, https://doi.org/10.5194/acp-11-3511-2011, 2011.
Wang, Y., Konopka, P., Liu, Y., Chen, H., Müller, R., Plöger, F., Riese, M., Cai, Z., and Lü, D.: Tropospheric ozone trend over Beijing from 2002–2010: ozonesonde measurements and modeling analysis, Atmos. Chem. Phys., 12, 8389–8399, https://doi.org/10.5194/acp-12-8389-2012, 2012.
Wang, Y. H., Jacob, D. J., and Logan, J. A.: Global simulation of tropospheric O-3-NOx-hydrocarbon chemistry 1. Model formulation, J. Geophys. Res.-Atmos., 103, 10713–10725, https://doi.org/10.1029/98jd00158, 1998.
Wu, R. R., Bo, Y., Li, J., Li, L. Y., Li, Y. Q., and Xie, S. D.: Method to establish the emission inventory of anthropogenic volatile organic compounds in China and its application in the period 2008–2012, Atmos. Environ., 127, 244-254, https://doi.org/10.1016/j.atmosenv.2015.12.015, 2016.
Wu, S. L., Duncan, B. N., Jacob, D. J., Fiore, A. M., and Wild, O.: Chemical nonlinearities in relating intercontinental ozone pollution to anthropogenic emissions, Geophys. Res. Lett., 36, L21806, https://doi.org/10.1029/2008gl036607, 2009.
Xia, Y. M., Zhao, Y., and Nielsen, C. P.: Benefits of of China's efforts in gaseous pollutant control indicated by the bottom-up emissions and satellite observations 2000–2014, Atmos. Environ., 136, 43–53, https://doi.org/10.1016/j.atmosenv.2016.04.013, 2016.
Xu, W., Lin, W., Xu, X., Tang, J., Huang, J., Wu, H., and Zhang, X.: Long-term trends of surface ozone and its influencing factors at the Mt Waliguan GAW station, China – Part 1: Overall trends and characteristics, Atmos. Chem. Phys., 16, 6191–6205, https://doi.org/10.5194/acp-16-6191-2016, 2016.
Xu, X., Lin, W., Wang, T., Yan, P., Tang, J., Meng, Z., and Wang, Y.: Long-term trend of surface ozone at a regional background station in eastern China 1991–2006: enhanced variability, Atmos. Chem. Phys., 8, 2595–2607, https://doi.org/10.5194/acp-8-2595-2008, 2008.
Xue, L. K., Wang, T., Zhang, J. M., Zhang, X. C., Deliger, Poon, C. N., Ding, A. J., Zhou, X. H., Wu, W. S., Tang, J., Zhang, Q. Z., and Wang, W. X.: Source of surface ozone and reactive nitrogen speciation at Mount Waliguan in western China: New insights from the 2006 summer study, J. Geophys. Res.-Atmos., 116, D07306, https://doi.org/10.1029/2010JD014735, 2011.
Xue, L. K., Wang, T., Gao, J., Ding, A. J., Zhou, X. H., Blake, D. R., Wang, X. F., Saunders, S. M., Fan, S. J., Zuo, H. C., Zhang, Q. Z., and Wang, W. X.: Ground-level ozone in four Chinese cities: precursors, regional transport and heterogeneous processes, Atmos. Chem. Phys., 14, 13175–13188, https://doi.org/10.5194/acp-14-13175-2014, 2014.
Yan, Y., Lin, J., Chen, J., and Hu, L.: Improved simulation of tropospheric ozone by a global-multi-regional two-way coupling model system, Atmos. Chem. Phys., 16, 2381–2400, https://doi.org/10.5194/acp-16-2381-2016, 2016.
Yan, Y., Lin, J., and He, C.: Ozone trends over the United States at different times of day, Atmos. Chem. Phys., 18, 1185–1202, https://doi.org/10.5194/acp-18-1185-2018, 2018a.
Yan, Y., Pozzer, A., Ojha, N., Lin, J., and Lelieveld, J.: Analysis of European ozone trends in the period 1995–2014, Atmos. Chem. Phys., 18, 5589–5605, https://doi.org/10.5194/acp-18-5589-2018, 2018b.
Yan, Y.-Y., Lin, J.-T., Kuang, Y., Yang, D., and Zhang, L.: Tropospheric carbon monoxide over the Pacific during HIPPO: two-way coupled simulation of GEOS-Chem and its multiple nested models, Atmos. Chem. Phys., 14, 12649–12663, https://doi.org/10.5194/acp-14-12649-2014, 2014.
Yin, X., Kang, S., de Foy, B., Cong, Z., Luo, J., Zhang, L., Ma, Y., Zhang, G., Rupakheti, D., and Zhang, Q.: Surface ozone at Nam Co in the inland Tibetan Plateau: variation, synthesis comparison and regional representativeness, Atmos. Chem. Phys., 17, 11293–11311, https://doi.org/10.5194/acp-17-11293-2017, 2017.
Young, P. J., Archibald, A. T., Bowman, K. W., Lamarque, J.-F., Naik, V., Stevenson, D. S., Tilmes, S., Voulgarakis, A., Wild, O., Bergmann, D., Cameron-Smith, P., Cionni, I., Collins, W. J., Dalsøren, S. B., Doherty, R. M., Eyring, V., Faluvegi, G., Horowitz, L. W., Josse, B., Lee, Y. H., MacKenzie, I. A., Nagashima, T., Plummer, D. A., Righi, M., Rumbold, S. T., Skeie, R. B., Shindell, D. T., Strode, S. A., Sudo, K., Szopa, S., and Zeng, G.: Pre-industrial to end 21st century projections of tropospheric ozone from the Atmospheric Chemistry and Climate Model Intercomparison Project (ACCMIP), Atmos. Chem. Phys., 13, 2063–2090, https://doi.org/10.5194/acp-13-2063-2013, 2013.
Zhang, L., Jacob, D. J., Boersma, K. F., Jaffe, D. A., Olson, J. R., Bowman, K. W., Worden, J. R., Thompson, A. M., Avery, M. A., Cohen, R. C., Dibb, J. E., Flock, F. M., Fuelberg, H. E., Huey, L. G., McMillan, W. W., Singh, H. B., and Weinheimer, A. J.: Transpacific transport of ozone pollution and the effect of recent Asian emission increases on air quality in North America: an integrated analysis using satellite, aircraft, ozonesonde, and surface observations, Atmos. Chem. Phys., 8, 6117–6136, https://doi.org/10.5194/acp-8-6117-2008, 2008.
Zhang, Q., Streets, D. G., Carmichael, G. R., He, K. B., Huo, H., Kannari, A., Klimont, Z., Park, I. S., Reddy, S., Fu, J. S., Chen, D., Duan, L., Lei, Y., Wang, L. T., and Yao, Z. L.: Asian emissions in 2006 for the NASA INTEX-B mission, Atmos. Chem. Phys., 9, 5131–5153, https://doi.org/10.5194/acp-9-5131-2009, 2009.
Zhang, Q., Jiang, X. J., Tong, D., Davis, S. J., Zhao, H. Y., Geng, G. N., Feng, T., Zheng, B., Lu, Z. F., Streets, D. G., Ni, R. J., Brauer, M., van Donkelaar, A., Martin, R. V., Huo, H., Liu, Z., Pan, D., Kan, H. D., Yan, Y. Y., Lin, J. T., He, K. B., and Guan, D. B.: Transboundary health impacts of transported global air pollution and international trade, Nature, 543, 705–709, https://doi.org/10.1038/nature21712, 2017.
Zhao, B., Wang, S. X., Liu, H., Xu, J. Y., Fu, K., Klimont, Z., Hao, J. M., He, K. B., Cofala, J., and Amann, M.: NOx emissions in China: historical trends and future perspectives, Atmos. Chem. Phys., 13, 9869–9897, https://doi.org/10.5194/acp-13-9869-2013, 2013.
Zhu, B., Hou, X. W., and Kang, H. Q.: Analysis of the seasonal ozone budget and the impact of the summer monsoon on the northeastern Qinghai-Tibetan Plateau, J. Geophys. Res.-Atmos., 121, 2029–2042, https://doi.org/10.1002/2015jd023857, 2016.
- Abstract
- Introduction
- Model simulations, measurements, and source attribution method
- Model evaluation
- Source attribution modeling for surface ozone over China
- Vertical distributions of domestic and foreign anthropogenic contributions
- Conclusions
- Data availability
- Author contributions
- Competing interests
- Special issue statement
- Acknowledgements
- References