the Creative Commons Attribution 4.0 License.
the Creative Commons Attribution 4.0 License.
 | 14 Aug 2018
Spatial and seasonal variations of aerosols over China from two decades of multi-satellite observations – Part 1: ATSR (1995–2011) and MODIS C6.1 (2000–2017)
Larisa Sogacheva
Gerrit de Leeuw
Edith Rodriguez
Pekka Kolmonen
Aristeidis K. Georgoulias
Georgia Alexandri
Konstantinos Kourtidis
Emmanouil Proestakis
Eleni Marinou
Vassilis Amiridis
Ronald J. van der A
Aerosol optical depth (AOD) patterns and interannual and seasonal variations over China are discussed based on the AOD retrieved from the Along-Track Scanning Radiometer (ATSR-2, 1995–2002), the Advanced ATSR (AATSR, 2002–2012) (together ATSR) and the MODerate resolution Imaging Spectroradiometer (MODIS) aboard the Terra satellite (2000–2017). The AOD products used were the ATSR Dual View (ADV) v2.31 AOD and the MODIS/Terra Collection 6.1 (C6.1) merged dark target (DT) and deep blue (DB) AOD product. Together these datasets provide an AOD time series for 23 years, from 1995 to 2017. The difference between the AOD values retrieved from ATSR-2 and AATSR is small, as shown by pixel-by-pixel and monthly aggregate comparisons as well as validation results. This allows for the combination of the ATSR-2 and AATSR AOD time series into one dataset without offset correction.
ADV and MODIS AOD validation results show similar high correlations with the Aerosol Robotic Network (AERONET) AOD (0.88 and 0.92, respectively), while the corresponding bias is positive for MODIS (0.06) and negative for ADV (−0.07). Validation of the AOD products in similar conditions, when ATSR and MODIS/Terra overpasses are within 90 min of each other and when both ADV and MODIS retrieve AOD around AERONET locations, show that ADV performs better than MODIS in autumn, while MODIS performs slightly better in spring and summer. In winter, both ADV and MODIS underestimate the AERONET AOD.
Similar AOD patterns are observed by ADV and MODIS in annual and seasonal aggregates as well as in time series. ADV–MODIS difference maps show that MODIS AOD is generally higher than that from ADV. Both ADV and MODIS show similar seasonal AOD behavior. The AOD maxima shift from spring in the south to summer along the eastern coast further north.
The agreement between sensors regarding year-to-year AOD changes is quite good. During the period from 1995 to 2006 AOD increased in the southeast (SE) of China. Between 2006 and 2011 AOD did not change much, showing minor minima in 2008–2009. From 2011 onward AOD decreased in the SE of China. Similar patterns exist in year-to-year ADV and MODIS annual AOD tendencies in the overlapping period. However, regional differences between the ATSR and MODIS AODs are quite large. The consistency between ATSR and MODIS with regards to the AOD tendencies in the overlapping period is rather strong in summer, autumn and overall for the yearly average; however, in winter and spring, when there is a difference in coverage between the two instruments, the agreement between ATSR and MODIS is lower.
AOD tendencies in China during the 1995–2017 period will be discussed in more detail in Part 2 (a following paper: Sogacheva et al., 2018), where a method to combine AOD time series from ADV and MODIS is introduced, and combined AOD time series are analyzed.
- Article
(5706 KB) -
Supplement
(1156 KB) - BibTeX
- EndNote


The concentrations of aerosols in China have been relatively high over the last two decades (e.g., Wang et al., 2017; Zhang et al., 2017), and are rising as a consequence of economic development, industrialization, urbanization and the associated transport and traffic. Examples of other factors affecting interannual and seasonal variations of the aerosol optical depth (AOD) over China are the generation and transport of desert dust (e.g., Proestakis et al., 2018; Wang et al., 2008), seasonal biomass burning (e.g., Chen et al., 2017a) and meteorological conditions and large-scale circulation (Zhu et al., 2012). Both the direct production of aerosol particles and the emission of aerosol precursor gases, such as SO2, NO2 and volatile organic compounds (VOCs), contribute to the observed aerosol concentrations, which manifest themselves as particulate matter (PM) or AOD (Bouarar et al., 2017). PM2.5, the dry mass of aerosol particles with an ambient diameter smaller than 2.5 µm, is often used in air quality and health studies as a measure for aerosol concentrations. PM2.5 is a local quantity that is usually measured near the surface. In contrast, AOD is the column-integrated extinction coefficient, which is an optical property commonly used in climate studies; AOD can be measured from satellites or ground-based remote sensing. PM2.5 and AOD, although both used as a measure for the occurrence of aerosols, are very different aerosol properties which cannot be directly compared.
Spatial variation, seasonal variability and time series have been observed from the analysis of ground-based networks measuring aerosol optical properties using sun photometers in, e.g., the Aerosol Robotic Network (AERONET, Holben et al., 1998), the China Aerosol Remote Sensing Network (CARSNET, Che et al., 2015), the Campaign on Atmospheric Aerosol Research network of China (CARE-China, Xin et al., 2015) and the Sun-sky radiometer Observation NETwork (SONET, Li et al., 2018) or hand-held sun photometers in the Chinese Sun Hazemeter (CSHNET, Wang et al., 2011) networks. These networks provide point measurements, which are representative for a limited area, and the coverage across China still leaves large gaps. Satellite observations, although less accurate, fill these gaps and provide a clear picture of spatial and temporal variations across the whole country.
In de Leeuw et al. (2018), it was shown how the complementary use of three satellite-based radiometers, the Along-Track Scanning Radiometer ATSR-2 on ERS-2, the Advanced ATSR (AATSR) aboard the environmental satellite Envisat, and the MODerate resolution Imaging Spectroradiometer (MODIS) on Terra, results in two decades (1995–2015) of AOD observations over mainland China. This information was complemented with observations on the aerosol vertical structure from the Cloud-Aerosol Lidar with Orthogonal Polarization (CALIOP) between January 2007 and December 2015. The satellite data show the high aerosol concentrations over distinct regions in China such as the North China Plain (NCP) including the Beijing–Tianjin–Hebei (BTH) area, the Yangtze River Delta (YRD), the Pearl River Delta (PRD) and Sichuan Province/Chongqing, as well as the enhanced AOD over the Taklamakan Desert (TD).
The two-decadal time series show the initial rise of the aerosol burden over China at the end of the 1990s, which was followed by AOD variations in response to policy measures to improve air quality via the reduction of emissions of both aerosol particles and their precursor gases such as SO2 and NO2 (e.g., van der A et al., 2017). After 2011, the AOD appears to decrease toward the end of the study period used in de Leeuw et al. (2018), i.e., the end of 2015. These observed temporal variations of the AOD have also been reported elsewhere, including recent analyses indicating a decline since about 2011 (Zhang et al., 2017; Zhao et al., 2017) with some variation in the reported pivot point. The question of whether the recent decrease in AOD is confirmed by an extension of the time series with the most recent data is addressed in the current paper and studied in more detail in Sogacheva et al. (2018) – hereafter referred as Part 2.
Most of the aerosol studies over China are focused on the southeastern (SE) part of the country or on specific regions or cities in SE China. However, the economic situation and governmental policy measures to improve air quality by emission reduction obviously influence the temporal variations of the AOD in each province. This is due to the fact that differences in the emissions between provinces also occur due to the differences in regional policies on emission control and their implementation schedule (Jin et al., 2016; van der A et al., 2017). In addition, both meteorological conditions and large-scale circulation will vary from year to year and between different parts of China during each year. As a result, the aerosol properties and their spatial and temporal variations are expected to be different across China. As an illustration, Fig. 1 shows the AOD time series retrieved using the ATSR Dual View aerosol retrieval algorithm (ADV) version 2.31 (Kolmonen et al., 2016; Sogacheva et al., 2017), for the years 1995–2011, for two areas. One area covers mainland China, the other one only SE China (see Sect. 2 and Fig. 2 for specification of these regions). Clearly, the AOD over SE China is substantially higher than over mainland China, but the AOD also increases much faster over SE China. In addition, the interannual variations are quite similar, with minima and maxima occurring in the same years but with larger amplitudes over SE China.

Figure 1Time series of ATSR-retrieved AOD at 550 nm over China for the years 1995–2011. Note that data are missing at the beginning of the ATSR-2 observation period in 1995 and 1996, and AATSR data start from August 2002.
In this paper, the work presented in de Leeuw et al. (2018) is extended to obtain information on the occurrence of aerosols and their spatial and temporal variation over China with a focus on regional differences in annual and seasonal AOD behavior. In addition, the study period is extended by including 2016 and 2017 and the most recent update of the MODIS AOD data set, Collection 6.1 (C6.1), is used instead of C6. The C6.1 AOD validation results, the C6.1 vs. C6 comparison, the differences between the ADV and MODIS C6.1 seasonal AOD aggregates and the differences in AOD tendencies during the overlapping period (2000–2011) are discussed. The results from the ADV and MODIS AOD comparison will be utilized in Part 2 to construct a combined long-term AOD time series from ADV and MODIS for the period from 1995 to 2017. AOD tendencies over the selected regions will be estimated in Part 2 for the different periods characterized by changes in air pollution control policies in China (Jin et al., 2016; van der A et al., 2017).
The structure of this paper is as follows. In Sect. 2, the study area, including the selection of the 10 regions, is described. In Sect. 3, satellite data are introduced, with a focus on the data coverage (Sect. 3.2), consistency between ATSR-2 and AATSR AOD (Sect. 3.3) and MODIS C6.1 and C6 AOD differences over China (Sect. 3.4). ATSR and MODIS validation results are discussed in Sect. 4. Section 5 focuses on the seasonal AOD variations and their differences for the selected regions across China. In Sect. 6, the main results are summarized as conclusions.
The study area, China, encompasses the same area as in de Leeuw et al. (2018), i.e., the area between 18–54∘ N and 73–135∘ E defined as grid cells with retrievals over land and constrained by the borders indicated by the black line in Fig. 2. The spatial variations of the AOD (Fig. 2) combined with geographical knowledge (cf. de Leeuw et al., 2018) and general knowledge of the locations of highly populated and industrialized urban centers in China was used to select regions with different characteristics for a more detailed study on the long-term variation of the seasonal and annual AOD. The results are expected to show differences in the AOD across China due to different climate conditions and differences in economic development. Such considerations resulted in the selection of 10 study areas as shown in Fig. 2: seven study areas (regions 1–7) in SE China (defined in this study as the over-land area between 20–41∘ N and 103–135∘ E), one covering the Tibetan Plateau (region 8), one over the Taklamakan Desert (region 9) and one over northeastern (NE) China (region 10). It is noted that all areas used in this study only consider the AOD over mainland China, i.e., AOD over the oceans or islands is not included.
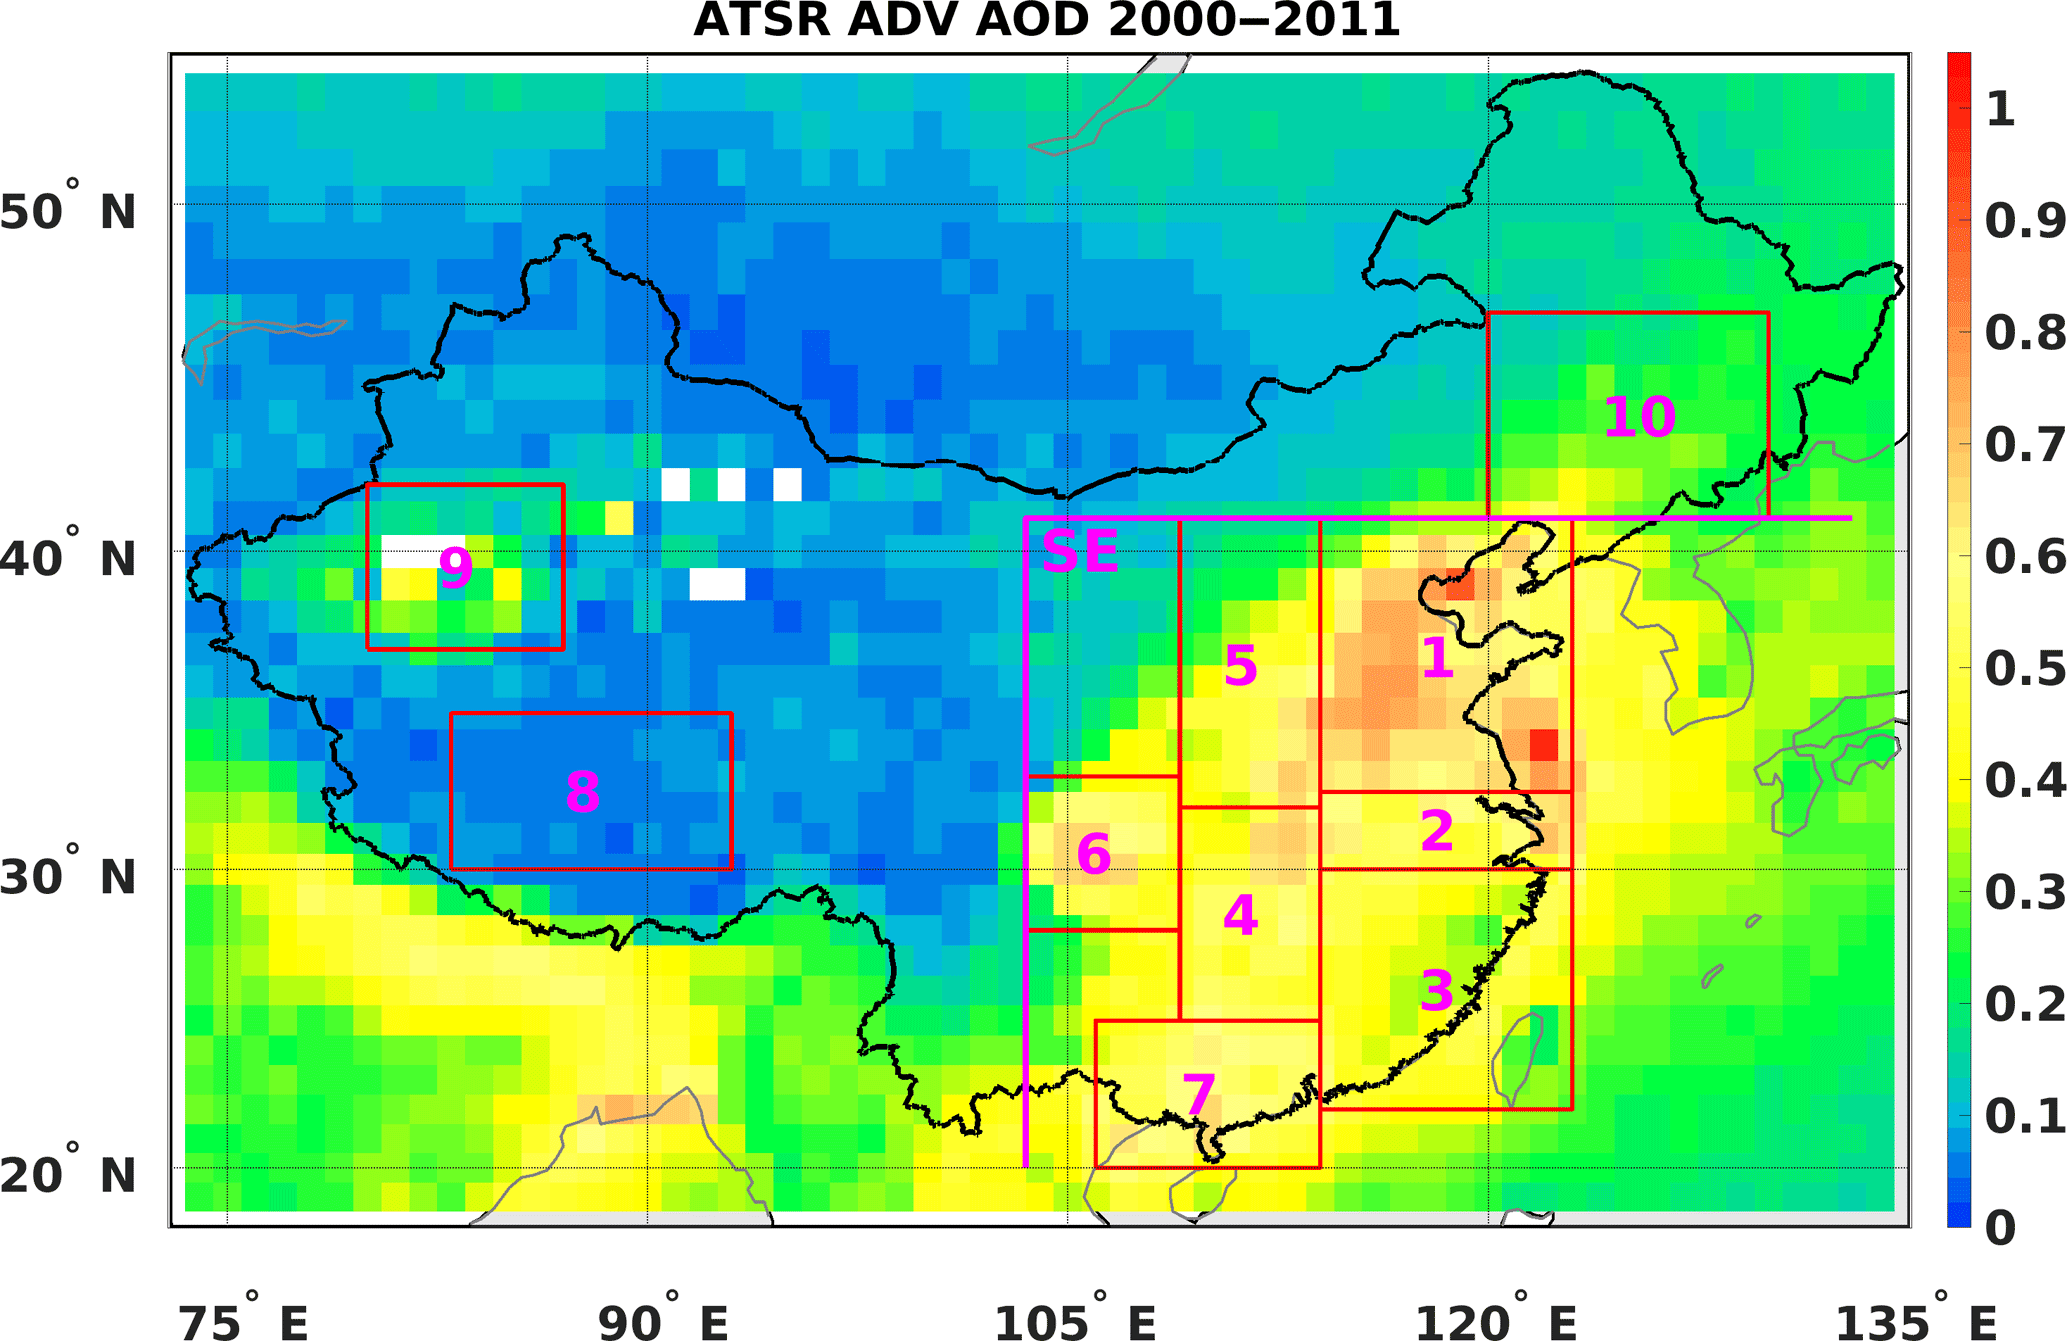
Figure 2Regions over mainland China selected for further study of seasonal, interannual and long-term behavior of the AOD, overlaid on the ATSR-retrieved (ADV version 2.31) 12-year aggregated AOD map. Mainland China is indicated by the black line. Figure shows the 10 selected regions over China and a larger area over SE China indicated by SE.
Obviously, other choices are possible, such as those made by Luo et al. (2014) or Wang et al. (2017). The regions selected by Luo et al. (2014) are generally somewhat smaller than those in Fig. 2, although some were in slightly different regions to those in this study. However, overall the choices are similar and seem to cover major urban/industrial regions such as BTH, the YRD and the PRD, Sichuan/Chongqing and cleaner regions in the north (region 10 in Fig. 2) and southeast (region 3). Regions were also chosen to represent the Tibetan Plateau and Taklamakan Desert. Wang et al. (2017) selected seven regions in North China (north of 32∘ N), some of which partly overlap with the regions selected for the current study. Other studies on the seasonal variation over China were guided by the location of observational sites (e.g., Wang et al., 2011; Che et al., 2015; Wang et al., 2015). Another option may be to select regions by province (e.g., van der A et al., 2017); however, some provinces would cover a mix of high and low AOD regions, while other provinces would be too small for a statistically meaningful data set.
3.1 MODIS C6.1 DTDB and ATSR ADV version 2.31
The data used in this work were discussed in detail in de Leeuw et al. (2018). However, in the current study, the MODIS C6 DTDB merged AOD product (Sayer et al., 2014) was replaced with the recently released MODIS C6.1. In addition, MODIS/Terra data for 2016 and 2017 have been included in the analysis to provide information on the AOD evolution for the most recent years. In short, L3 (averaged on a grid of ) monthly AOD data retrieved from ATSR-2 (1995–2002) and AATSR (2002–2012) (together referred to as ATSR) using ADV version 2.31 (Kolmonen et al., 2016; Sogacheva et al., 2017; Veefkind et al., 1998) and MODIS/Terra AOD C6.1 merged DTDB (L3) monthly data (MOD08_M3, 2000–2017, https://ladsweb.modaps.eosdis.nasa.gov/, last access: 6 August 2018) were used together to cover the period from 1995 to 2017. Validation of the ADV and MODIS AOD products was performed for L2 (averaged on a grid of ) daily data, retrieved with the same corresponding ADV and MODIS algorithms as for L3. Hereafter, the ATSR ADV version 2.31 AOD product will be referred to as ADV, and the MODIS/Terra AOD C6.1 merged DTDB AOD product will be referred to as MODIS.
In this study, the annually averaged AOD data were obtained by averaging monthly aggregated AOD data for each year. Furthermore, the seasonal means were obtained as averages of monthly aggregates for winter (DJF, including December, January and February), spring (MAM, including March, April and May), summer (JJA, including June, July and August) and autumn (SON, including September, October and November). Annual and seasonal linear AOD tendencies for both MODIS and ADV AOD for the overlapping period (2000–2011), when both ATSR and MODIS exist, were estimated using the least squares linear regression method (Chandler and Scott, 2011).
3.2 ADV and MODIS coverage over selected regions
As introduced in de Leeuw et al. (2018), ATSR and MODIS have different temporal and spatial coverage over China. In brief, MODIS/Terra covers China in 1–2 days, while ATSR covers China in 4–5 days.
The ADV datasets for the years 1995, 1996 and 2012 are incomplete. For 1995 and 1996, ADV AOD data are available for the second half of each year (June–December and July–December, respectively). However, all available ADV AOD data in 1995 and 1996 are used in the current study to construct the annual aggregates for comparison with other annual aggregates. Obviously, the 1995 and 1996 aggregates are not exact; therefore, the possible error related to the missing data has been estimated by comparison of the full-year (January to December) AOD composites with the half-year (July–December) AOD composites for the complete years (1997–2011). This comparison shows that when the half-year aggregate was used to present the full-year aggregate, the AOD was underestimated by −0.036 on average (with standard deviation of 0.02), or about 15 % of the yearly aggregated AOD value. In this study, the aggregated AOD values for the years 1995 and 1996 have not been corrected for the missing data and those years are included in the further analysis as they are. Another point worth mentioning is that the white area in the far west of the study area, where ATSR-2 did not provide data, was because the data collection was switched off for data transfer to the receiving station over that area. For 2012, the ADV AOD data are available until the connection with the satellite was lost on the 6 April.
For MODIS/Terra, the AOD data record starts from the end of February 2000. Thus, the winter season for 2000 is missing.
To estimate the spatial coverage of AOD, the fraction of the area where AOD is available has been calculated for all seasonal and annual aggregates for the selected regions (Table S1 in the Supplement). In spring (MAM), summer (JJA) and autumn (SON), the respective ADV coverage reaches 84 %, 91 % and 91 %, while MODIS coverage is 93 %, 93 % and 97 %, respectively, over mainland China. Throughout the year, both ADV and MODIS coverages are close to 100 %, except for region 9, where the ADV coverage is 62 %. For both ADV and MODIS, the Tibetan Plateau (region 8), the Taklamakan Desert (region 9) and NE China (region 10) are covered less than other regions, throughout the year.
Regarding the seasons, the lowest AOD coverage is observed in winter (DJF), when northern and western China are covered with snow. As with most aerosol retrieval algorithms, MODIS and ADV have difficulty retrieving AOD over snow and ice (Hsu et al., 2013; Istomina et al., 2011; Kolmonen et al., 2016), in addition to year-round difficulty over bright surfaces such as the Taklamakan Desert. On average, in winter MODIS provides AOD values over 70 % of mainland China, while ADV AOD is available over 35 % of China. For certain years, ADV AOD is not available in the winter over regions 9 and 10; thus, it is not shown in the analysis (Sect. 5). However, as the annual AOD time series for ADV and MODIS in regions 9 and 10 show similar tendencies (discussed later in Sect. 5.3), we assume that missing (for some years) ADV AOD in winter does not considerably bias the results.
Therefore, besides the difference in the validation results presented and discussed below (Sect. 4), which is likely due to the differences in the ADV and MODIS AOD retrieval approaches and their implementation, the difference in the ATSR and MODIS/Terra spatial and temporal coverage might influence the AOD composites. Another exercise might be performed, where AOD aggregates are built for collocated ADV and MODIS pixels, but this is beyond the scope of the current paper, where AOD aggregates for all available points in the ADV and MODIS standard products are analyzed and compared.
3.3 Consistency between ATSR-2 and AATSR AOD datasets
The ATSR-2 and AATSR instrument characteristics are very similar (ATSR-1/2 User Guide, 1999; AATSR Product Handbook, 2007). The main potential reason for a difference would be offsets of the sensors' absolute calibration and small differences in band spectral response functions. Unfortunately, error characteristics of the two instruments are not available. Thus, we compare and validate the AOD products obtained from ATSR-2 and AATSR with the same retrieval algorithm (ADV V2.31). ATSR-2 was in an orbit ca. 30 min later than AATSR, which allows for the direct comparison of the retrieved collocated pixels. The number of collocations is limited by the cloud-free conditions for both overpasses needed for the retrieval.
The AATSR AOD data series starts on the 20 May 2002. However, several data interruptions in June–July do not allow for the constructions of monthly aggregates. Thus, the comparison analysis between ATSR-2 and AATSR AOD is performed for August–December 2002. The period is limited by technical issues with the ATSR-2 pointing accuracy, which started in 2003.
Pixel-by-pixel comparison between the ATSR-2 and AATSR L2 AOD is shown in Fig. 3 with (i) a scatter density plot of the difference between AATSR and ATSR-2 AODs as a function of AATSR and AOD and (ii) box plots with statistics related to certain AOD bins. For AOD < 0.5 (78.8 % of all retrieved pixels), the offset is close to 0, which means that there is practically no offset between ATSR-2 and AATSR AOD for low (<0.5) AOD. For an AOD between 0.5 and 1.5 (20.6 % of all retrieved pixels), the median values in chosen bins are slightly below 0, while the mean AATSR AOD is 0.05–0.12 lower than the mean ATSR-2 AOD. For an AOD > 1.5, AATSR AOD is considerably higher. However, only 0.6 % of the retrieved pixels fit into the AOD > 1.5 bin.
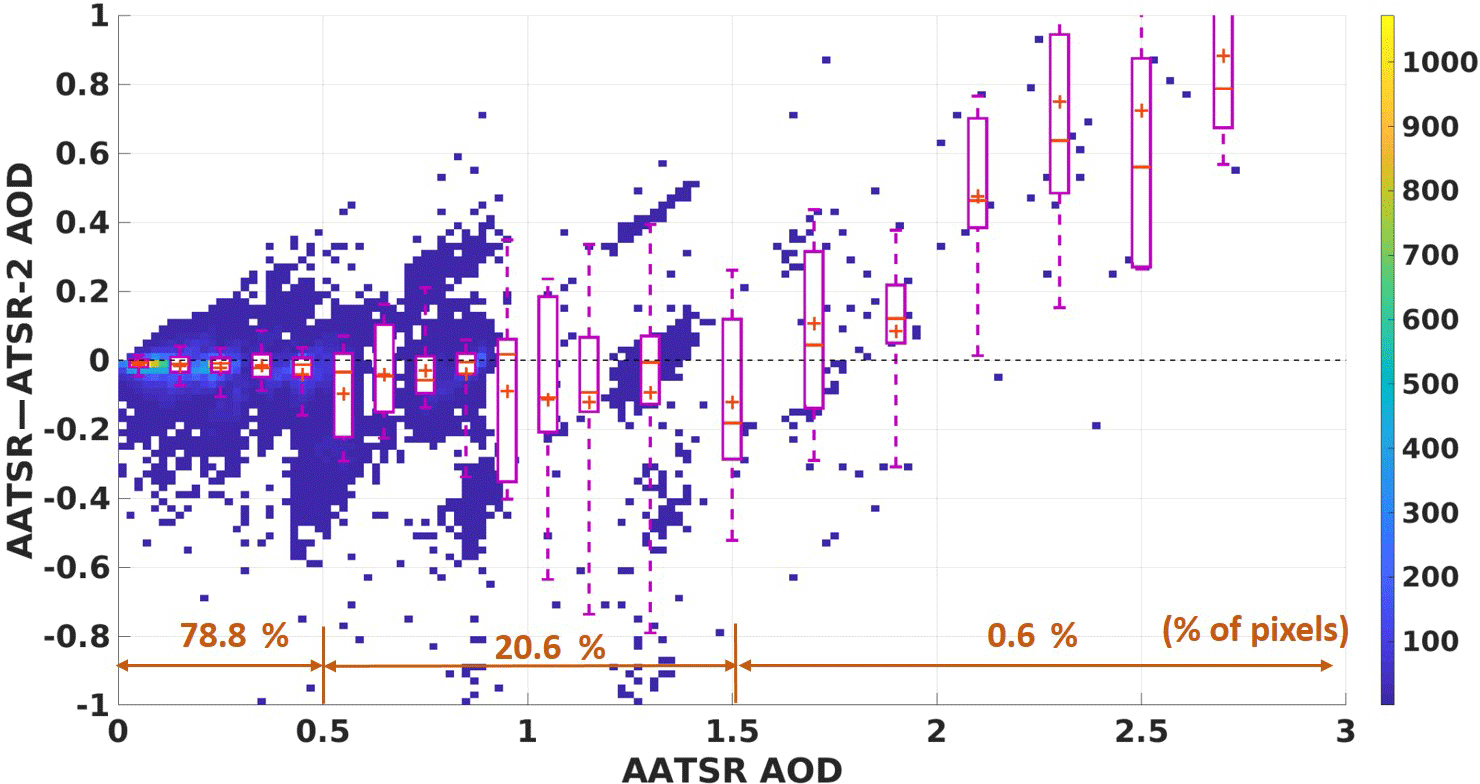
Figure 3Scatterplot for AATSR AOD and the difference in AOD between AATSR and ATSR-2. For AATSR AOD bins, box plots (magenta) are shown, which include the following statistics: mean values as “+”, median values as “−”, lower and upper quartiles (box), 9 % and 91 % as lower and upper whiskers. The percentages from all retrieved pixels in three AOD bins (AOD < 0.5, 0.5 < = AOD < = 1.5, AOD > 1.5) are shown in brown.
Monthly AOD aggregates for August–December 2002 for China and globally over land are shown in Fig. 4. The monthly aggregates over China combined from L3 data show similar values for the two ATSR instruments, i.e., there are no systematic difference between ATSR-2 and AATSR AODs. ATSR-2 AOD is ca 0.035 higher in August and October, while AATSR is higher by a similar amount in September and by ca 0.02 in November. In December, AOD retrieved with the two instruments is similar. On a global scale, AOD retrieved from ATSR-2 is somewhat higher (ca. 0.01–0.03) than that from AATSR in all months except October, where the AOD difference is negligible. Error bars, which show 1σ standard deviation of AOD for each aggregate, closely overlap for all of the pairs that were compared.

Figure 4AOD monthly aggregates for ATSR-2 (purple line) and AATSR (blue line) over China (green dots) and globally over land (red diamonds). The vertical dashed lines on each marker represent 1σ standard deviation.
For an evaluation of the differences between the AOD retrieved from ATSR-2 and AATSR, data from the overlap period (August–December 2002) were validated using ground-based AOD from AERONET, which for that period are available over the BTH area from 2002 and over Taiwan (where AERONET measurements were started in 1998). The low density of AERONET stations during that period and the limited number of available collocations (5 for ATSR-2 and 17 for AATSR) does not allow for statistically significant conclusions on the AOD quality. Thus, we additionally added all available global locations for August–December 2002 for an evaluation exercise. The results in Fig. 5 show the correlation coefficient (R=0.89), and the low bias between AERONET and ATSR-2 AOD (Fig. 5, left). For AATSR the correlation is also high (0.86), with a small bias (0.01). AOD standard deviation is 0.008 and 0.005 and root mean square error is 0.12 and 0.13 for ATSR-2 and AATSR, respectively. Thus, the validation results confirm the similar performance of ADV for both sensors.
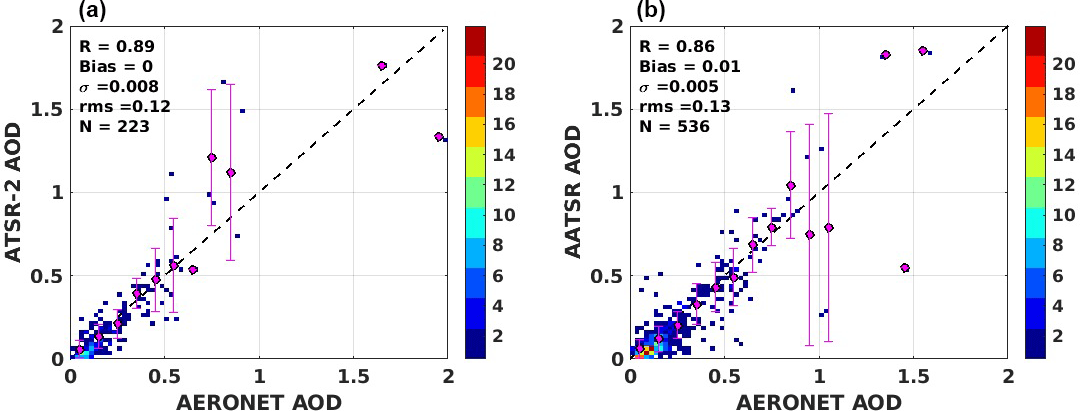
Figure 5Density scatterplot of ATSR-2 AOD (a) and AATSR AOD (b) vs. AOD from AERONET stations globally for the period from August to December 2002. The filled circles are the averaged ATSR AOD binned in 0.1 AERONET AOD intervals (0.25 for AERONET AOD > 1.0) and the vertical lines on each circle represent the 1σ standard deviation. Statistics in the upper left corner indicate the correlation coefficient R, the bias, the standard deviation, the root mean square (rms) error and the number of data points (N). The color bar on the right indicates the number of data points in each bin.
Thus, the AOD values retrieved from ATSR-2 and AATSR are consistent, as shown by pixel-by-pixel, monthly aggregates and validation results comparisons. Furthermore, most of the differences are within the measurement uncertainty (0.03, or 10 %) requirement of the Global Climate Observing System (GCOS, 2011); this makes it possible to combine ATSR-2 and AATSR AOD into one dataset without offset correction.
3.4 Comparison between MODIS merged DTDB C6.1 and C6 AOD
In MODIS C6.1, the brightness temperatures biases and trending were significantly reduced compared to C6, which affected ice cloud detection over water surfaces (Moeller et al., 2017). The electronic crosstalk correction discussed in Wilson et al. (2017) was also made, which greatly improved the performance of the cloud mask.
The difference between the C6.1 and C6 annual AOD over China averaged for the 2000–2011 period is shown in Fig. 6. This period was chosen because of the overlap between ATSR and MODIS, which is studied in the current paper. Over most of China, the difference between C6.1 and C6 is very small (within ±0.025), except for certain areas (Fig. 6). The annual aggregated C6.1 AOD over the Tibetan Plateau and over the area north of the Taklamakan Desert is 0.1–0.2 lower than for C6, while over Ningxia Province (ca. 35–37∘ N and 103–107∘ E) and the Sichuan Basin (ca. 28–30∘ N and 103–107∘ E) the AOD increased by 0.1–0.2. Figure 6b shows that the AOD differences over the TP and in the north are mostly due to the lower C6.1 AOD in the winter (DJF, about 0.15) and spring (MAM, up to 0.25), and that the differences over Ningxia are due to the much higher AOD in these seasons in C6.1. Over the Sichuan Basin the C6.1 and C6 AOD values are similar in all seasons except winter, when C6.1 is about 0.25 higher. Similar changes in the AOD between C6.1 and C6 are shown by Sayer (2017) for the period from 2000 to 2008 over China.
With regards to coverage, over most of mainland China, the differences between C6.1 and C6 are very small, except over elevated areas such as the Tibetan Plateau, the Huangiu Gaoyuan Plateau and areas in the northeast and northwest of the country (Andrew Sayer, personal communication, 2017). However, the MODIS AOD coverage over other locations has increased in C6.1, which is concluded from the increasing number of points available for validation, as discussed in Sect. 4.
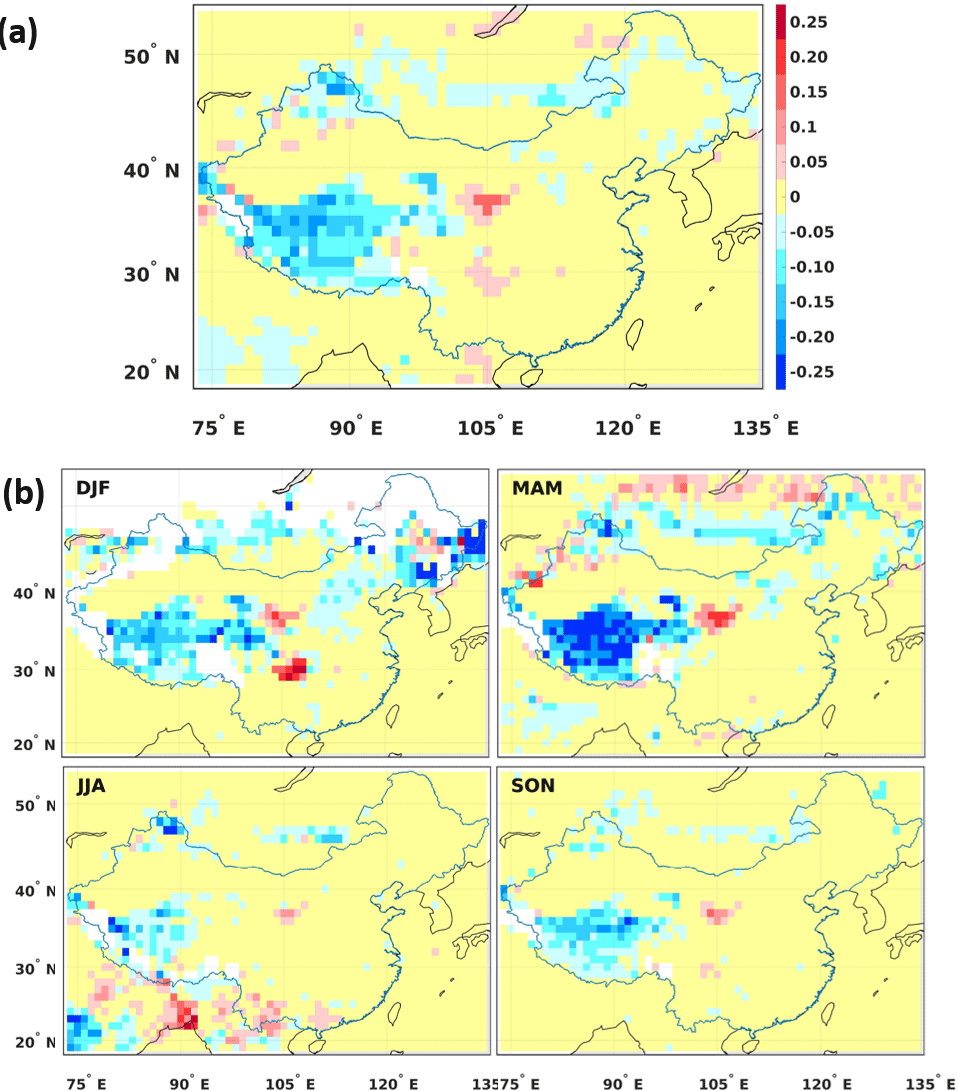
Figure 6Difference between MODIS C6.1 and C6 DTDB merged AOD over China: annual averages for 2000–2011 (a) and seasonal averages for the same period (b), where DJF represents winter, MAM represents spring, JJA represents summer and SON represents autumn). Areas for which no data are available are shown in white.
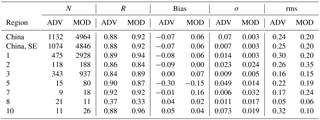
Table 1AOD validation results (number of points (N), correlation coefficient (R), bias, standard deviation (σ) and root mean square (rms) error) for ADV and MODIS (MOD) obtained for the regions (left column), where AERONET data are available.
4.1 General validation over China and validation results for selected regions
MODIS C6.1 was validated over China with AERONET AOD (Fig. 7, right) for the sites available in the study area similar to C6 validation, as described in de Leeuw et al. (2018). Briefly, collocated satellite and AERONET data were used, i.e., satellite data within a radius of 0.125∘ around the AERONET site are averaged and compared with the averaged AERONET data measured within ±1 h of the satellite overpass time (Virtanen et al., 2018). C6.1 had about 5 % more matchups with AERONET. For C6.1 the validation results did not changed much, since the number of AERONET stations is limited over the areas where the changes in AOD in C6.1 compared to C6 are visible in the yearly and seasonal aggregates (Fig. 6).

Figure 7Density scatterplot of ATSR ADV v2.31 AOD (a, reproduced from de Leeuw et al., 2018, Fig. 7), and MODIS C6.1 DTDB vs. AOD from AERONET stations in mainland China (b)for the years 2002–2011. The filled circles are the averaged ATSR AOD binned in 0.1 AERONET AOD intervals (0.25 for AERONET AOD > 1.0) and the vertical lines on each circle represent the 1σ standard deviation of the averages. Statistics in the upper left corner indicate the correlation coefficient R, the bias, the standard deviation, the root mean square (rms) error and the number of data points (N). The color bar on the right indicates the number of data points.
ADV validation results (Fig. 7a, left) are adopted from de Leeuw et al. (2018). The main difference in ADV and MODIS performance, the bias, which is similar in absolute value but opposite in sign (0.06 for MODIS and −0.07 for ADV), changed little from C6 to C6.1 (Fig. 7). This difference in AOD bias is emphasized here because it explains the offset in the AOD between ADV and MODIS, as shown and discussed below, and will be used in Part 2 to construct the ADV and MODIS combined time series.
We also checked whether the AOD validation results differ across China, where aerosol conditions change considerably from region to region, reflecting differences in primary and secondary aerosol sources, population density, industry, etc. Unfortunately, AERONET stations are sparsely located and long-term measurements have only been conducted for a few locations (see Table 1 and Fig. 1 in de Leeuw et al., 2018), mostly in SE China.
The validation statistics for the selected regions, where AERONET AOD data are available, are shown in Table 1 (note the low number of validation points N in regions 5, 7, 8 and 10). For both ADV and MODIS, R was rather high (0.84–0.92) for all regions presented in the analysis, except for region 8, where the correlation with AERONET was much lower for both datasets (0.33 and 0.35, ADV and MODIS, respectively). In region 8, which includes the sparsely populated Tibetan Plateau, an area that is often covered with snow, AOD is very low; therefore, high uncertainties in AOD are expected related to the retrieval algorithms limitations (e.g., Kolmonen et al., 2016; Sayer et al., 2014). In region 5, both ADV and MODIS show a strong negative AOD bias (−0.30 and −0.15, respectively). A high positive AOD bias (0.16) is observed for MODIS in region 7.
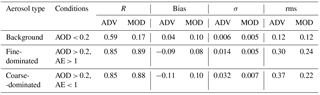
AOD was also validated for different aerosol types, classified according to the AOD value and the Ångström exponent (AE): “background” (AOD < 0.2), “fine-dominated” (AOD > 0.2, AE > 1) and “coarse-dominated” (AOD > 0.2, AE < 1) aerosols (Table 2).
For “background” aerosols (26 % and 17 % of validation points are in that class for ADV and MODIS, respectively), the correlation between MODIS- retrieved and AERONET AOD was poor (R=0.17), while for ADV the correlation was better (R=0.59). For “fine-dominated” (59 % and 56 % of validation points for ADV and MODIS, respectively) and “coarse-dominated” (15 % and 27 % of validation points for ADV and MODIS, respectively) aerosols, the validation statistics for ADV and MODIS were similar. Both products showed high (>0.85) correlation with AERONET. Similar in absolute values but different in sign, AOD bias was calculated for “fine-dominated” (−0.09 and 0.08, for ADV and MODIS, respectively) and “coarse-dominated” aerosol conditions (−0.11 and 0.10, for ADV and MODIS, respectively).
Table 2AOD validation results (number of points (N), correlation coefficient (R), bias, standard deviation (σ) and root mean square (rms) error) for ADV and MODIS (MOD) obtained for different aerosol types, classified with the AOD and the Ångström exponent (AE).
4.2 ADV and MODIS collocated points annual and seasonal validation
The validation results presented in Fig. 7 show that MODIS AOD is positively biased, whilst ADV is negatively biased. However, since more validation points are available for MODIS than for ADV (Fig. 7 and Table 1), which is likely explained by better MODIS coverage (see the discussion on the ADV and MODIS coverage in Sect. 3.2), a direct comparison of the algorithms performance to show differences in the retrieved AOD cannot be made. Instead, the retrieval performance was evaluated using collocated ATSR–MODIS/Terra–AERONET data. In collocated points validation only AOD data were used, where both MODIS and ADV had achieved a successful retrieval within ±1 h over AERONET sites and the difference between the ADV and MODIS overpasses was below 90 min. In total, 255 collocated points were recognized for the 2002–2011 period.
Validation of the collocated points was performed for the overlapping period (Fig. 8, upper panel) and also for each of the seasons (Fig. 8, middle panel for ADV and lower panel for MODIS). The scatterplots of the ADV or MODIS AOD vs. AERONET AOD show that for all collocated points (Fig. 8, upper panel) the R is similar for ADV and MODIS (0.92 and 0.93, respectively), while the bias is negative for ADV (−0.11) and positive for MODIS (0.06). In winter, when the number of collocated points is low (10), both ADV and MODIS slightly underestimate AOD. In spring, R is lower than for other seasons and is the same (0.81) for both ADV and MODIS, while bias is 0 for ADV and positive for MODIS (0.11). In summer, R is slightly higher for MODIS (0.96 vs. 0.94 for ADV), and the bias is similar in absolute value (0.13) but has different sign for ADV (positive) and MODIS (negative). In autumn, ADV performs slightly better (R is 0.92 and 0.88, bias is −0.02 and 0.05 for ADV and MODIS, respectively). Thus, in all seasons except winter, positive bias is observed for MODIS, while ADV AOD is biased negative in all seasons except spring, when the ADV bias is 0.

Figure 8Density scatterplots of collocated ATSR ADV v2.31 AOD and MODIS C6.1 DTDB merged AOD vs. AOD from AERONET stations in China for the years 2002–2011: all points (a) and seasonal statistics (b for ADV and c for MODIS). The color bar at the bottom indicates the number of data points.
We also checked whether the difference in the ADV and MODIS AOD depends on the difference in overpass time between ATSR and MODIS/Terra. The comparison of the AOD for ADV–MODIS–AERONET collocated points is shown as a scatterplot of MODIS AOD vs. ADV AOD in Fig. 9. The color code indicates the difference in the exact overpass time between ADV and MODIS. For all collocated points, MODIS AOD is usually higher, with an offset of 0.2. This positive difference does not depend on the difference in overpass times between ATSR and MODIS/Terra; thus, the difference cannot be explained by the influence of the possible AOD daily cycle.

Figure 9MODIS/Terra C6.1 DTDB merged AOD vs. ATSR ADV v2.31 AOD, for collocated ATSR–MODIS/Terra–AERONET data, as described in Sect. 4.1. The colors (scale at the right) indicate the difference between the MODIS/Terra and ATSR overpass times in minutes.
The AOD over China does not only vary in space, seasonal variations are also observed, as briefly discussed in de Leeuw et al. (2018) based on MODIS/Terra C6 data. Seasonal AOD maps for ADV and MODIS C6.1, aggregated over the years 2000–2011, and ADV–MODIS difference maps for each season, are presented in Fig. 10. The spatial distribution of seasonally averaged AOD is similar to the spatial patterns of the annually averaged AOD. However, Fig. 10 shows some clear differences between ADV and MODIS, i.e., the MODIS AOD is often higher than that from ADV, and MODIS has better coverage over bright surfaces. The latter is particularly prominent for the winter season (DJF) when the north and west of China are covered with snow. As previously mentioned, like most aerosol retrieval algorithms, ADV has difficulty retrieving AOD over snow and ice, as well as year round over bright surfaces such as deserts. In seasons other than winter, ADV has reasonable coverage over most of China (see Table S1), except over the Taklamakan Desert where high dust episodes are missed. It is noted that MODIS also does not provide AOD over snow and ice (Levy et al., 2013; Hsu et al., 2013); however, over bright desert surfaces the DB algorithm does provide AOD (Hsu et al., 2004), which is included in the DBDT product used in this study. Nevertheless, as shown in Fig. 10, MODIS also misses AOD over the Tibetan Plateau along the southern border of China during all seasons, as well as along the northwest border in the winter. North of ca. 45∘ N both MODIS and ADV do not provide AOD data in the winter.
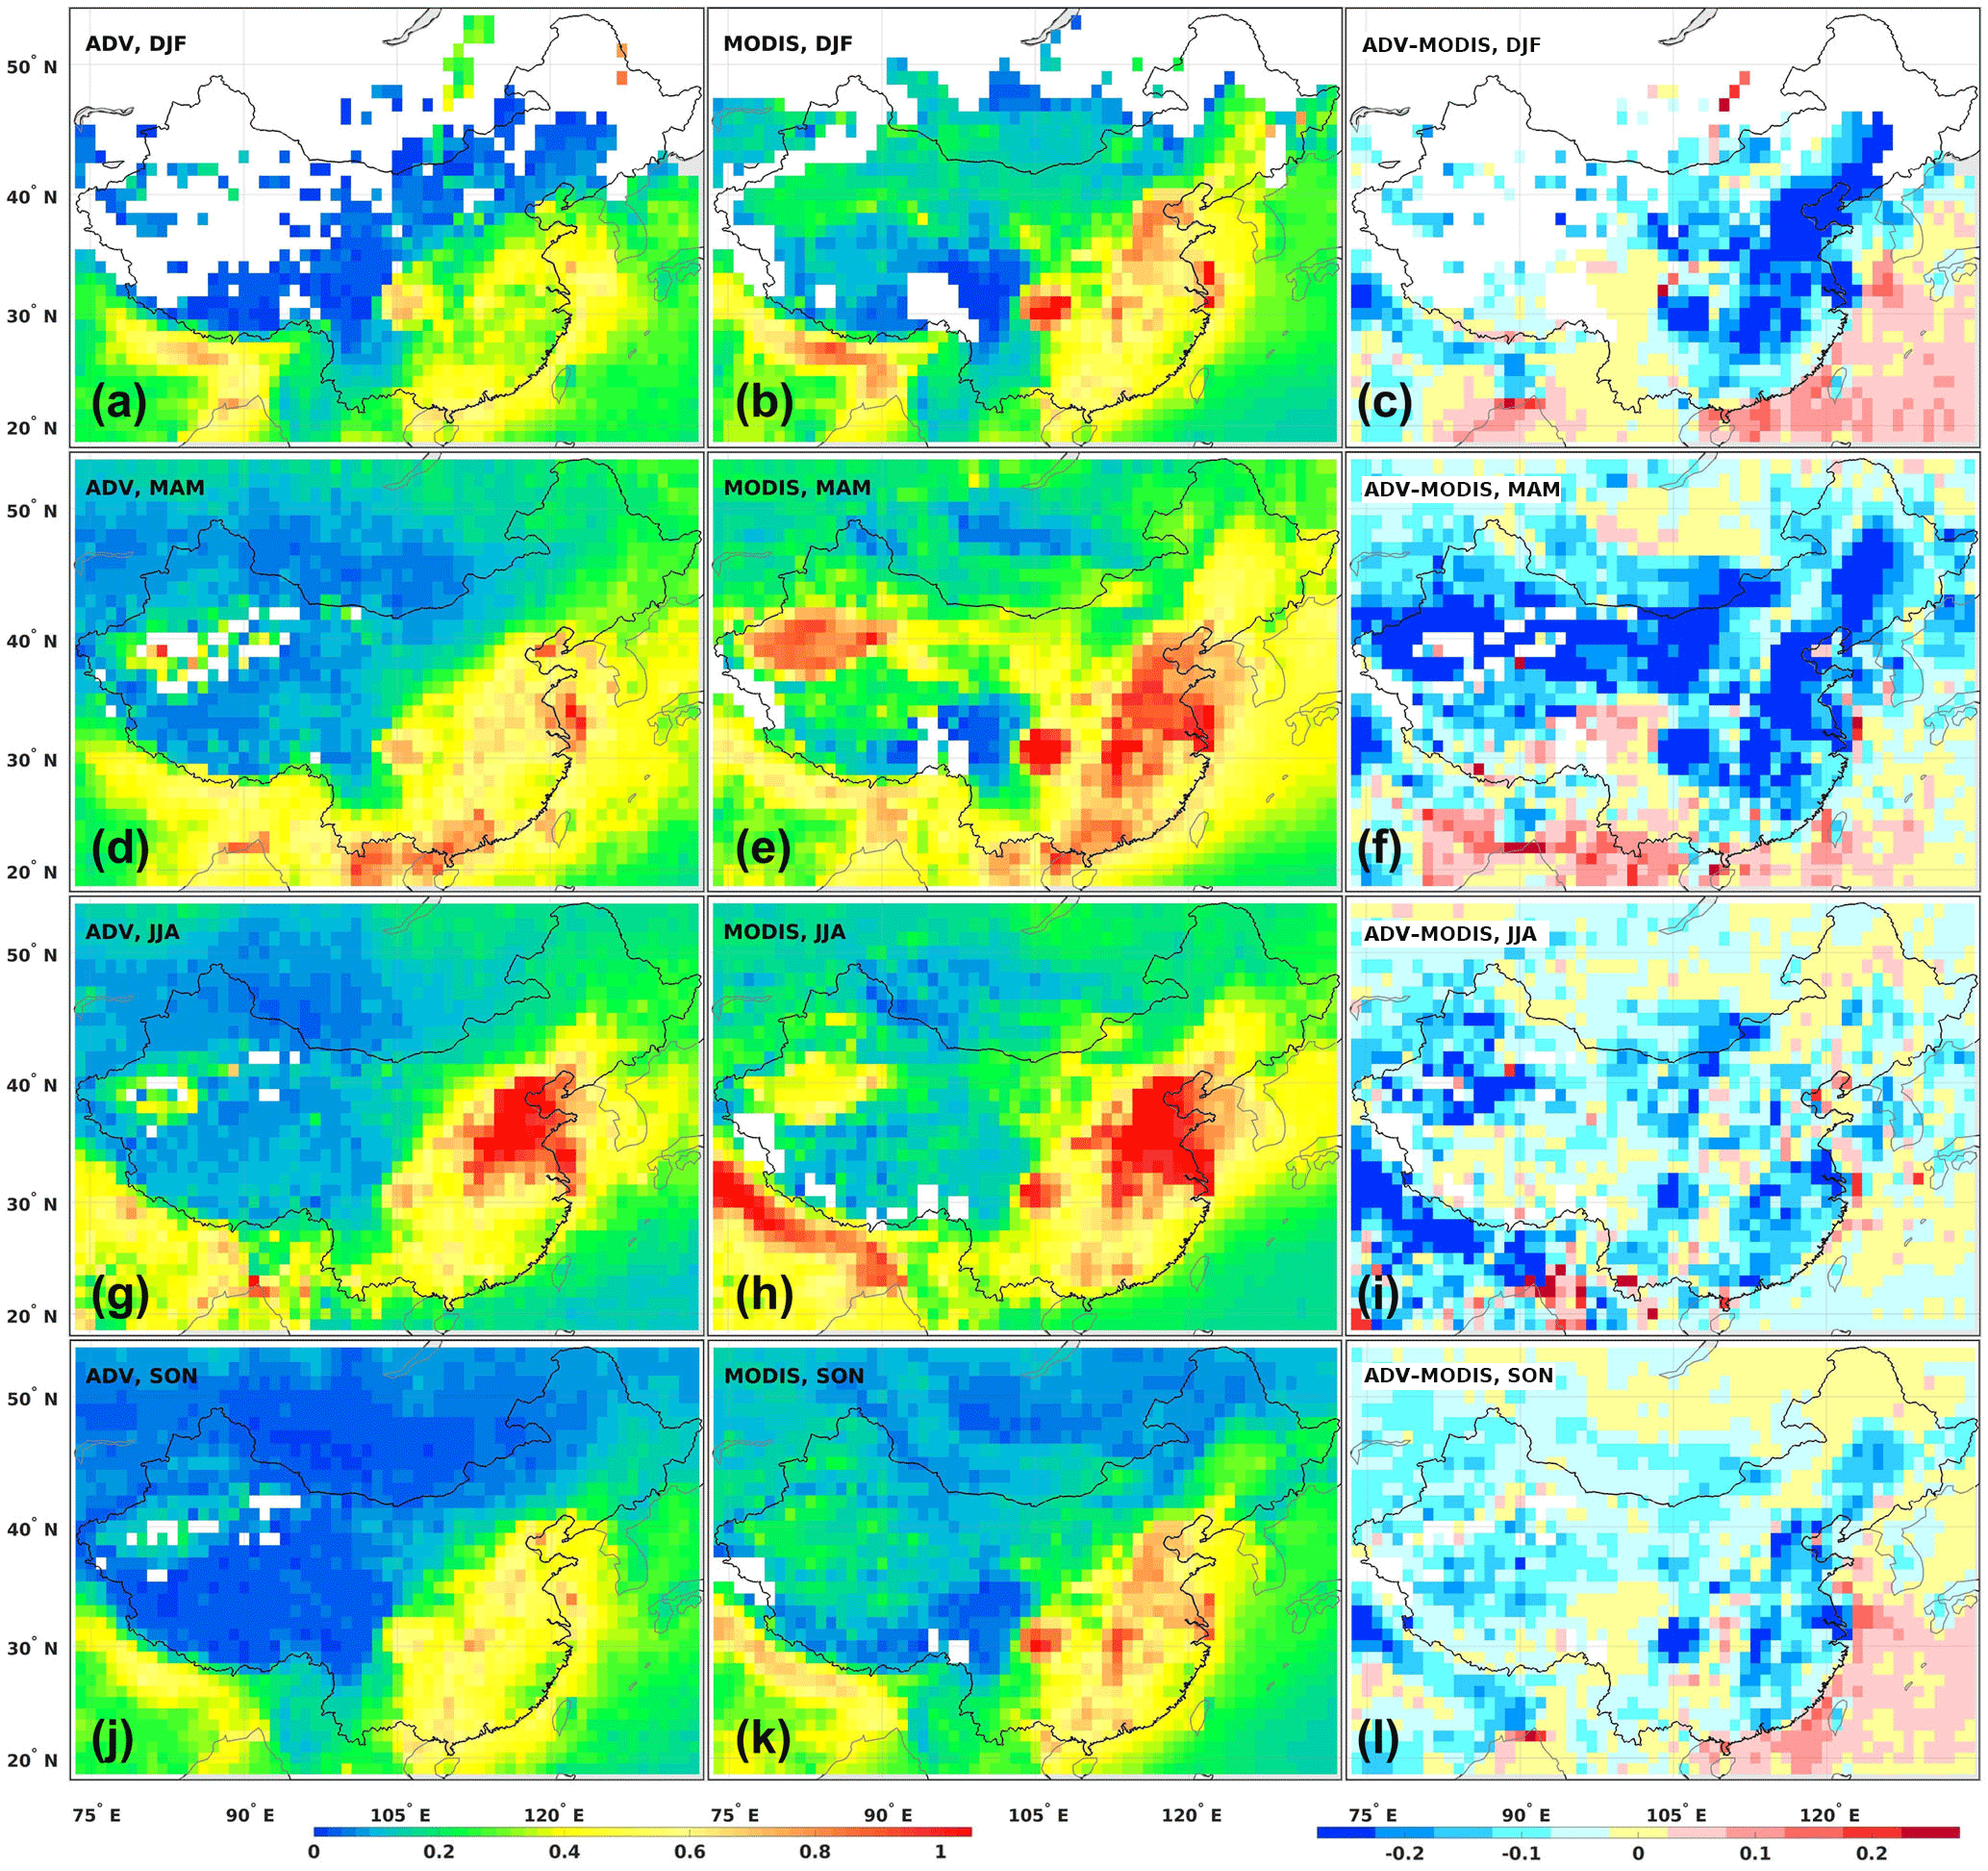
Figure 10Seasonal AOD maps aggregated over the years 2000–2011 (top to bottom: DJF (winter), MAM (spring), JJA (summer) and SON (autumn)). (a, d, g, j): ATSR ADV v2.31 (adapted from de Leeuw et al., 2018, Fig. 11); (b, e, h, k): MODIS/Terra C6.1 merged DBDT; (c, f, i, l): difference maps ADV–MODIS. The AOD and difference scales are plotted at the bottom. Pixels for which no value was retrieved are plotted in white.
With regards to the AOD differences between MODIS and ADV, the difference maps in Fig. 10 show that MODIS is much higher (≥0.25) than ADV over part of SE China in winter and spring, especially over the NCP and the Sichuan Basin, as well as over the desert areas west of the Loess Mountains. In summer, these differences are generally much smaller (≤0.15–0.2) except over the Sichuan Basin, the Taklamakan and Gobi deserts and some smaller areas in SE China. Furthermore, just south of the Himalayas the MODIS AOD is much higher (≥0.25) than that retrieved using ADV. In autumn, the differences between MODIS and ADV are mostly small (≤0.1) except for some regions in the SE of China (e.g., Sichuan, YRD and Hebei), as well as SW of the Himalayas. These observations regarding the differences between ADV and MODIS can be partly explained by the validation results presented in Figs. 7 and 8, i.e., MODIS is biased high and ADV is biased low by a similar amount. However, these biases do not explain the seasonal variations of the differences between MODIS and ADV. These are likely due to retrieval assumptions with regards to the aerosol properties and the surface reflectance. The largest discrepancies are observed in the area north of about 27∘ N and over relatively bright areas in the deserts as well as over the NCP, which is dryer in winter and spring than during the summer and autumn. In addition, these regions are influenced by desert dust, which has relatively large contributions to the AOD in spring as discussed below. ADV does not provide a quality retrieval over bright surfaces, in addition to the fact that the ADV AOD for SE China is substantially lower than that from MODIS. The substantially lower ADV-retrieved AOD in spring may indicate that the ADV retrieval of dust, which is most prominent in spring (e.g., Proestakis et al., 2018), needs some improvement. The difference between ADV and MODIS AOD may also be due to the fact that MODIS provides more results over bright surfaces, where ADV AOD is lower, if retrieved. In contrast, in summer the differences are much smaller.
Regarding the AOD seasonal variation, the maps in Fig. 10 show similar variations for the ADV and MODIS-retrieved AODs. For instance, for the PRD the AOD is highest in spring and lower in other seasons, whereas over the NCP (in the area from BTH to the YRD) the AOD is highest in summer. The ADV and MODIS AOD seasonal aggregates for different areas will be discussed in Sect. 5.1.
5.1 Seasonal variation by region for the 2000–2011 period
AOD seasonal time series for China, SE China and each of the 10 regions over China, selected as described in Sect. 2, are shown in Fig. 11, for both ADV and MODIS. The data shown in Fig. 11 are averages over the three months in each season, and over the years 2000–2011, i.e., the overlapping period for ATSR and MODIS/Terra. These time series illustrate the overall behavior that emerged from the seasonal AOD maps in Fig. 10, i.e., a clear seasonal variation of the AOD over all regions, which is similar for both ADV and MODIS but with MODIS AOD somewhat higher than that from ADV. For all regions, the AOD is lowest in the winter, except for region 6 (Sichuan/Chongqing), where the minimum occurs in autumn. For all of mainland China, AOD is also slightly lower in autumn, as compared to winter. For all regions, the AOD is highest in spring, except for regions 1 and 5 where the maximum AOD is observed in the summer. In region 2, the AOD is similar in spring and summer. The difference in the seasonal variation of the AOD between regions 1 (NCP) and 5 and those further south in region 2 (YRD) and region 7 (PRD), which are all very large urban areas with a high population and large industrial development, is likely due to the different climatological zones. The NCP is situated in a temperate monsoon climate region, the YRD in a subtropical monsoon climate region and region 7 combines regions with a subtropical and a tropical monsoon climate, with strong differences in rain-season trends, i.e., precipitation and number of rain days (Song et al., 2011; Kourtidis et al., 2015; Stathopoulos et al., 2017). The East Asian summer monsoon (EASM) and the associated rain patterns over eastern China (Song et al., 2011) progress from the south in April to the YRD in the early summer and reach BTH in July. When the monsoon period ends in August, the rain belt moves back to the south. Precipitation obviously affects the AOD due to wash out of the aerosol particles, although on warm days with high relative humidity the aerosol particles swell and small (<100 nm) aerosol particles grow into the optically active size range. As a result, the particle size distribution shifts to larger particles and the aerosol scattering and associated AOD increase (Bian et al., 2014; Zhang et al., 2015). In region 10, in the northeast of China, which has a cooler climate that the EASM does not reach, the AOD maximum occurs in spring.

Figure 11AOD seasonal time series averaged over the 2000–2011 period for ADV and MODIS (see legend for explanation) for China, SE China and the 10 selected regions as discussed in Sect. 2. Error bars shown on each seasonal data point are 1σ standard deviation.
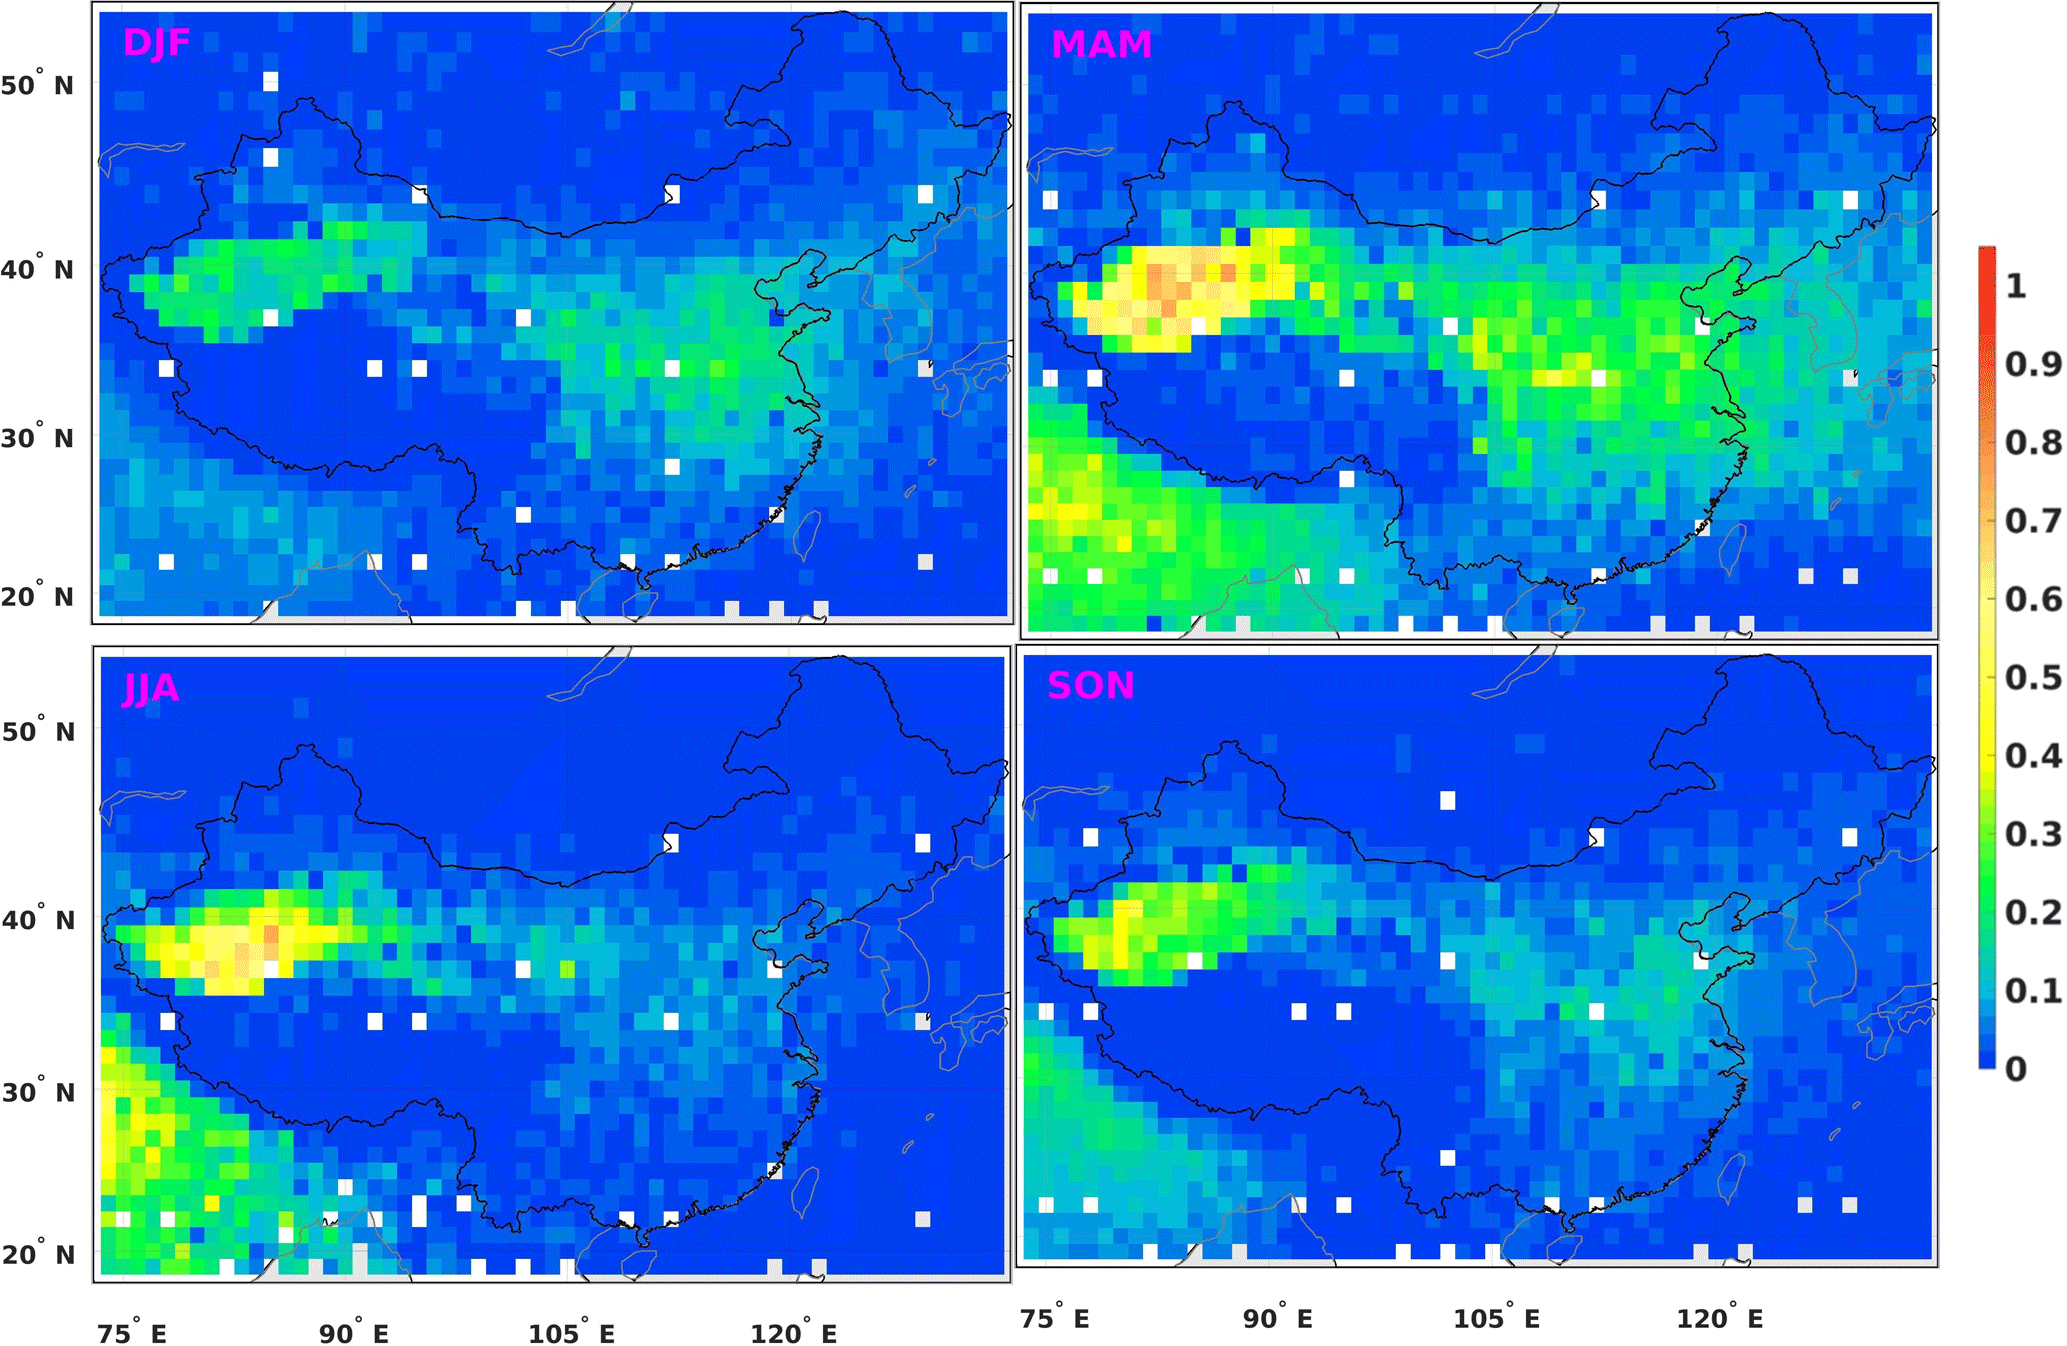
Figure 12Spatial distribution of the seasonal mean dust AOD, as determined from CALIPSO observations, aggregated over the period from January 2007 to December 2015. Adopted from Proestakis et al. (2018). Chinese borders are indicated by the black line.
Another factor influencing the seasonal variation of the AOD is the dust emitted from the deserts, with the highest emission intensity in spring and summer (cf. Proestakis et al., 2018). The largest dust sources in China are the Taklamakan Desert and the Gobi (GD) Desert. Due to differences in topography, elevation, thermal conditions and atmospheric circulation, the GD has a much more important role than the TD in contributing to the dust concentrations in East Asia (Chen et al., 2017b). Figure 12, reproduced from Proestakis et al. (2018), who described how these products were obtained in detail, shows seasonal maps of dust AOD (DAOD) at 532 nm, based on CALIOP (Cloud Aerosol Lidar with Orthogonal Polarization; Winker et al., 2009) observations between January 2007 and December 2015. These maps clearly illustrate the effect of the dust generated over the TD, with very high DAOD in the spring (up to about 0.7) and summer, and much lower DAOD in the autumn and winter (about 0.2). In contrast, there is no clear dust signal over the northern part of the Gobi Desert, where surface dust concentrations are high (cf. Chen et al., 2017b), in either the CALIOP DAOD maps in Fig. 12 or the ADV and MODIS AOD maps in Fig. 10. In these satellite observations the dust appears to be confined south of 40∘ N.
A noticeable feature is the distinct eastward pathway of dust aerosol transport, although the observed features vary strongly with season. The eastward dust aerosol pathway extends from the Taklamakan Desert over central China (Kuhlmann and Quaas, 2010), with DAOD values of up to 0.3 in the spring and much lower in other seasons (0.1), towards the Yellow Sea and the Pacific Ocean (Uno et al., 2009). This dust aerosol trans-Pacific belt extends over central China between 30 and 45∘ N, contributing (with dust aerosols) up to 50 % to the total aerosol load of the densely populated Beijing, Hebei, Tianjin and Shandong provinces (Proestakis et al., 2018). However, very low DAOD values are observed to the south of about 30∘ N throughout the year, i.e., south of the Yangtze River basin, indicating the very low dust aerosol transport to the south of the observed dust aerosol trans-Pacific belt. The YRD is also the area where the seasonal maximum shifts between spring and summer; north of the YRD are regions 1 and 5 with summer AOD maxima, as described above. Clearly, in spite of the relatively high DAOD over the TD in the summer and presumed sources over the GD, there appears to be little eastward transport. DAOD is also not responsible for the high summer AOD, with DAOD over the NCP in the order of 0.1. Another reason for the high AOD in summer might be agricultural fires during the summer harvest period in June in the NCP (Zhang et al., 2018), in addition to the mechanism proposed above in reaction to the migration of the EASM.
5.2 Long-term AOD seasonal variations for ATSR ADV (1995–2011) and MODIS (2000–2017)
Figure 10 shows the spatial distribution of the multi-year averaged ADV and MODIS seasonal AOD for the years 2000–2011. However, this leaves out the pre-EOS period covered by ATSR-2 and the post-Envisat period covered by MODIS. Furthermore, interannual variations occur. In Fig. 13, the summer AOD datasets for China, SE China and the 10 selected regions are divided into three periods, i.e., pre-EOS with only ATSR-2 (1995–2000), post-Envisat with only MODIS/Terra (2011–2017) and the overlap period (2000–2011, shaded light green) when both algorithms provided valid AOD retrievals. Time series for other seasons and yearly aggregates are shown in the Supplement.
The time series of the summer AOD over China (Fig. 13) show a small increase of the AOD over the years 1995–2011, with a somewhat larger tendency for MODIS than for ATSR, whereas from 2011 the MODIS data show a definite decrease. This behavior seems to be mainly determined by the AOD decrease in SE China (and regions 1–7 therein), where the AOD is substantially higher than in other parts of China, and tendencies until 2011 have a similar direction but are much stronger than over the west and north of China (regions 8–10).
Here we estimate the AOD tendencies during the overlapping period, only to establish that ATSR and MODIS time series are similar; thus, they can be used to construct a combined long-term time series. AOD tendencies during the 1995–2017 period, as related to the changes in the emission control policy in China, are presented and discussed in detail in Part 2.
For the overlapping period, linear fits were made using a MATLAB tool (https://se.mathworks.com/products/matlab.html, last access: 6 August 2018, and a detailed description of the statistics) to determine the variation of the AOD vs. time. AOD tendencies (dAOD) per decade, bias and slope for the linear regression lines, as well as the p value estimated using a t test and absolute error for linear fits are presented in Table S2 (for seasonal aggregates) and Table S3 (for annual aggregates) for all selected regions.
For both China and SE China, the annual (Fig. S4) and seasonal (Fig. 13, Figs. S1–S3) time series for ADV and MODIS are very similar, albeit with an almost constant offset with MODIS high and ADV low. When looking at the long-term time series of the yearly averaged AOD for each of the 10 regions, this behavior is replicated, with some anomalous years for each of them. The possible exception is region 8 (the Tibetan Plateau). Here the AOD is very low in comparison to other regions, with practically no interannual variation or long-term tendency. AOD tendencies during the whole period (1995–2017) will be discussed in Part 2.
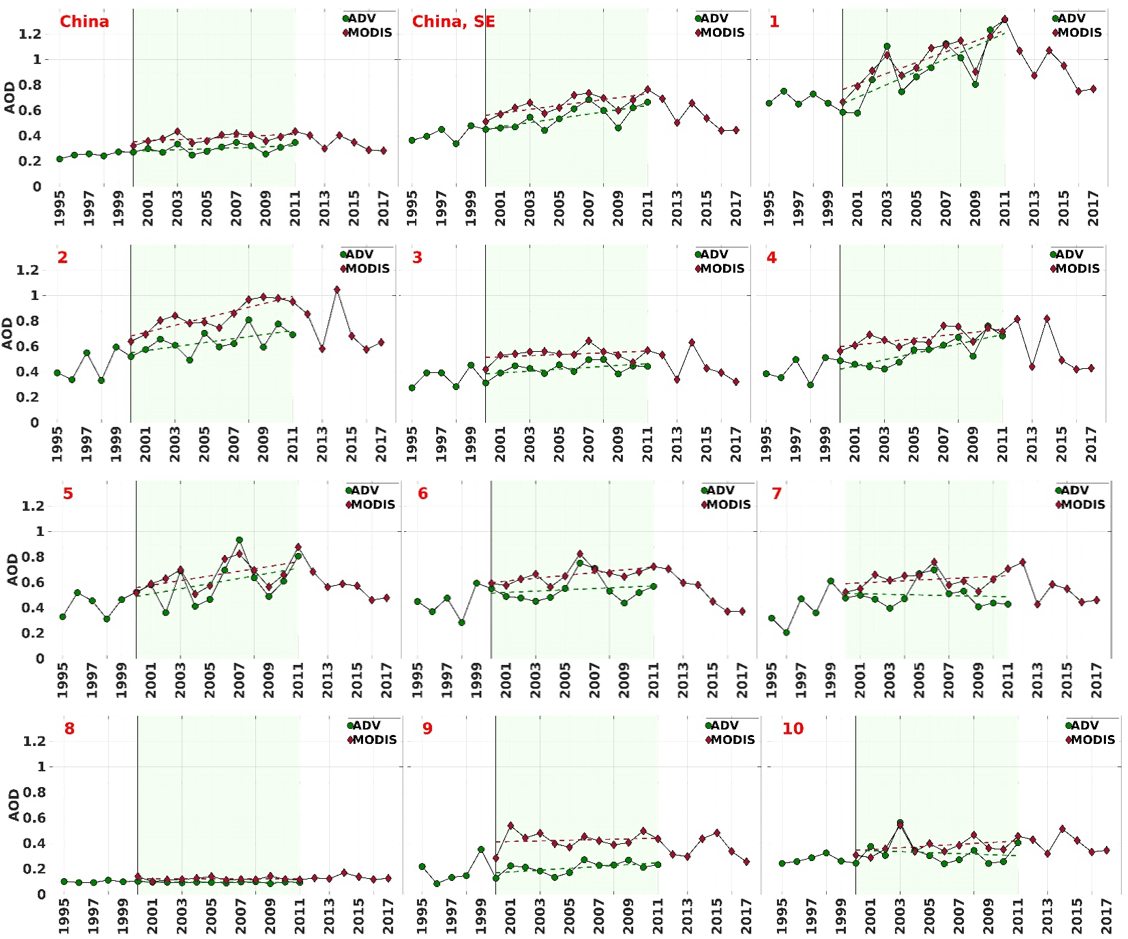
Figure 13Time series of the summer-averaged AOD over China, SE China and each of the 10 selected regions, for ADV (1995–2011, green circles) and MODIS (2000–2017, red diamonds). The overlapping period is colored light green. AOD linear fits for the overlapping periods are shown for each instrument (green and red dashed lines for ADV and MODIS, respectively). Statistics for linear fits are shown in Table S2.
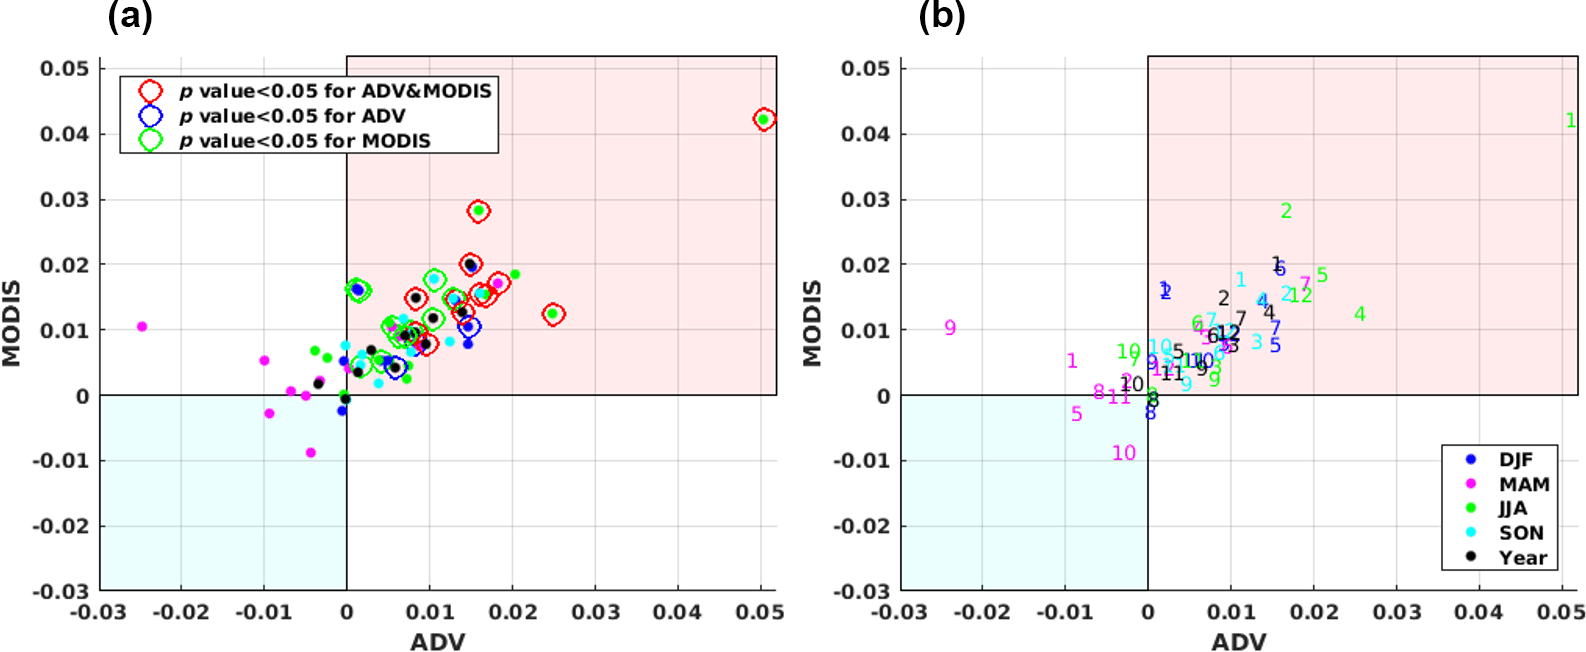
Figure 14Scatterplot of the 2000–2011 yearly tendencies (a) derived from MODIS C6.1 DBDT vs. those derived from ATSR ADV v2.31, for China, SE China and the 10 selected areas (as specified in b) for the yearly (black dots) and seasonally averaged AOD (colored dots, see legend). Colored circles indicate if the p value < 0.05 for both ADV and MODIS (red), for ADV only (blue) or for MODIS only (green).
5.3 Comparison between ATSR ADV and MODIS seasonal AOD tendencies
To compare the seasonal year-to-year behavior of the AOD retrieved with ATSR and MODIS, the AOD tendencies for the overlapping period (2000–2011) were estimated by fitting the time series with linear regression lines. The linear fit for AOD seasonal tendencies for the overlapping period for ADV and MODIS is shown in Fig. 13 and Figs. S1–S4, and the corresponding statistics are summarized in Table S2 and S3.
For the overlapping period, positive AOD tendencies were observed with both instruments over China for all seasons, except for spring, when the AOD tendency was close to zero or slightly negative. In winter, the ADV-retrieved AOD shows a strong increase (between 1.31 and 1.51 per decade) in regions 4 to 7, which represent the south and east of SE China. Interestingly, along the east coast, the AOD tendency increases in winter from north to south, as shown with ADV. MODIS shows a strong (near 0.16) AOD increase in winter in regions 1 and 2. In spring, the AOD tendencies are very low for both instruments, showing an increase in the MODIS AOD and a decrease for ADV. The highest AOD increase was observed in region 7 for both ADV and MODIS (0.181 and 0.171 per decade, respectively). In summer, a strong AOD increase is observed in region 1 for both ADV and MODIS (0.503 and 0.422 per decade, respectively). The positive AOD tendencies were higher in SE China, reaching 0.168 and 0.154 for ADV and MODIS, respectively. In autumn, the AOD tendencies were smaller for both ADV and MODIS and agreed in sign for most of the selected regions, except for region 10. Note that the AOD tendencies were statistically significant for regions 1, 2, 4 and over SE China for MODIS only.
The AOD tendencies for the overlapping period derived from MODIS are plotted in Fig. 14 vs. those derived from ATSR. This scatterplot includes tendencies for yearly and seasonal AOD aggregates (dots, see legend for colors) for China, SE China and for each of the 10 selected regions. The confidence for linear fits (p value) is indicated by the colored (with respect to p value for each instrument) circles around each symbol. The areas where both instruments show a similar tendency are denoted by a light red (both positive) and light blue (both negative) background. The same plot, but with symbols replaced with region numbers, is presented in Fig. 14b.
Most of the ADV and MODIS AOD tendencies for corresponding periods are located in the colored (red and blue) areas, which confirm that ADV and MODIS show AOD tendencies that are similar in sign during the overlapping period. The grouping of the tendency points along the 1:1 line (line is not shown here) shows that the AOD tendencies derived for ADV and MODIS are also similar in an absolute sense.
However, seasonal differences exist in the agreement between the ADV and MODIS AOD tendencies. The AOD tendencies derived from the two instruments are in good agreement in summer, autumn and annually (R is 0.87, 0.77 and 0.88, respectively). In winter and spring, the correlation coefficient is smaller (0.41).
Thus, the consistency between ATSR and MODIS with regards to the AOD tendencies in the overlapping period is rather strong in the summer, the autumn and for the yearly average, while in the winter and spring, when there is a difference in coverage between the two instruments (Table S1), the agreement in the AOD tendencies is lower.
The current research is an extension of the study by de Leeuw et al. (2018), where ATSR-retrieved AOD using ADV v2.31 for the 1995–2011 period and the MODIS/Terra C6 DBDT merged AOD product for the 2000–2015 period were explored. In this paper, the MODIS/Terra C6 DBDT merged AOD product has been replaced with the recently released collection C6.1 and extended to include 2016 and 2017. The AOD annual anomaly maps are shown and discussed, and the analysis of the seasonal variability has been extended to 10 selected regions; the AOD tendencies for the overlapping period (2000–2011) for both ADV and MODIS are presented and compared.
The main results and conclusions are summarized below.
-
The difference in AOD retrieved from ATSR-2 and AATSR is small, as shown by pixel-by-pixel, monthly means and validation results comparisons for the period from August to December 2002 over China and globally. Most of the differences fit to the measurement uncertainty requirement of the GCOS (0.03, or 10 %). This makes it possible to combine ATSR-2 and AATSR AOD time series into one dataset without offset correction.
-
Comparison with AERONET shows similar performance for both C6.1 and C6. The correlation coefficient increased slightly from 0.9 in C6 to 0.92 in C6.1, and the bias decreased slightly from 0.07 to 0.06. The AOD spatial coverage in C6.1 increased by ca. 5 % with respect to that in C6.
-
AOD validation with AERONET shows that the validation results depend on the sampling. If the sampling includes all available collocations with AERONET (1132 and 4964 points for ADV and MODIS, respectively), the validation statistics are slightly better for MODIS. The bias in both datasets is similar but with an opposite sign (0.06 for MODIS and −0.07 for ADV). However, for collocated points, when ATSR and MODIS overpasses are within ±90 min and AERONET data exist for validation, the correlation coefficient is closer between ADV and MODIS (0.92 and 0.93, respectively) for all collocated points. However, ADV performs better than MODIS in autumn, while MODIS performs slightly better in spring and summer. In winter, both ADV and MODIS underestimate AOD. For “fine-dominated” and “coarse-dominated” aerosols, validation statistics are similar for ADV and MODIS. Both products show high (>=0.85) correlation with AERONET. Similar in absolute values but different in sign, AOD bias is calculated for “fine-dominated” (−0.09 and 0.08, for ADV and MODIS, respectively) and for “coarse-dominated” (−0.11 and 0.10, for ADV and MODIS, respectively) aerosol conditions.
-
The AOD interannual variability over China was presented based on annual anomaly maps (with respect to the 2000–2011 averages). During the period from 1995 to 2006, AOD increased in SE China, while no significant changes in AOD were observed in the west or in the north. Between 2006 and 2011, AOD did not change much, showing minor minima in 2008–2009. From 2011 onward, AOD was observed to decrease in SE China.
-
Both ADV and MODIS show similar seasonal behavior, with spring AOD maxima in the south that shift from spring to summer along the eastern coast in a northerly direction.
-
Similar patterns are shown in year-to-year differences for ASTR ADV and MODIS AOD. For the overlapping period, positive AOD tendencies were observed with both instruments over China for all seasons, except for spring, when the AOD tendency was close to zero or slightly negative. More pronounced changes in AOD were confirmed for SE China. AOD changed faster in spring and autumn, compared to other seasons.
-
The consistency between ATSR and MODIS with regards to the AOD tendencies in the overlapping period was rather strong in summer, autumn and for the yearly average, while in winter and spring, when there was a difference in coverage between the two instruments, the agreement in AOD tendency was lower.
The overall conclusion is that both ATSR ADV and MODIS individually show similar spatial and temporal AOD patterns over China. That conclusion is used as a main starting point in Part 2, where the combined long-term AOD time series over China and selected areas will be introduced for the 1995–2017 period. In Part 2, AOD tendencies in the combined time series will be estimated for the periods associated with changes in air pollution control policies in China.
The ATSR data used in this research are publicly available (after registration a password will be issued) at: http://www.icare.univ-lille1.fr/ (Finnish Meteorological Institute, 2018). MODIS data are publicly available at: https://ladsweb.modaps.eosdis.nasa.gov/ (NASA, 2018a). AERONET data are available at AERONET: https://aeronet.gsfc.nasa.gov/ (NASA, 2018b).
The supplement related to this article is available online at: https://doi.org/10.5194/acp-18-11389-2018-supplement.
The whole team designed the research. LS, AKG, ER and EP performed the analysis and prepared the figures and tables. LS and GL wrote the paper with comments/contributions from the whole team.
The authors declare that they have no conflict of interest.
Work presented in this paper was undertaken as part of the Marco Polo
project supported by the EU, FP7 SPACE grant agreement no. 606953 and as
part of the GlobEmission project ESA–ESRIN Data Users Element (DUE), project
AO/1-6721/11/I-NB; it also contributes to the ESA/MOST DRAGON4 program. The ATSR
algorithm (ADV/ASV) used in this work is improved with support from ESA as
part of the Climate Change Initiative (CCI) project Aerosol_cci (ESA-ESRIN projects AO/1-6207/09/I-LG and ESRIN/400010987 4/14/1-NB).
Further support was received from the Centre of Excellence in Atmospheric
Science funded by the Finnish Academy of Sciences Excellence (project no.
272041). Many thanks are expressed to the NASA Goddard Space Flight Center
(GSFC) Level 1 and Atmosphere Archive and Distribution System (LAADS)
(http://ladsweb.nascom.nasa.gov, last access: 6 August 2018)
for making the L3 MODIS/Terra C6.1 and C6 aerosol data available. The AERONET team is acknowledged for establishing
and maintaining the AERONET sites used in this study.
Edited by: Stelios Kazadzis
Reviewed by: Andrew Sayer and two anonymous referees
AATSR Product Handbook: ESA, available at: http://envisat.esa.int/handbooks/aatsr/CNTR.html (last access: 18 June 2018), 2007.
ATSR-1/2: User Guide, available at: http://www.atsr.rl.ac.uk/documentation/docs/userguide/atsr_user_guide_rev_3.pdf (last access: 18 June 2018), 1999.
Bian, Y. X., Zhao, C. S., Ma, N., Chen, J., and Xu, W. Y.: A study of aerosol liquid water content based on hygroscopicity measurements at high relative humidity in the North China Plain, Atmos. Chem. Phys., 14, 6417–6426, https://doi.org/10.5194/acp-14-6417-2014, 2014.
Bouarar, I., Wang, X., and Brasseur, G. P.: Air Pollution in Eastern Asia: An Integrated Perspective, Springer, ISSI, 16, Bern, Switzerland, 504 pp., 2017.
Chandler, R. and Scott, M.: Statistical methods for trend detection and analysis in the environmental sciences, Wiley, 368, https://doi.org/10.1111/ejss.12105 , 2011.
Che, H., Zhang, X.-Y., Xia, X., Goloub, P., Holben, B., Zhao, H., Wang, Y., Zhang, X.-C., Wang, H., Blarel, L., Damiri, B., Zhang, R., Deng, X., Ma, Y., Wang, T., Geng, F., Qi, B., Zhu, J., Yu, J., Chen, Q., and Shi, G.: Ground-based aerosol climatology of China: aerosol optical depths from the China Aerosol Remote Sensing Network (CARSNET) 2002–2013, Atmos. Chem. Phys., 15, 7619–7652, https://doi.org/10.5194/acp-15-7619-2015, 2015.
Chen, J., Li, C., Ristovski, Z., Milic, A., Gu, Y., Islam, M. S., Wang, S., Hao, J., Zhang, H., He, C., Guo, H., Fu, H., Miljevic, B., Morawska, L., Thai, P., Lam, Y. F., Pereira, G., Ding, A., Huang, X., and Dumka, U. C.: A review of biomass burning: Emissions and impacts on air quality, health and climate in China, Sci. Total Environ., 579, 1000–1034, https://doi.org/10.1016/j.scitotenv.2016.11.025, 2017a.
Chen, S. Y., Huang, J. P., Li, J. X., Jia, R., Jiang, N. X., Kang, L. T., Ma, X. J., and Xie, T. T.: Comparison of dust emissions, transport, and deposition between the Taklimakan Desert and Gobi Desert from 2007 to 2011, Science China Earth Sciences, 60, 1338–1355, https://doi.org/10.1007/s11430-016-9051-0, 2017b.
de Leeuw, G., Sogacheva, L., Rodriguez, E., Kourtidis, K., Georgoulias, A. K., Alexandri, G., Amiridis, V., Proestakis, E., Marinou, E., Xue, Y., and van der A, R.: Two decades of satellite observations of AOD over mainland China using ATSR-2, AATSR and MODIS/Terra: data set evaluation and large-scale patterns, Atmos. Chem. Phys., 18, 1573–1592, https://doi.org/10.5194/acp-18-1573-2018, 2018.
Finnish Meteorological Institute: ATRS-2/AATSR Aerosol Optical Depth, available at: http://www.icare.univ-lille1.fr/, last access: 6 August 2018.
GCOS: Systematic Observation Requirements for Satellite-Based Data Products for Climate, 2011 Update, Supplemental Details to the Satellite-Based Component of the “Implementation Plan for the Global Observing System for Climate in Support of the UNFCCC (2010 Update)”, GCOS-154, WMO, Geneva, Switzerland, 2011.
Holben, B. N., Eck, T. F., Slutsker, I., Tanré, D., Buis, J. P., Setzer, A., Vermote, E., Reagan, J. A., Kaufman, Y., Nakajima, T., Lavenu, F., Jankowiak, I., and Smirnov, A.: AERONET – A federated instrument network and data archive for aerosol characterization, Remote Sens. Environ., 66, 1–16, 1998.
Hsu, N. C., Tsay, S. C., King, M. D., and Herman, J. R.: Aerosol properties over bright-reflecting source regions, IEEE T. Geosci. Remote, 42, 557–569, https://doi.org/10.1109/TGRS.2004.824067, 2004.
Hsu, N. C., Jeong, M.-J., Bettenhausen, C., Sayer, A. M., Hansell, R., Seftor, C. S., Huang, J., and Tsay, S.-C.: Enhanced Deep Blue aerosol retrieval algorithm: The second generation, J. Geophys. Res.-Atmos., 118, 9296–9315, https://doi.org/10.1002/jgrd.50712, 2013.
Istomina, L. G., von Hoyningen-Huene, W., Kokhanovsky, A. A., Schultz, E., and Burrows, J. P.: Remote sensing of aerosols over snow using infrared AATSR observations, Atmos. Meas. Tech., 4, 1133–1145, https://doi.org/10.5194/amt-4-1133-2011, 2011.
Jin, Y., Andersson, H., and Zhang, S.: Air Pollution Control Policies in China: A Retrospective and Prospects, edited by: Levy, J. K., Int. J. Env. Res. Pub. He., 13, 1219, https://doi.org/10.3390/ijerph13121219, 2016.
Kolmonen, P., Sogacheva, L., Virtanen, T. H., de Leeuw, G., and Kulmala, M.: The ADV/ASV AATSR aerosol retrieval algorithm: current status and presentation of a full-mission AOD data set, Int. J. Digit. Earth, 9, 545–561, https://doi.org/10.1080/17538947.2015.1111450, 2016.
Koukouli, M. E., Balis, D. S., van der A, R. J., Theys, N., Hedelt, P., Richter, A., Krotkov, N., Li, C., and Taylor, M.: Anthropogenic sulphur dioxide load over China as observed from different satellite sensors, Atmos. Environ., 145, 45–59, https://doi.org/10.1016/j.atmosenv.2016.09.007, 2016.
Kourtidis, K., Stathopoulos, S., Georgoulias, A. K., Alexandri, G., and Rapsomanikis, S.: A study of the impact of synoptic weather conditions and water vapor on aerosol-cloud relationships over major urban clusters of China, Atmos. Chem. Phys., 15, 10955–10964, https://doi.org/10.5194/acp-15-10955-2015, 2015.
Kuhlmann, J. and Quaas, J.: How can aerosols affect the Asian summer monsoon? Assessment during three consecutive pre-monsoon seasons from CALIPSO satellite data, Atmos. Chem. Phys., 10, 4673–4688, https://doi.org/10.5194/acp-10-4673-2010, 2010.
Levy, R. C., Mattoo, S., Munchak, L. A., Remer, L. A., Sayer, A. M., Patadia, F., and Hsu, N. C.: The Collection 6 MODIS aerosol products over land and ocean, Atmos. Meas. Tech., 6, 2989–3034, https://doi.org/10.5194/amt-6-2989-2013, 2013.
Li, Z., Xu, H., Li, K. T., Li, D. H., Xie, Y. S., Li, L., Zhang, Y., Gu, X. F., Zhao, W., Tian, Q. J., Deng, R. R., Su, X. L., Huang, B., Qiao, Y. L., Cui, W. Y, Hu, Y., Gong, C. L., Wang, Y. Q., Wang, X. F., Wang, J. P., Du, W. B., Pan, Z. Q., Li, Z. Z., and Bu, D.: Comprehensive study of optical, physical, chemical and radiative properties of total columnar atmospheric aerosols over China: An overview of Sun-sky radiometer Observation NETwork (SONET) measurements, B. Am. Meteorol. Soc., 99, 4, https://doi.org/10.1175/BAMS-D-17-0133.1, 2018.
Luo, Y., Zheng, X., Zhao, T., and Chen, J.: A climatology of aerosol optical depth over China from recent 10 years of MODIS remote sensing data, Int. J. Climatol., 34, 863–870, 2014.
Moeller, C., Frey, R., Borbas, E., Menzel, W. P., Wilson, T., Wu, A., and Geng, X.: Improvements to Terra MODIS L1B, L2, and L3 science products through using crosstalk corrected L1B radiances, Earth Observing Systems XXII, (5 September 2017), Proc. SPIE, 10402, 104020O, https://doi.org/10.1117/12.2274340, 2017.
NASA: MODIS/Terra Aerosol Optical Depth, available at: https://ladsweb.modaps.eosdis.nasa.gov/, last access: 6 August 2018a.
NASA: AERONET:AErosol RObotic NETwork, available at: https://aeronet.gsfc.nasa.gov/, last access: 6 August 2018b.
Proestakis, E., Amiridis, V., Marinou, E., Georgoulias, A. K., Solomos, S., Kazadzis, S., Chimot, J., Che, H., Alexandri, G., Binietoglou, I., Daskalopoulou, V., Kourtidis, K. A., de Leeuw, G., and van der A, R. J.: Nine-year spatial and temporal evolution of desert dust aerosols over South and East Asia as revealed by CALIOP, Atmos. Chem. Phys., 18, 1337–1362, https://doi.org/10.5194/acp-18-1337-2018, 2018.
Sayer, A. M., Munchak, L. A., Hsu, N. C., Levy, R. C., Bettenhausen, C., and Jeong, M.-J.: MODIS Collection 6 aerosol products: Comparison between Aqua's e-Deep Blue, Dark Target, and “merged” data sets, and usage recommendations, J. Geophys. Res.-Atmos., 119, 13965–13989, https://doi.org/10.1002/2014JD022453, 2014.
Sayer, A. M.: Interactive comment on “Two decades of satellite observations of AOD over mainland China” by Gerrit de Leeuw et al., https://doi.org/10.5194/acp-2017-838-RC1, 2017.
Sogacheva, L., Kolmonen, P., Virtanen, T. H., Rodriguez, E., Saponaro, G., and de Leeuw, G.: Post-processing to remove residual clouds from aerosol optical depth retrieved using the Advanced Along Track Scanning Radiometer, Atmos. Meas. Tech., 10, 491–505, https://doi.org/10.5194/amt-10-491-2017, 2017.
Sogacheva, L., Rodriguez, E., Kolmonen, P., Virtanen, T. H., Saponaro, G., de Leeuw, G., Georgoulias, A. K., Alexandri, G., Kourtidis, K., and van der A, R. J.: Spatial and seasonal variations of aerosols over China from two decades of multi-satellite observations. Part II: AOD time series for 1995–2017 combined from ATSR ADV and MODIS C6.1 for AOD tendencies estimation, Atmos. Chem. Phys. Discuss., https://doi.org/10.5194/acp-2018-288, in review, 2018.
Song, Y., Achberger, C., and Linderholm, H. W.: Rain-season trends in precipitation and their effect in different climate regions of China during 1961–2008, Environ. Res. Lett., 6, 034025, https://doi.org/10.1088/1748-9326/6/3/034025, 2011.
Stathopoulos, S., Georgoulias, A. K., and Kourtidis, K.: Space-borne observations of aerosol – cloud relations for cloud systems of different heights, Atmos. Res., 183, 191–201, 2017.
Uno, I., Eguchi, K., Yumimoto, K., Takemura, T., Shimizu, A., Uematsu, M., Liu, Z., Wang, Z., Hara, Y., and Sugimoto, N.: Asian dust transported one full circuit around the globe, Nat. Geosci., 2, 557–560, https://doi.org/10.1038/NGEO583, 2009.
van der A, R. J., Mijling, B., Ding, J., Koukouli, M. E., Liu, F., Li, Q., Mao, H., and Theys, N.: Cleaning up the air: effectiveness of air quality policy for SO2 and NOx emissions in China, Atmos. Chem. Phys., 17, 1775–1789, https://doi.org/10.5194/acp-17-1775-2017, 2017.
Veefkind, J. P., de Leeuw, G., and Durkee, P. A.: Retrieval of aerosol optical depth over land using two-angle view satellite radiometry during TARFOX, Geophys. Res. Lett., 25, 3135–3138, 1998.
Virtanen, T. H., Kolmonen, P., Sogacheva, L., Rodrìguez, E., Saponaro, G., and de Leeuw, G.: Collocation mismatch uncertainties in satellite aerosol retrieval validation, Atmos. Meas. Tech., 11, 925–938, https://doi.org/10.5194/amt-11-925-2018, 2018.
Wang, P., Ning, S., Dai, J., Sun, J., Lv, M., Song, Q., Dai, X., Zhao, J., and Yu, D.: Trends and Variability in Aerosol Optical Depth over North China from MODIS C6 Aerosol Products during 2001–2016, Atmosphere, 8, 223 pp., https://doi.org/10.3390/atmos8110223, 2017.
Wang, S., Xing, J., Chatani, S., Hao, J., Klimont, Z., Cofala, J., and Amann, M.: Verification of anthropogenic emissions of China by satellite and ground observations, Atmos. Environ., 45, 6347–6358, 2011.
Wang, S., Li, G., Gong, Z., Du, L., Zhou, Q., Meng, X., Xie, S., and Zhou, L.: Spatial distribution, seasonal variation and regionalization of PM2.5 concentrations in China, Sci. China Chem., 58, 1435–1443, https://doi.org/10.1007/s11426-015-5468-9, 2015.
Wang, Y., Xin, J., Li, Z., Wang, S., Wang, P., Hao, W. M., Nordgren, B. L., Chen, H., Wang, L., and Sun, Y.: Seasonal variations in aerosol optical properties over China, J. Geophys. Res., 116, D18209, https://doi.org/10.1029/2010JD015376, 2011.
Wang, X., Huang, J. P., Ji, M. X., and Higuchi, K.: Variability of East Asia dust events and their long–term trend, Atmos. Environ., 42, 3156–3165, 2008.
Wilson, T., Wu, A., Shrestha, A., Geng, X., Wang, Z., Moeller, C., Frey, R., and Xiong, X.: Development and Implementation of an Electronic Crosstalk Correction for Bands 27–30 in Terra MODIS Collection 6., Remote Sens.-Basel, 9, 569 pp., https://doi.org/10.3390/rs9060569, 2017.
Winker, D. M., Vaughan, M. A., Omar, A., Hu, Y., Powell, K. A., Liu, Z., Hunt, W. H., and Young, S. A.: Overview of the CALIPSO Mission and CALIOP Data Processing Algorithms, J. Atmos. Ocean. Tech., 26, 2310–2323, https://doi.org/10.1175/2009JTECHA1281.1, 2009.
Xin, J., Wang, Y., Pan, Y., Ji, D., Liu, Z., Wen, T., Wang, Y., Li, X., Sun, Y., Sun J., Wang, P., Wang, G., Wang, X., Cong, Z., Song, T., Hu, B., Wang, L., Tang, G., Gao, W., Guo, Y., Miao, H., Tian, S., and Wang, L.: The Campaign on Atmospheric Aerosol Research Network of China: CARE-China, B. Am. Meteorol. Soc., 96, 1137–1155, 2015.
Zhang, L., Sun, J. Y., Shen, X. J., Zhang, Y. M., Che, H., Ma, Q. L., Zhang, Y. W., Zhang, X. Y., and Ogren, J. A.: Observations of relative humidity effects on aerosol light scattering in the Yangtze River Delta of China, Atmos. Chem. Phys., 15, 8439–8454, https://doi.org/10.5194/acp-15-8439-2015, 2015.
Zhang, J., Reid, J. S., Alfaro-Contreras, R., and Xian, P.: Has China been exporting less particulate air pollution over the past decade?, Geophys. Res. Lett., 44, 2941–2948, https://doi.org/10.1002/2017GL072617, 2017.
Zhang, X., Lu, Y., Wang, Q., and Qian, X.: A high-resolution inventory of air pollutant emissions from crop residue burning in China, Atmos. Chem. Phys. Discuss., https://doi.org/10.5194/acp-2017-1113, in review, 2018.
Zhao, B., Jiang, J. H., Gu, Y., Diner, D., Worden, J., Liou, K.-N., Su, H., Xing, J., Garay, M., and Huang, L.: Decadal-scale trends in regional aerosol particle properties and their linkage to emission changes, Environ. Res. Lett., 12, 054021, https://doi.org/10.1088/1748-9326/aa6cb2, 2017.
Zhu, J. L., Liao, H., and Li, J. P.: Increases in aerosol concentrations over eastern China due to the decadal-scale weakening of the East Asian summer monsoon, Geophys. Res. Lett., 39, L09809, https://doi.org/10.1029/2012GL051428, 2012.