the Creative Commons Attribution 4.0 License.
the Creative Commons Attribution 4.0 License.
 | 14 Aug 2018
Primary and secondary organic aerosol from heated cooking oil emissions
Tengyu Liu
Zhaoyi Wang
Cooking emissions have been identified as a source of both primary organic aerosol (POA) and secondary organic aerosol (SOA). To examine the characteristics of SOA from cooking emissions, emissions from seven vegetable oils (sunflower, olive, peanut, corn, canola, soybean, and palm oils) heated at 200 ∘C were photooxidized under high-NOx conditions in a smog chamber. OA was characterized using a high-resolution time-of-flight aerosol mass spectrometer (HR-TOF-AMS). Sunflower, peanut, corn, canola, and soybean oil generated relatively low concentrations of POA (≤0.5 µg m−3) in the chamber. For palm and olive oil, positive matrix factorization (PMF) analysis separated POA and SOA better than the residual spectrum method. Temporal trends in concentrations of POA from heated palm oil were accurately predicted assuming first-order POA wall loss. However, this assumption overestimated POA concentrations from heated olive oil, which was attributed to the heterogeneous oxidation of POA. The mass spectra of the PMF resolved POA factor for palm oil, and the average POA from sunflower, peanut, corn, and canola oils were in better agreement (θ=8–12∘) with ambient cooking organic aerosol (COA) factors resolved in select Chinese megacities than those found in given European cities in the literature. The mass spectra of SOA formed from heated cooking oils had high abundances of m∕zs 27, 28, 29, 39, 41, 44, and 55 and displayed limited similarity (θ > 20∘) with ambient semi-volatile oxygenated OA (SV-OOA) factors. The entire OA data set measured herein follows a linear trend with a slope of approximately −0.4 in the Van Krevelen diagram, which may indicate oxidation mechanisms involving the addition of both carboxylic acid and alcohol or peroxide functional groups without fragmentation and/or the addition of carboxylic acid functional groups with fragmentation.
- Article
(788 KB) -
Supplement
(431 KB) - BibTeX
- EndNote


Organic aerosol (OA) contributes greatly to atmospheric particulate matter (PM) (Kanakidou et al., 2005), which influences air quality, climate, and human health (Hallquist et al., 2009). OA commonly comprises primary organic aerosol (POA) emitted directly from sources and secondary organic aerosol (SOA) formed via the oxidation of organic gases (Donahue et al., 2009). Cooking is an important source of both POA (Abdullahi et al., 2013) and SOA (Liu et al., 2018). In aerosol mass spectrometer (AMS, Aerodyne Research Incorporated, USA) measurements, cooking OA (COA) has been found to contribute 10–35 % of OA in urban areas (Allan et al., 2010; Sun et al., 2011, 2012; Ge et al., 2012; Mohr et al., 2012; Crippa et al., 2013a, b; Xu et al., 2014; Lee et al., 2015). In particular, Lee et al. (2015) found that the average contribution of COA to OA (35 %) was even higher than that of traffic-related hydrocarbon-like OA (HOA, 26 %) at a roadside site in Mong kok in Hong Kong. Xu et al. (2014) also observed higher contributions of COA (24 %) than HOA (16 %) to OA in Lanzhou, China.Although it has been reported recently that the AMS may overestimate COA, due to its higher relative ionization efficiency (1.56–3.06) than the typical value of 1.4 used for organics (Reyes-Villegas et al., 2018). Nevertheless, the contributions of COA to urban environments cannot be ignored, especially with the expectation of cleaner fleets and fuels in the future.
Although most of the COA mass spectra resolved by positive matrix factorization (PMF) analysis (Paatero, 1997; Paatero and Tapper, 1994; Ulbrich et al., 2009; Zhang et al., 2011) in the wider AMS dataset have the same basic characteristics, including predominant peaks at m∕zs 41, 43, 55, and 57 and high m∕z 55∕57 ratios, the specific COA mass spectra vary among studies (Mohr et al., 2009, 2012; Allan et al., 2010; Sun et al., 2011, 2012; Ge et al., 2012; Crippa et al., 2013a, b; Lee et al., 2015; Elser et al., 2016; Struchmeier et al., 2016; Aijala et al., 2017). Differing cooking styles may be among the factors that induce this variability in COA mass spectra. For instance, the fraction of m∕z 41 was higher than that of m∕z 43 in COA mass spectra for Chinese cooking (He et al., 2010), while the reverse was found for meat cooking (Mohr et al., 2009). Atmospheric aging may also diversify the COA mass spectra. Significantly different COA mass spectra have been resolved during summer and winter in Greece despite the fact that cooking activities are similar during the two seasons (Florou et al., 2017; Kaltsonoudis et al., 2017). In addition, the COA factors resolved by PMF analysis may include emissions from other sources (Dall'Osto et al., 2015) and sometimes cannot be separated from the other factors (Kostenidou et al., 2015; Qin et al., 2017). The multilinear engine (ME-2) is a relatively newly developed tool that can use mass spectra input from the literature to constrain the OA source apportionment solutions (Canonaco et al., 2013). Qin et al. (2017) found that inputting different COA profiles resulted in proportions of COA (to total OA) that differed by factors of up to 2. Comparing laboratory-generated COA mass spectra with ambient PMF factors can help to improve COA source apportionment. Previous studies have been focused on investigating mass spectra of POA from cooking (Mohr et al., 2009; Allan et al., 2010; He et al., 2010; Reyes-Villegas et al., 2018); however, studies exploring mass spectra of SOA from cooking remain scarce.
Recent smog chamber studies have demonstrated that cooking emissions can form large amounts of SOA via photochemical aging (Kaltsonoudis et al., 2017; Liu et al., 2017, 2018). Kaltsonoudis et al. (2017) observed similarities between aged COA mass spectra from meat charbroiling and corresponding POA mass spectra. Liu et al. (2017) also reported extensive similarities (R2 of 0.83–0.96) between mass spectra of POA and SOA from heated cooking oils. These mass spectral similarities make it difficult to separate POA and SOA from cooking in smog chamber experiments in terms of both abundance and mass spectral signatures.
PMF has been used widely to deconvolve ambient AMS datasets, but relatively less to analyze smog chamber data. Presto et al. (2014) used PMF to analyze POA and SOA from vehicle exhaust. Kaltsonoudis et al. (2017) performed PMF analysis on fresh and aged OA from meat charbroiling. However, PMF analysis has not been applied to POA and SOA from heated cooking oils.
Sage et al. (2008) developed a residual spectrum method to separate POA and SOA in diesel exhaust; this residual spectrum method assumes that all signal at m∕zs 57 and 44 is associated with POA and SOA, respectively. Chirico et al. (2010) and Miracolo et al. (2010) further improved the residual method, using the reduced ion as a POA tracer. Chirico et al. (2010) suggested that the appropriate POA tracer ion may differ for different sources. The optimal tracer ions for cooking emissions remain unknown.
This study aims to characterize POA and SOA from heated cooking oils emissions, obtain POA and SOA mass spectra via PMF analysis, and compare the resolved mass spectra with those for ambient COA-related factors from PMF. We will also explore the heterogeneous oxidation of POA from palm and olive oils.
Table 1Experimental conditions in the photochemical aging experiments.
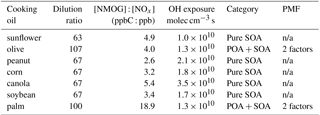
n/a – not applicable.
2.1 Smog chamber experiments
Seven photochemical aging experiments were conducted in a 30 m3 indoor smog chamber at the Guangzhou Institute of Geochemistry, Chinese Academy of Sciences (Wang et al., 2014; Liu et al., 2015, 2016; Deng et al., 2017) (Table 1). The cooking oils tested include sunflower, olive, peanut, corn, canola, soybean, and palm oils, which together constitute over 90 % of the vegetable oil consumed globally (USDA, 2017). One experiment was conducted for each oil. All experiments were conducted at 25 ∘C and a relative humidity (RH) of less than 5 %. Prior to each experiment, the chamber was continuously flushed with purified dry air for at least 48 h. The experimental procedures have been described in detail elsewhere (Liu et al., 2018). Briefly, ammonium sulfate seed particles were introduced first into the chamber to serve as condensation sinks to reduce organic vapor wall losses (Zhang et al., 2014). Then, emissions from heated vegetable oils were introduced into the chamber for 1–1.5 h by an air stream through a 2 m heated (70 ∘C) Teflon tube. The emissions were generated by heating 250 mL of the target oil at approximately 200 ∘C in a 500 mL flask in a dimethyl silicone oil bath. Nitrous acid (HONO) was then introduced into the chamber as a source of hydroxyl radical (OH). The initial ratio of non-methane organic gases (NMOGs) to NOx (NMOG : NOx) fell largely between 2.6 and 5.4 ppbC : ppb, except for the palm oil experiment, in which it was 18.9 ppbC : ppb. These ratios were larger than the typical urban ratio of ∼3 (Gordon et al., 2014). After the primary emissions had been characterized for at least 1 h, photochemical aging was initiated by exposing the emissions to black lights (60 W Philips/10R BL365, Royal Dutch Philips Electronics Ltd., the Netherlands) for 2–4.5 h.
Gas monitors were used to measure the concentrations of NOx and O3 every 1 min (EC9810, 9841T, Ecotech, Australia). NMOGs were characterized using a commercial proton-transfer-reaction time-of-flight mass spectrometer (PTR-TOF-MS, Model 2000, H3O+ reagent ion, Ionicon Analytik GmbH, Austria) (Lindinger et al., 1998; Jordan et al., 2009). Detailed descriptions of operating conditions, calibrations, and fragmentation corrections can be found elsewhere (Liu et al., 2018). The decay of acrolein or heptadienal was used to determine the OH concentration in the chamber.
A scanning mobility particle sizer (SMPS, TSI Incorporated, USA, classifier model 3080, CPC model 3775) was used to measure particle number concentrations and size distributions every 135 s. The chemical composition of submicron non-refractory particulate matter (NR-PM1) was characterized using a high-resolution time-of-flight aerosol mass spectrometer (hereafter AMS, Aerodyne Research Incorporated, USA) (DeCarlo et al., 2006). The instrument alternated between the high-sensitivity V-mode and the high-resolution W-mode every 1 min. The Squirrel 1.57I and Pika 1.16I toolkits were used in IGOR (Wavemetrics Inc., USA) to analyze the AMS data; the Aiken et al. (2008) fragmentation table was adopted. Elemental ratios, such as the hydrogen-to-carbon ratio (H : C) and oxygen-to-carbon ratio (O : C), were determined using the improved ambient method (Canagaratna et al., 2015). HEPA-filtered particle-free air from the chamber was measured for at least 20 min before and after each experiment to determine the major gas signals. The ionization efficiency was calibrated using 300 nm ammonium nitrate particles.
2.2 Separating POA and SOA
The experiments in this study were classified into two groups (Table 1). Sunflower, peanut, corn, canola, and soybean oil emissions produced low POA concentrations (< 0.5 µg m−3) in the smog chamber. Due to wall losses, the POA concentration was close to the AMS detection limit when the lights were turned on (e.g., the sunflower oil experiment in Supplement Fig. S1). These experiments were thus assumed to involve only SOA. POA and SOA mixtures were present in the palm and olive oil experiments, which produced maximum POA concentrations of 14 and 39 µg m−3, respectively. PMF analysis (Paatero, 1997; Paatero and Tapper, 1994) was performed on the high-resolution mass spectra (m∕zs 12–160) to deconvolve the POA and SOA factors following the procedure of Ulbrich et al. (2009). PMF solutions were examined for 1 to 5 factors with fPeak values varying from −1 to 1. Diagnostic plots are shown for all datasets in Figs. S2 and S3. After examining the PMF residuals, time series for different numbers of factors, and mass spectral similarity between PMF POA and observed POA spectra, 2-factor solutions with fPeak values of −0.2 and 0 were chosen for the palm and olive oil experiments, respectively.
The residual spectrum method (Sage et al., 2008; Chirico et al., 2010; Miracolo et al., 2010; Presto et al., 2014) was used in addition to PMF analysis to separate the POA and SOA. The residual method assumes that all tracer ion signal (e.g., ) is associated with POA and that the chemical composition of POA remains constant throughout the entire experiment. The mass concentration of POA at time t can then be calculated using the following equation:
where OMt0 is the total organic matter concentration at time t=0, and Iont and Iont0 are the organic mass signals of a specific POA tracer ion at time t and time t=0 (lights on), respectively. is typically chosen as the POA tracer for combustion sources (Sage et al., 2008; Chirico et al., 2010; Miracolo et al., 2010; Presto et al., 2014); the optimal tracer ion for cooking emissions remain unclear. The tracer ions tested in this study include , , , , , and .
3.1 POA–SOA split
Figure 1 shows measured OA time series for the palm and olive oil experiments; the OA concentrations were not corrected for particle wall loss. The experiments typically involved introduction of the cooking emissions to the chamber (∼1–1.5 h), characterization of primary emissions (∼1–2 h), and photochemical aging (2–4.5 h). In the palm oil experiment, the POA concentration increased rapidly during the first ∼1.6 h of the emission introduction period, reaching approximately 14 µg m−3. The POA concentration then decreased to ∼9 µg m−3 due to wall losses. SOA was quickly formed after photochemical aging was initiated at t=0, and the OA concentration increased by a factor of 5 in less than 1 h. Similarly, the particle numbers decreased rapidly due to wall loss before the lights were switched on and the mode particle diameters grew rapidly after SOA formation (Fig. S4). The maximum POA concentration in the olive oil experiment was approximately two times higher than that in the palm oil experiment, and the maximum OA concentration was ∼50 % of that in the palm oil experiment via SOA formation. Palm oil produced SOA more efficiently than did olive oil; this is consistent with our previous study, which found that the SOA production rate of palm oil was 4 times that of olive oil, likely due to the higher abundance of SOA precursors in palm oil emissions (Liu et al., 2018).
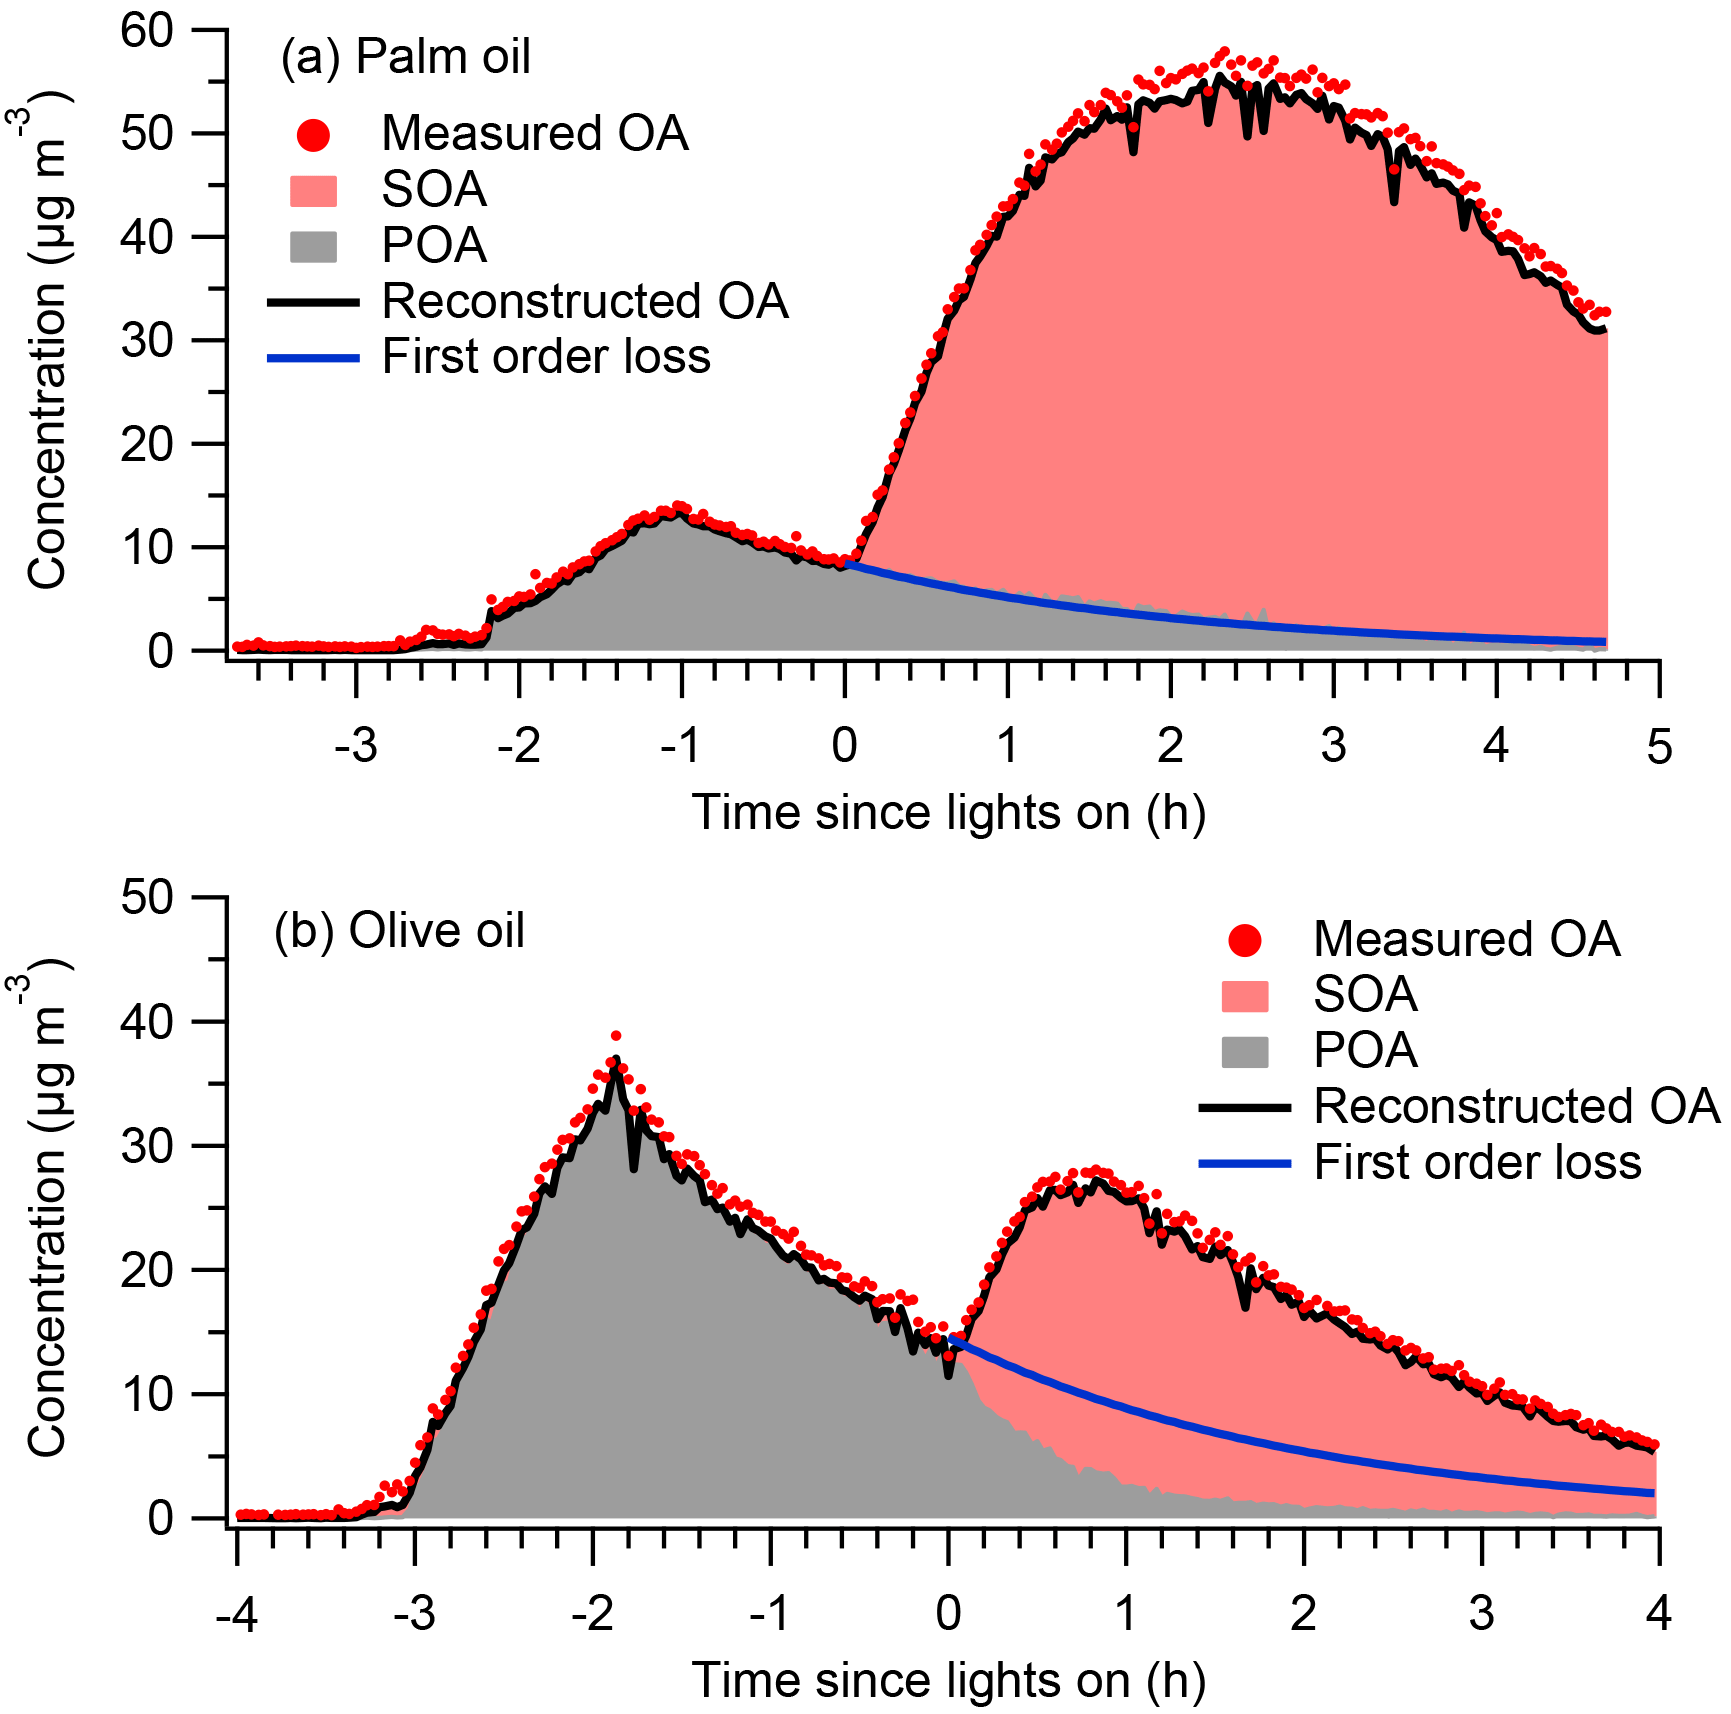
Figure 1Time series of measured OA, PMF factors, and POA concentrations assuming first-order loss of POA to the walls for (a) palm and (b) olive oil experiments. Concentrations were not corrected for particle wall loss.
Figure 1 also shows time series of measured OA, resolved PMF factors, and POA concentrations assuming first-order loss of POA to the walls. Two factors, namely POA and SOA, were identified. Solutions with three or more factors introduced physically inexplicable factors and did not improve the PMF performance (Fig. S5). Overall, the OA reconstructed by PMF accurately captured the trends in measured OA throughout the experiment. The sum of the residual was generally less than 2 µg m−3, resulting in ratios of total residual concentration (ΣResidual) to total OA concentration (ΣOA) of less than 5 % (Figs. S2 and S3). The separation of POA and SOA factors was reasonable and interpretable. During the introduction and characterization of cooking emissions (t < 0), the concentrations of SOA should be, by definition, exactly zero. The concentrations of the resolved SOA factors were approximately 0.3 µg m−3, capturing the expected behavior.
In previous smog chamber studies of dilute emissions from combustion sources (Weitkamp et al., 2007; Gordon et al., 2014; Liu et al., 2015, 2016), POA was typically assumed to be inert, and POA concentrations followed first-order wall loss equations. Figure 1 shows POA concentrations after the onset of photooxidation assuming first-order wall loss. The wall loss rate constants were determined from the decay of POA during the primary emissions characterization period. For palm oil, the predicted POA concentrations agreed well with the PMF POA factor, suggesting that the assumption of POA inertness was reasonable. However, for olive oil, the concentration of the PMF POA factor was significantly lower after the onset of photooxidation (t=0) than the POA concentration predicted assuming first-order wall losses. The PMF POA factor decreased rapidly in the first hour after t=0, which may have been due to the heterogeneous oxidation of POA. Kaltsonoudis et al. (2017) observed similar changes in POA concentrations when emissions from meat charbroiling were exposed to OH levels similar to those used in this experiment. Nah et al. (2013) also observed rapid heterogeneous OH oxidation of select cooking POA components such as oleic acid and linoleic acid. The differences in POA behavior may have arisen from the different chemical compositions, and corresponding differences in reactivity, of POA from olive and palm oils.
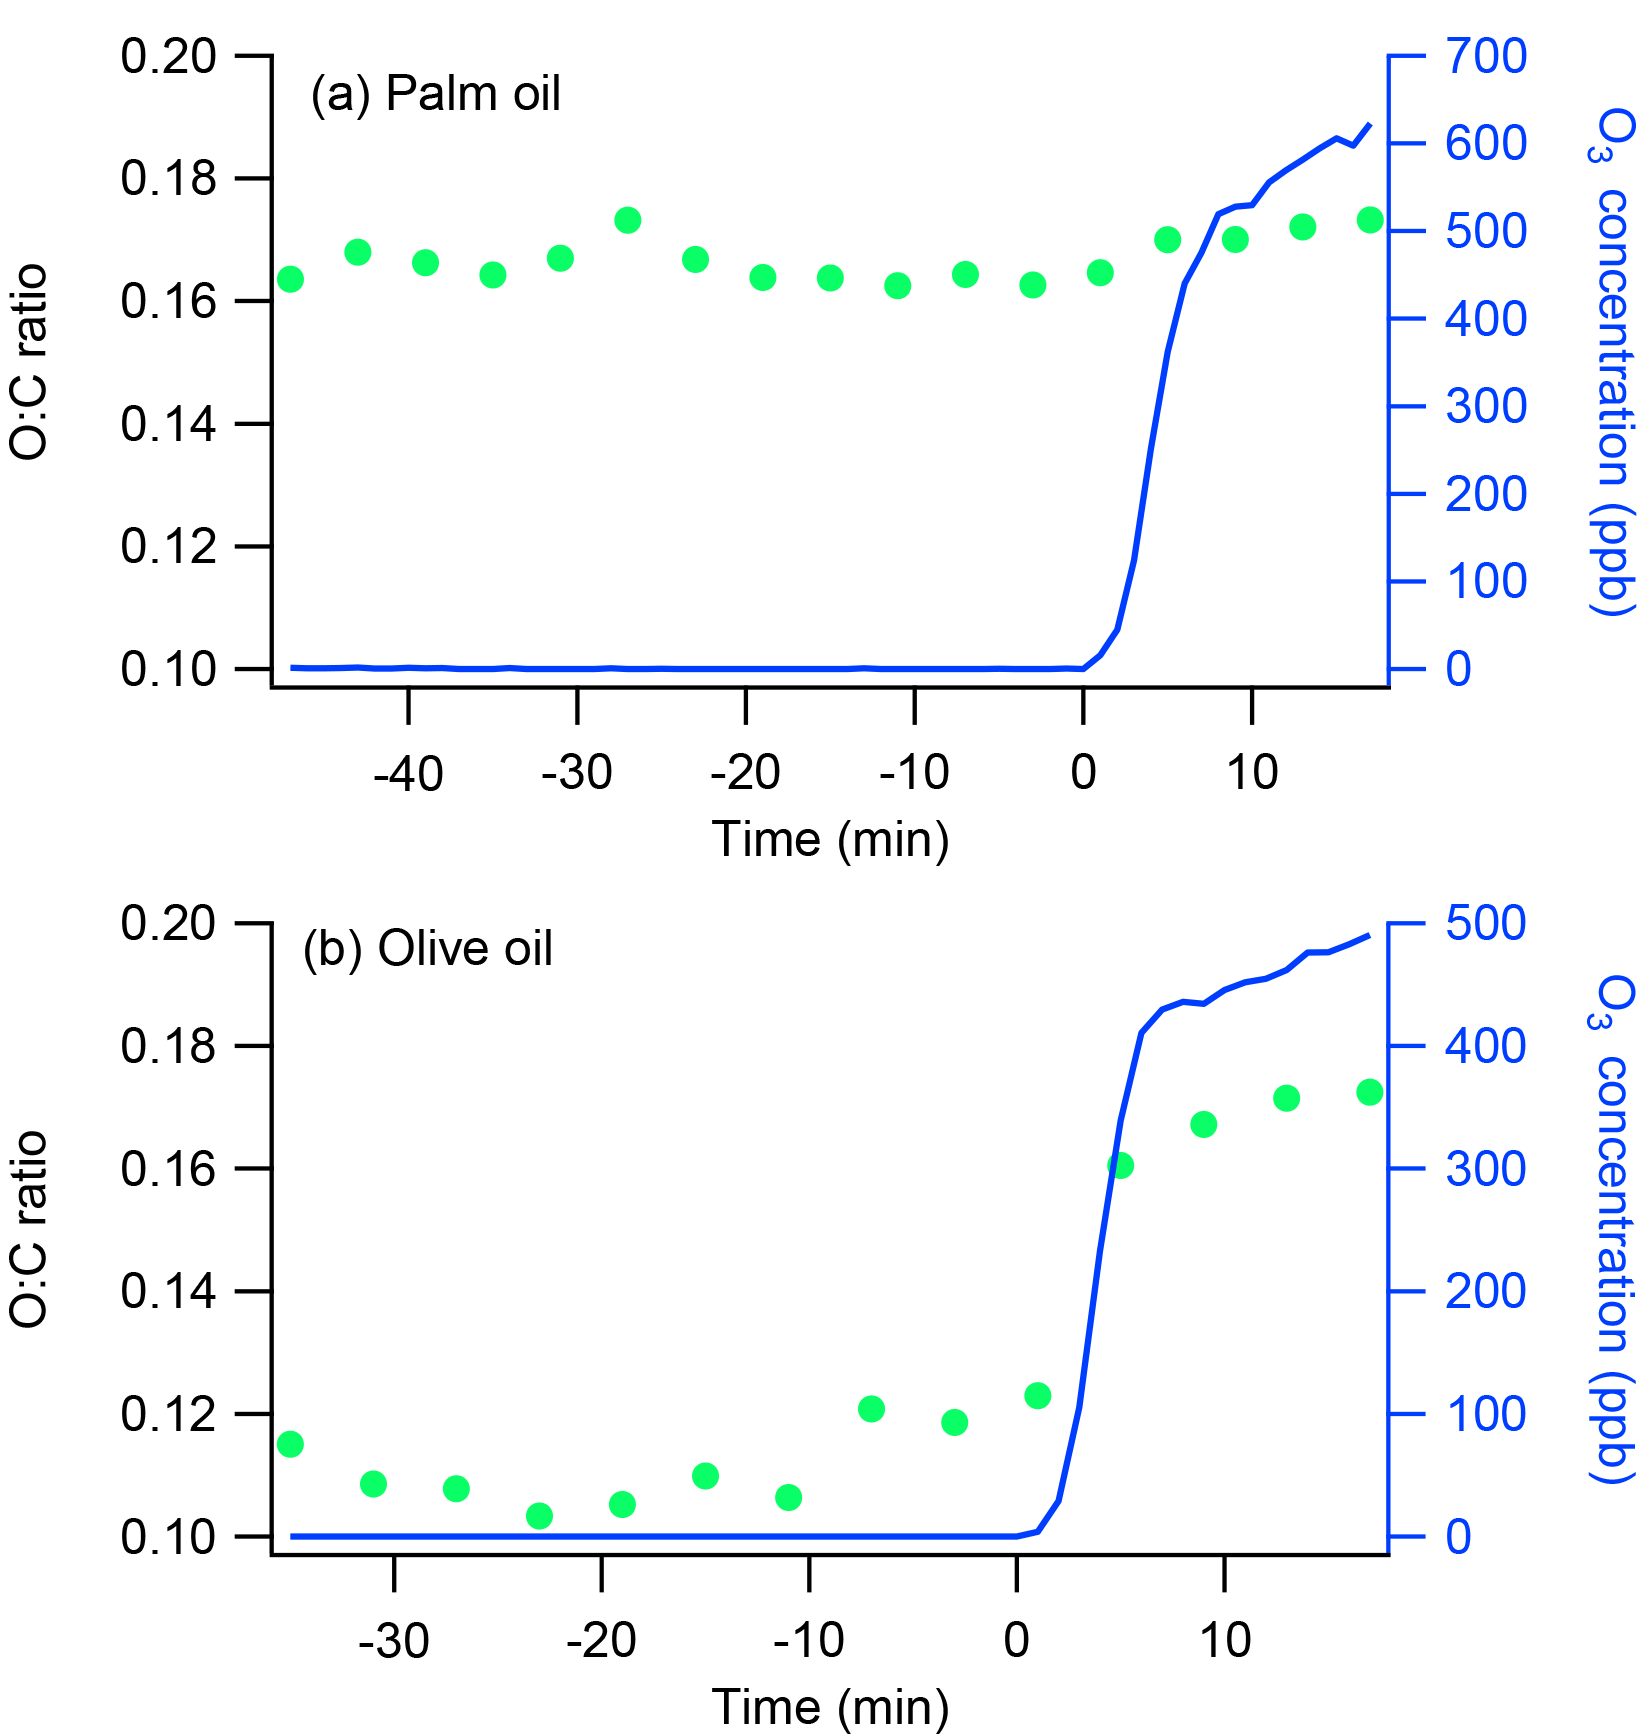
Figure 2Time series of O : C ratios and O3 concentrations for oxidation flow reactor ozonolysis experiments with (a) palm and (b) olive oil. The ozonolysis experiments involved exposing emissions from palm or olive oil to high concentrations of O3 in an oxidation flow reactor. The emissions first passed continuously through the reactor for at least 30 min and then were exposed to 500–600 ppb ozone for another 17 min. Ozone was introduced at time t=0.
To validate the differences in heterogeneous oxidation reactivity between POA from palm and olive oils, two additional ozonolysis experiments were conducted separately using an oxidation flow reactor. Emissions generated in the flask were first passed continuously through the reactor for at least 30 min and then exposed to 500–600 ppb of ozone (O3) for another 17 min. The total flow rate and residence time in the flow reactor were 6 L min−1 and 75 s, respectively. OH radicals were not present in these experiments. Previous work has demonstrated that exposing gas-phase emissions from heated cooking oils to O3 does not lead to SOA formation (Liu et al., 2017). Therefore, any changes in OA chemical composition during these ozonolysis experiments were attributed to heterogeneous oxidation. Figure 2 shows time series of O : C ratios and O3 concentrations during the ozonolysis experiments. The olive oil O : C ratio increased from 0.11 to 0.17 after the emissions were exposed to O3 for 17 min; no obvious changes were observed in the palm oil O : C ratio. These results demonstrate that POA from olive oil undergoes heterogeneous ozone oxidation more readily than POA from palm oil. The olive oil POA may contain more abundant unsaturated organic species, which are expected to react quickly with OH radicals (Atkinson and Arey, 2003).
Figure 3 shows POA concentrations obtained using the residual method with different POA tracer ions, along with the PMF-derived POA factors. For the palm oil experiment, the residual method overestimated the POA concentrations (compared with PMF) using all of the different tracer ions. For the olive oil experiment, the residual method accurately predicted the POA concentrations before the lights were turned on using different tracer ions. However, after photochemical aging began, the residual method did not agree with the PMF results. Using as a POA tracer, the residual method captured the changes in POA during the first 1 h, but overestimated the POA concentrations by as much as a factor of 2 for the remainder of the experiment; use of the other ions led to significant POA concentration overestimation in comparison with the PMF-resolved POA concentrations. The POA concentrations determined using , , and were higher even than those estimated for first-order POA loss; this may be attributed to the presence of these ions in SOA, which is then incorrectly allocated to POA by the residual method. These observations indicate that the use of associated tracer ions to calculate POA is not valid for the photochemical aging of cooking oil emissions.
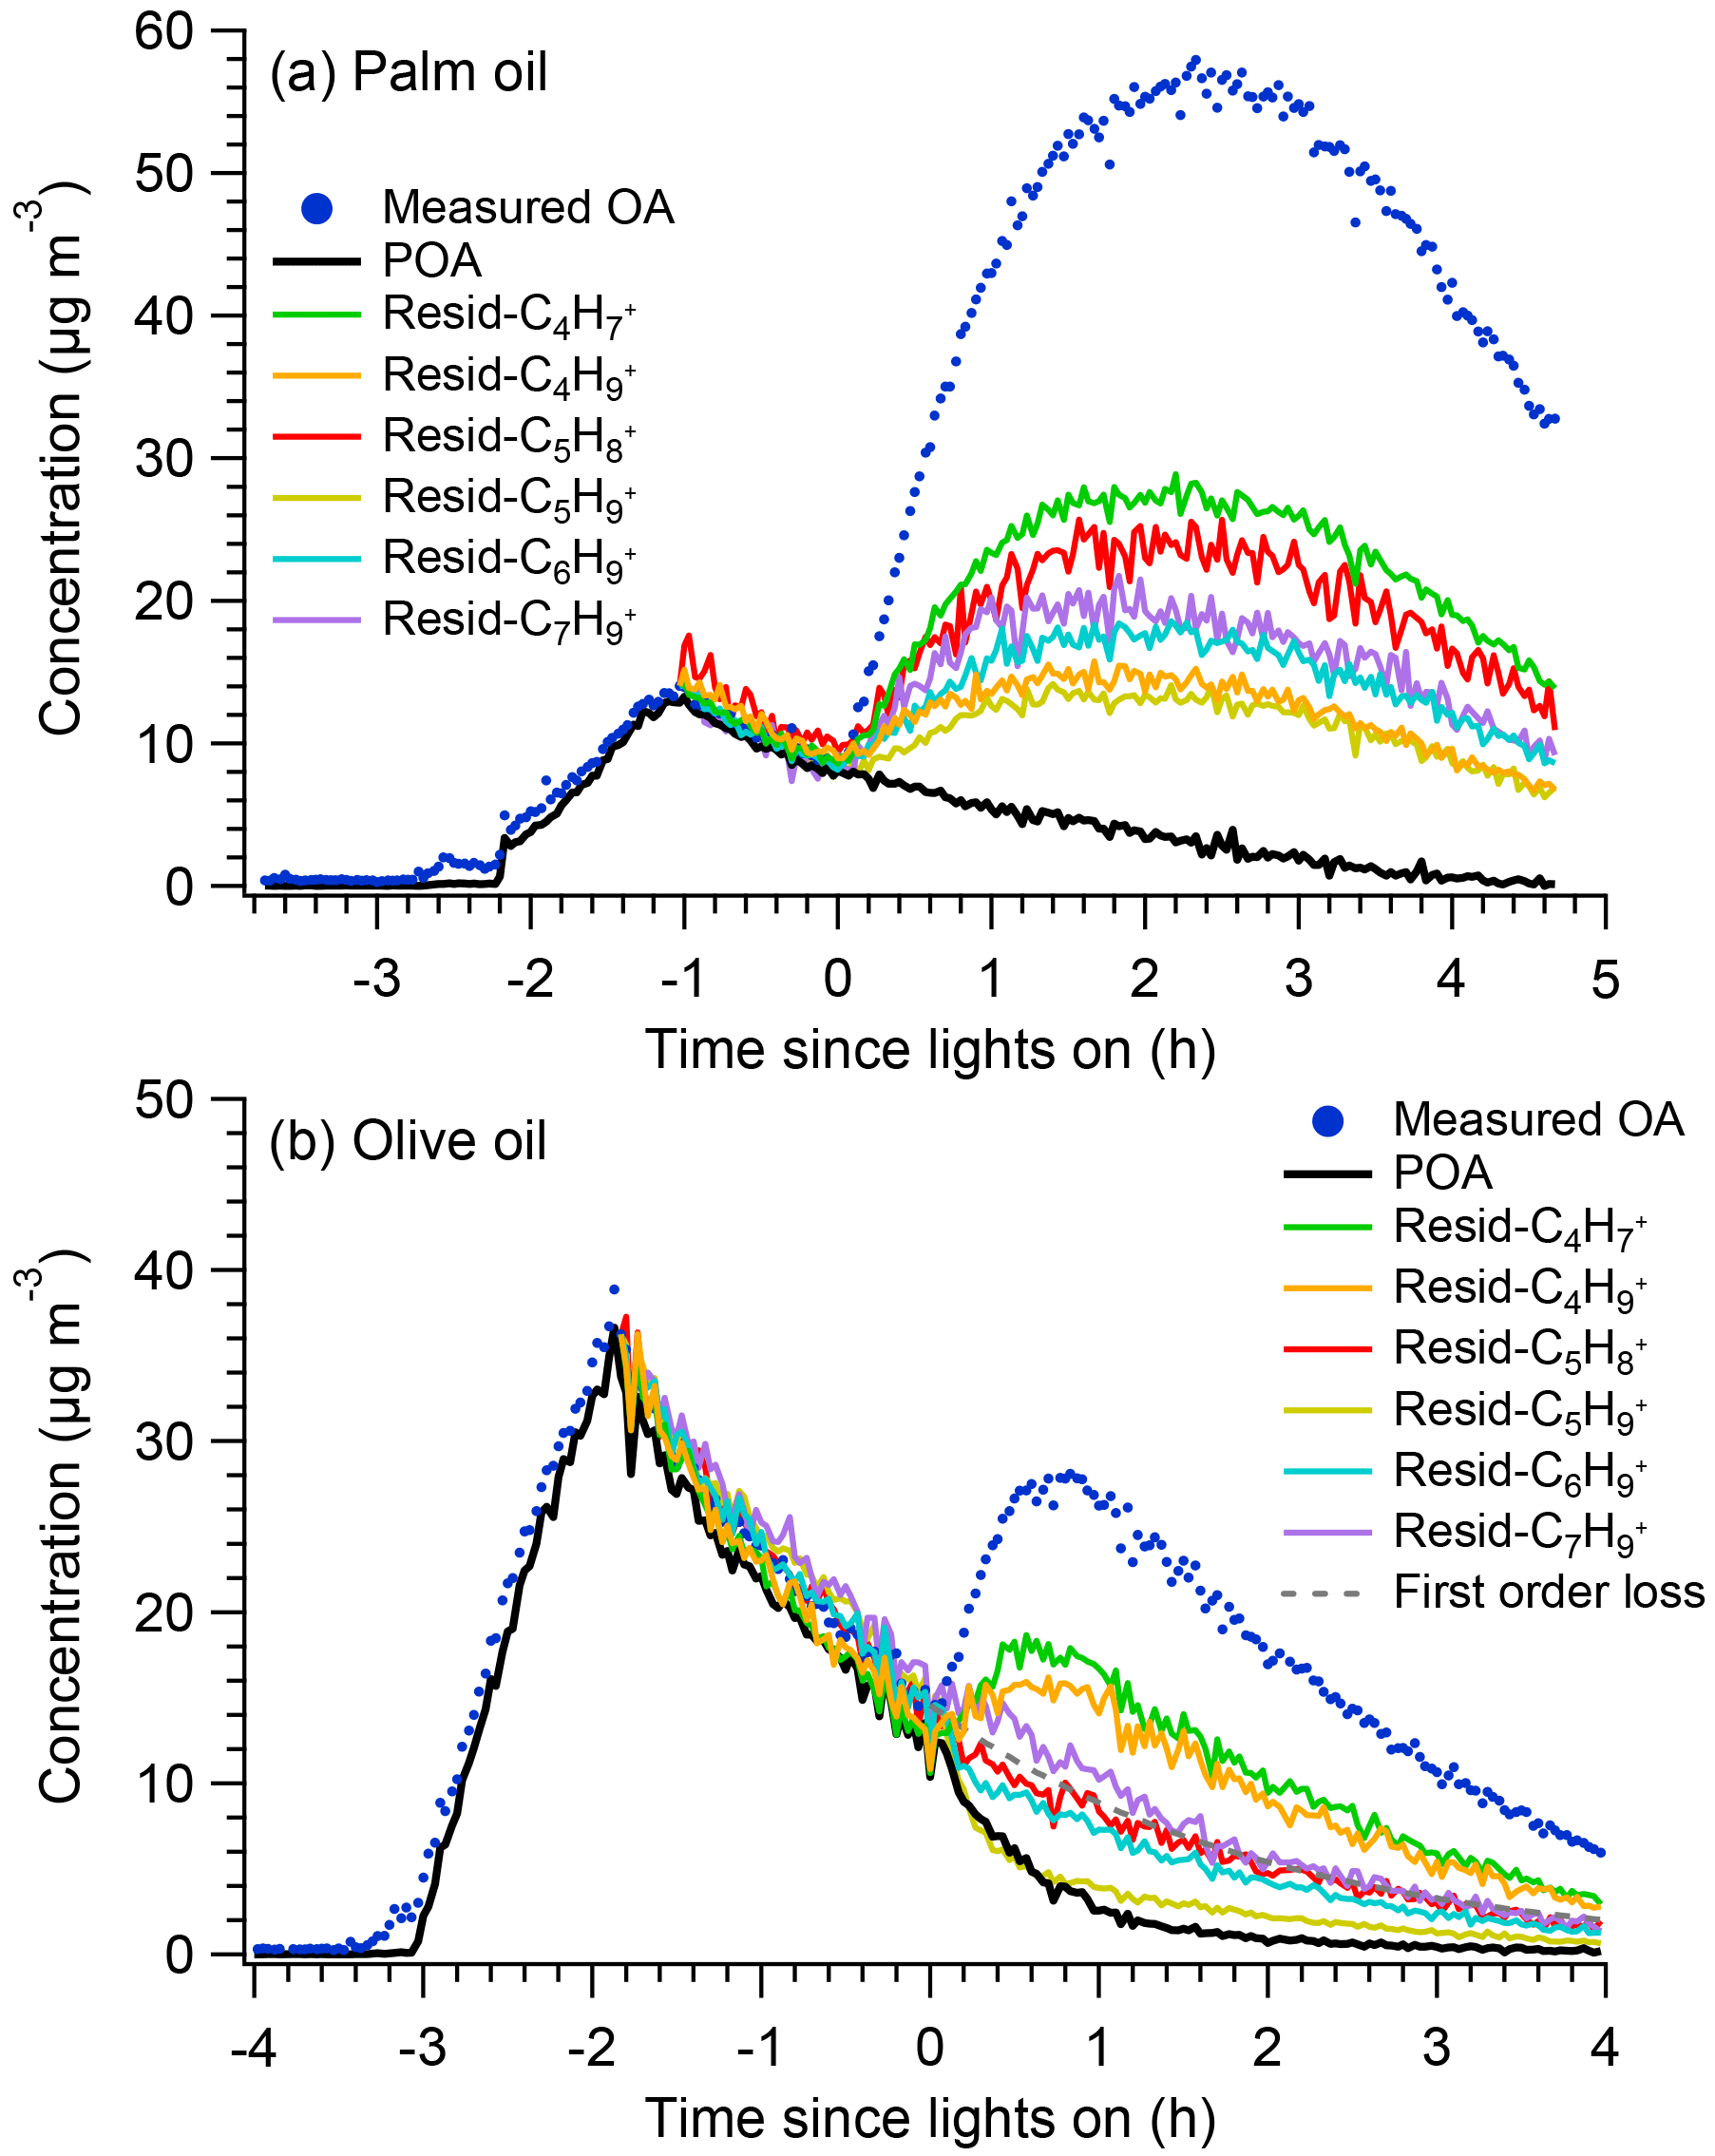
Figure 3Time series of measured OA, PMF-derived POA factors, and POA determined using the residual method for (a) palm and (b) olive oil experiments.
Overall, PMF analysis effectively separated POA and SOA from heated cooking oils. The traditional method, which assumes first-order POA wall loss, worked well when the POA was inert, as in the palm oil experiment, but greatly overestimated the POA concentration in the olive oil experiment, which was attributed to the occurrence of heterogeneous oxidation. The residual method failed to capture the POA concentrations using any of the different POA tracer ions due to the presence of these ions in the SOA mass spectrum.
3.2 Mass spectra of PMF-resolved factors
Figure 4 shows mass spectra of POA emissions and PMF-derived POA factors from the olive and palm oils. These were also compared to the average mass spectrum of POA emitted from heated sunflower, peanut, corn, and canola oils obtained from Liu et al. (2017). Overall, for both oils, the POA factor mass spectra agreed very well with the directly measured POA spectra. For both oil types, the θ angles between the factor and measured mass spectra were less than 5∘; generally, θ angles of 0–5, 5–10, 10–15, 15–30, and > 30∘ indicate excellent agreement, good agreement, many similarities, limited similarities, and poor agreement, respectively, between two mass spectra (Kostenidou et al., 2009; Kaltsonoudis et al., 2017). The PMF analysis slightly underestimated the mass fraction at m∕z 28 and slightly overestimated the mass fractions at m∕zs 41 and 55 in both experiments.
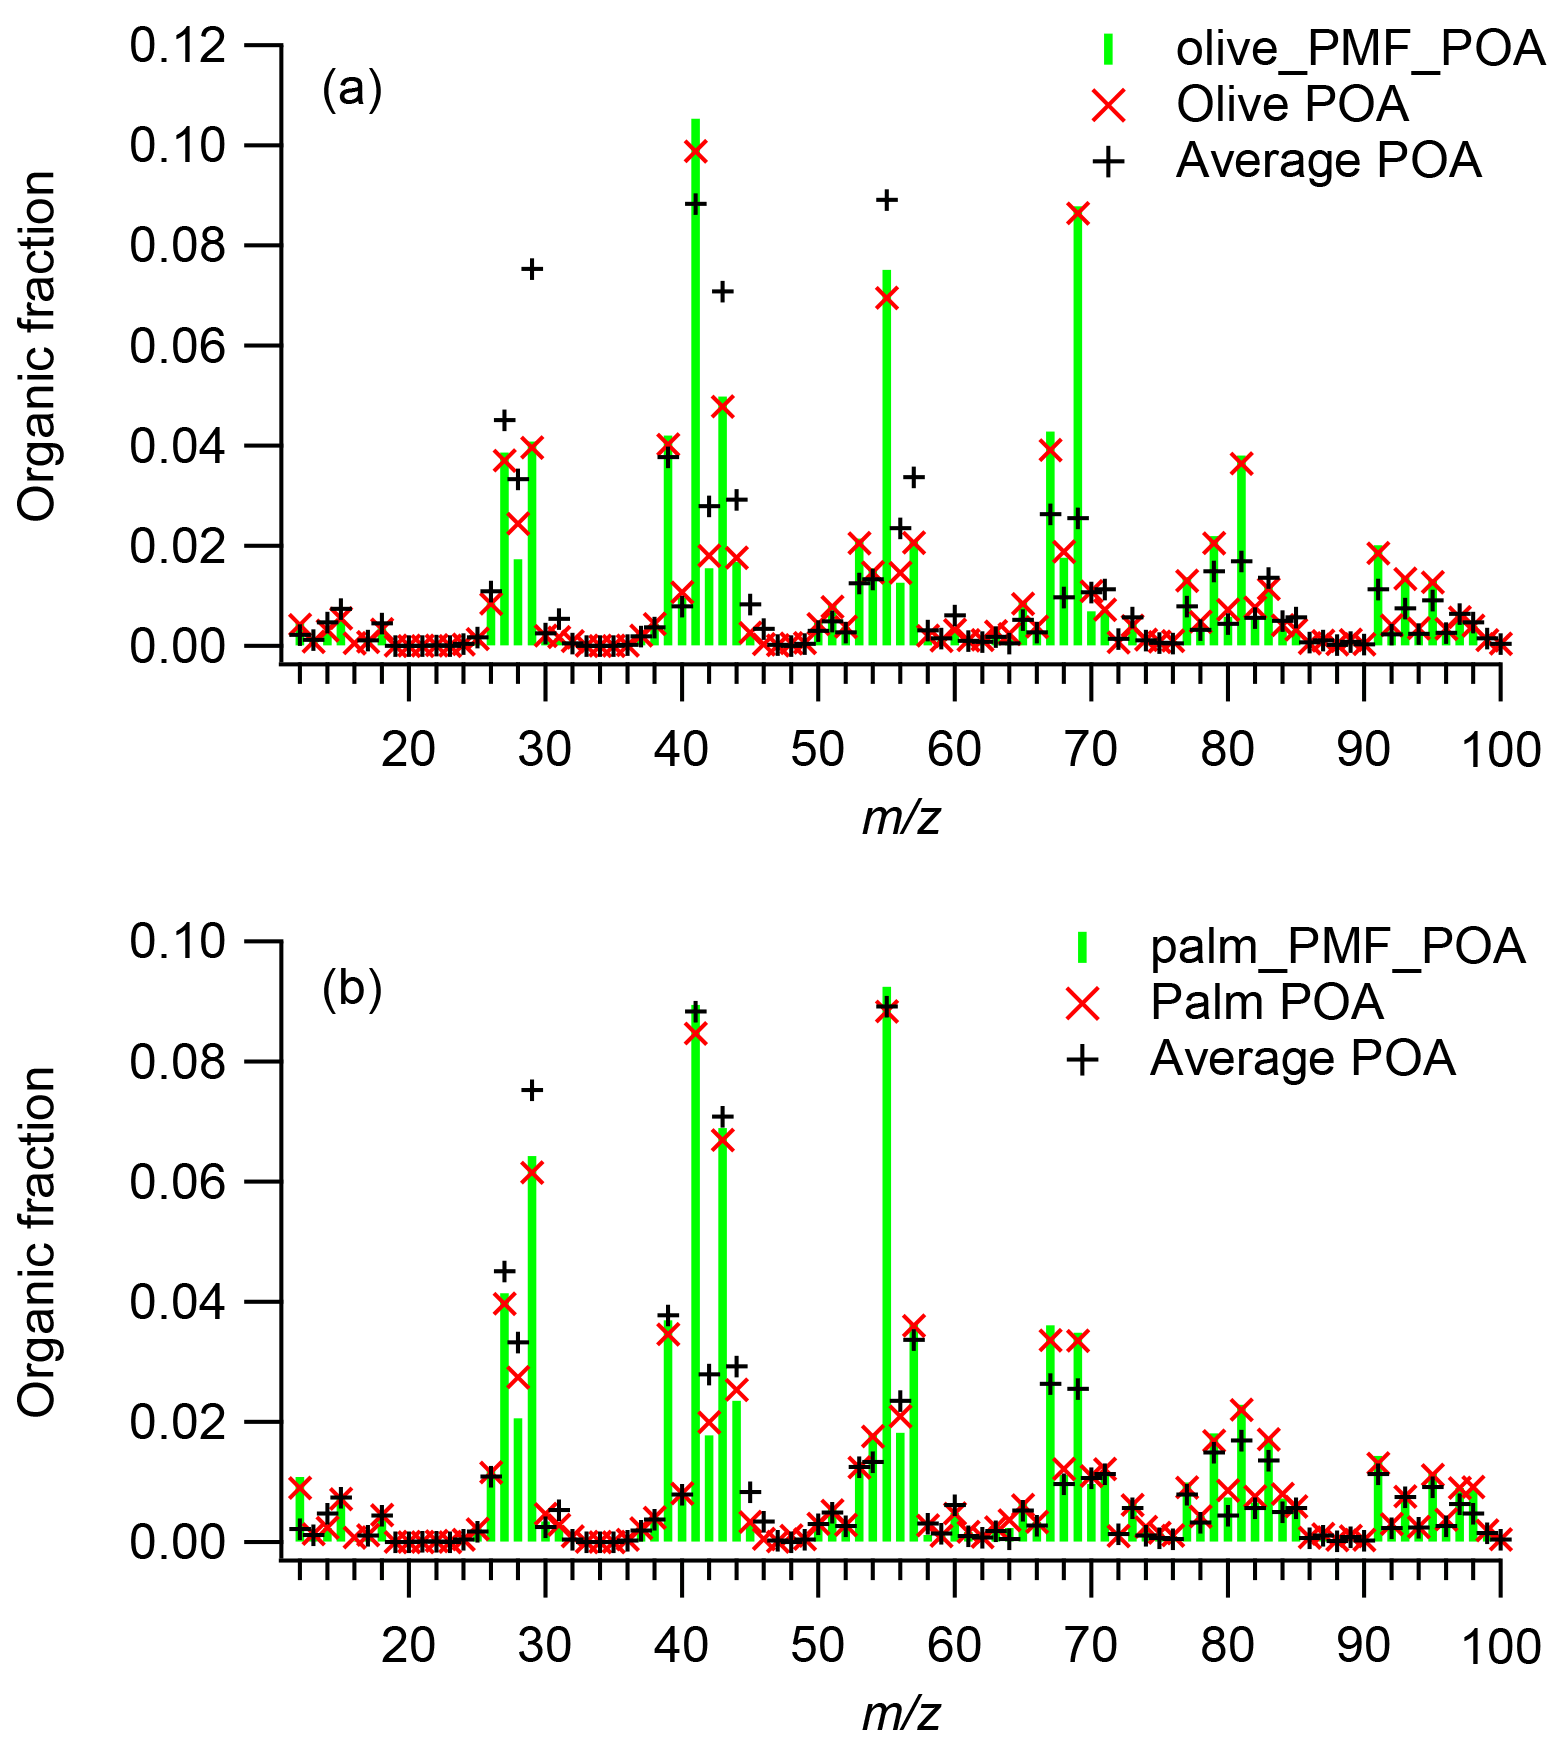
Figure 4Mass spectra of POA emissions and PMF-derived POA factors for (a) olive and (b) palm oil and, for comparison, the average mass spectrum of POA emissions from sunflower, peanut, corn, and canola oils obtained from Liu et al. (2017).
The olive oil POA factor was dominated by m∕z 41 (f41=0.105), followed by m∕zs 69 (f69=0.088), 55 (f55=0.075), and 43 (f43=0.050). In the high-resolution mass spectra, the most abundant ions in these unit masses were , , , and , respectively (Fig. S6). The olive oil POA factor mass spectrum showed limited similarity () to the average POA mass spectrum for the other cooking oils. The m∕z 69 abundance in the POA factor was significantly higher than those (average f69=0.026) in POA from other oils, while the mass fractions of m∕zs 29, 43, and 55 were generally lower. The mass spectrum of olive oil POA measured directly in this study also exhibited poor agreement () with olive oil POA mass spectra measured in an oxidation flow reactor (Liu et al., 2017) (Fig. S7). The mass spectral differences between this study and Liu et al. (2017) may have arisen from the different oil heating temperatures and dilution conditions.
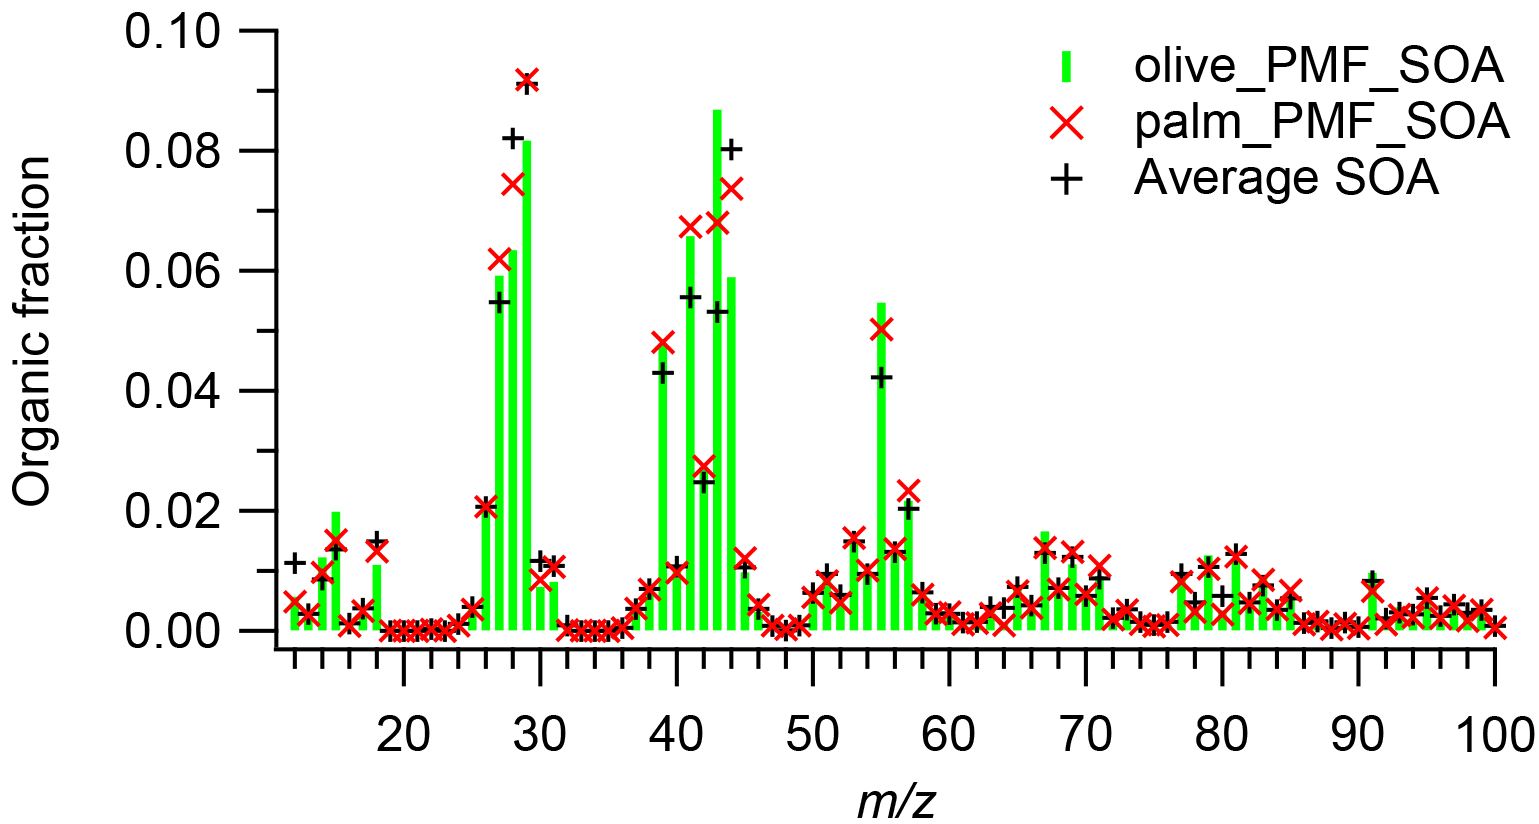
Figure 5Mass spectra of PMF-derived SOA factors for olive and palm oil and, for comparison, the average mass spectrum of SOA formed from sunflower, peanut, corn, canola, and soybean oils. The SOA mass spectra were averaged over a 10 min period after the OA concentration reached its maximum.
The palm oil POA factor was dominated by m∕z 55 (f55=0.092), followed by m∕zs 41 (f41=0.089) and 43 (f43=0.069); the most abundant ions in these unit masses were , , and , respectively (Fig. S6). The high abundances of m∕zs 41 and 55 are similar to previous studies showing POA emissions from heated peanut, canola, and sunflower oils (Allan et al., 2010), Chinese cooking (He et al., 2010), and meat charbroiling (Kaltsonoudis et al., 2017). The POA factor mass spectrum exhibited good agreement () with the average mass spectrum of POA from other cooking oils, although the POA factor had relatively higher mass fractions of m∕zs 67 and 69 and lower abundances of m∕zs 28 and 29. The palm oil POA factor had higher abundances of oxygen-containing ions such as CO+, CHO+, , and C3H3O+ than did the olive oil POA factor, resulting in a relatively higher O : C ratio (palm O : C = 0.15; olive O : C = 0.09).
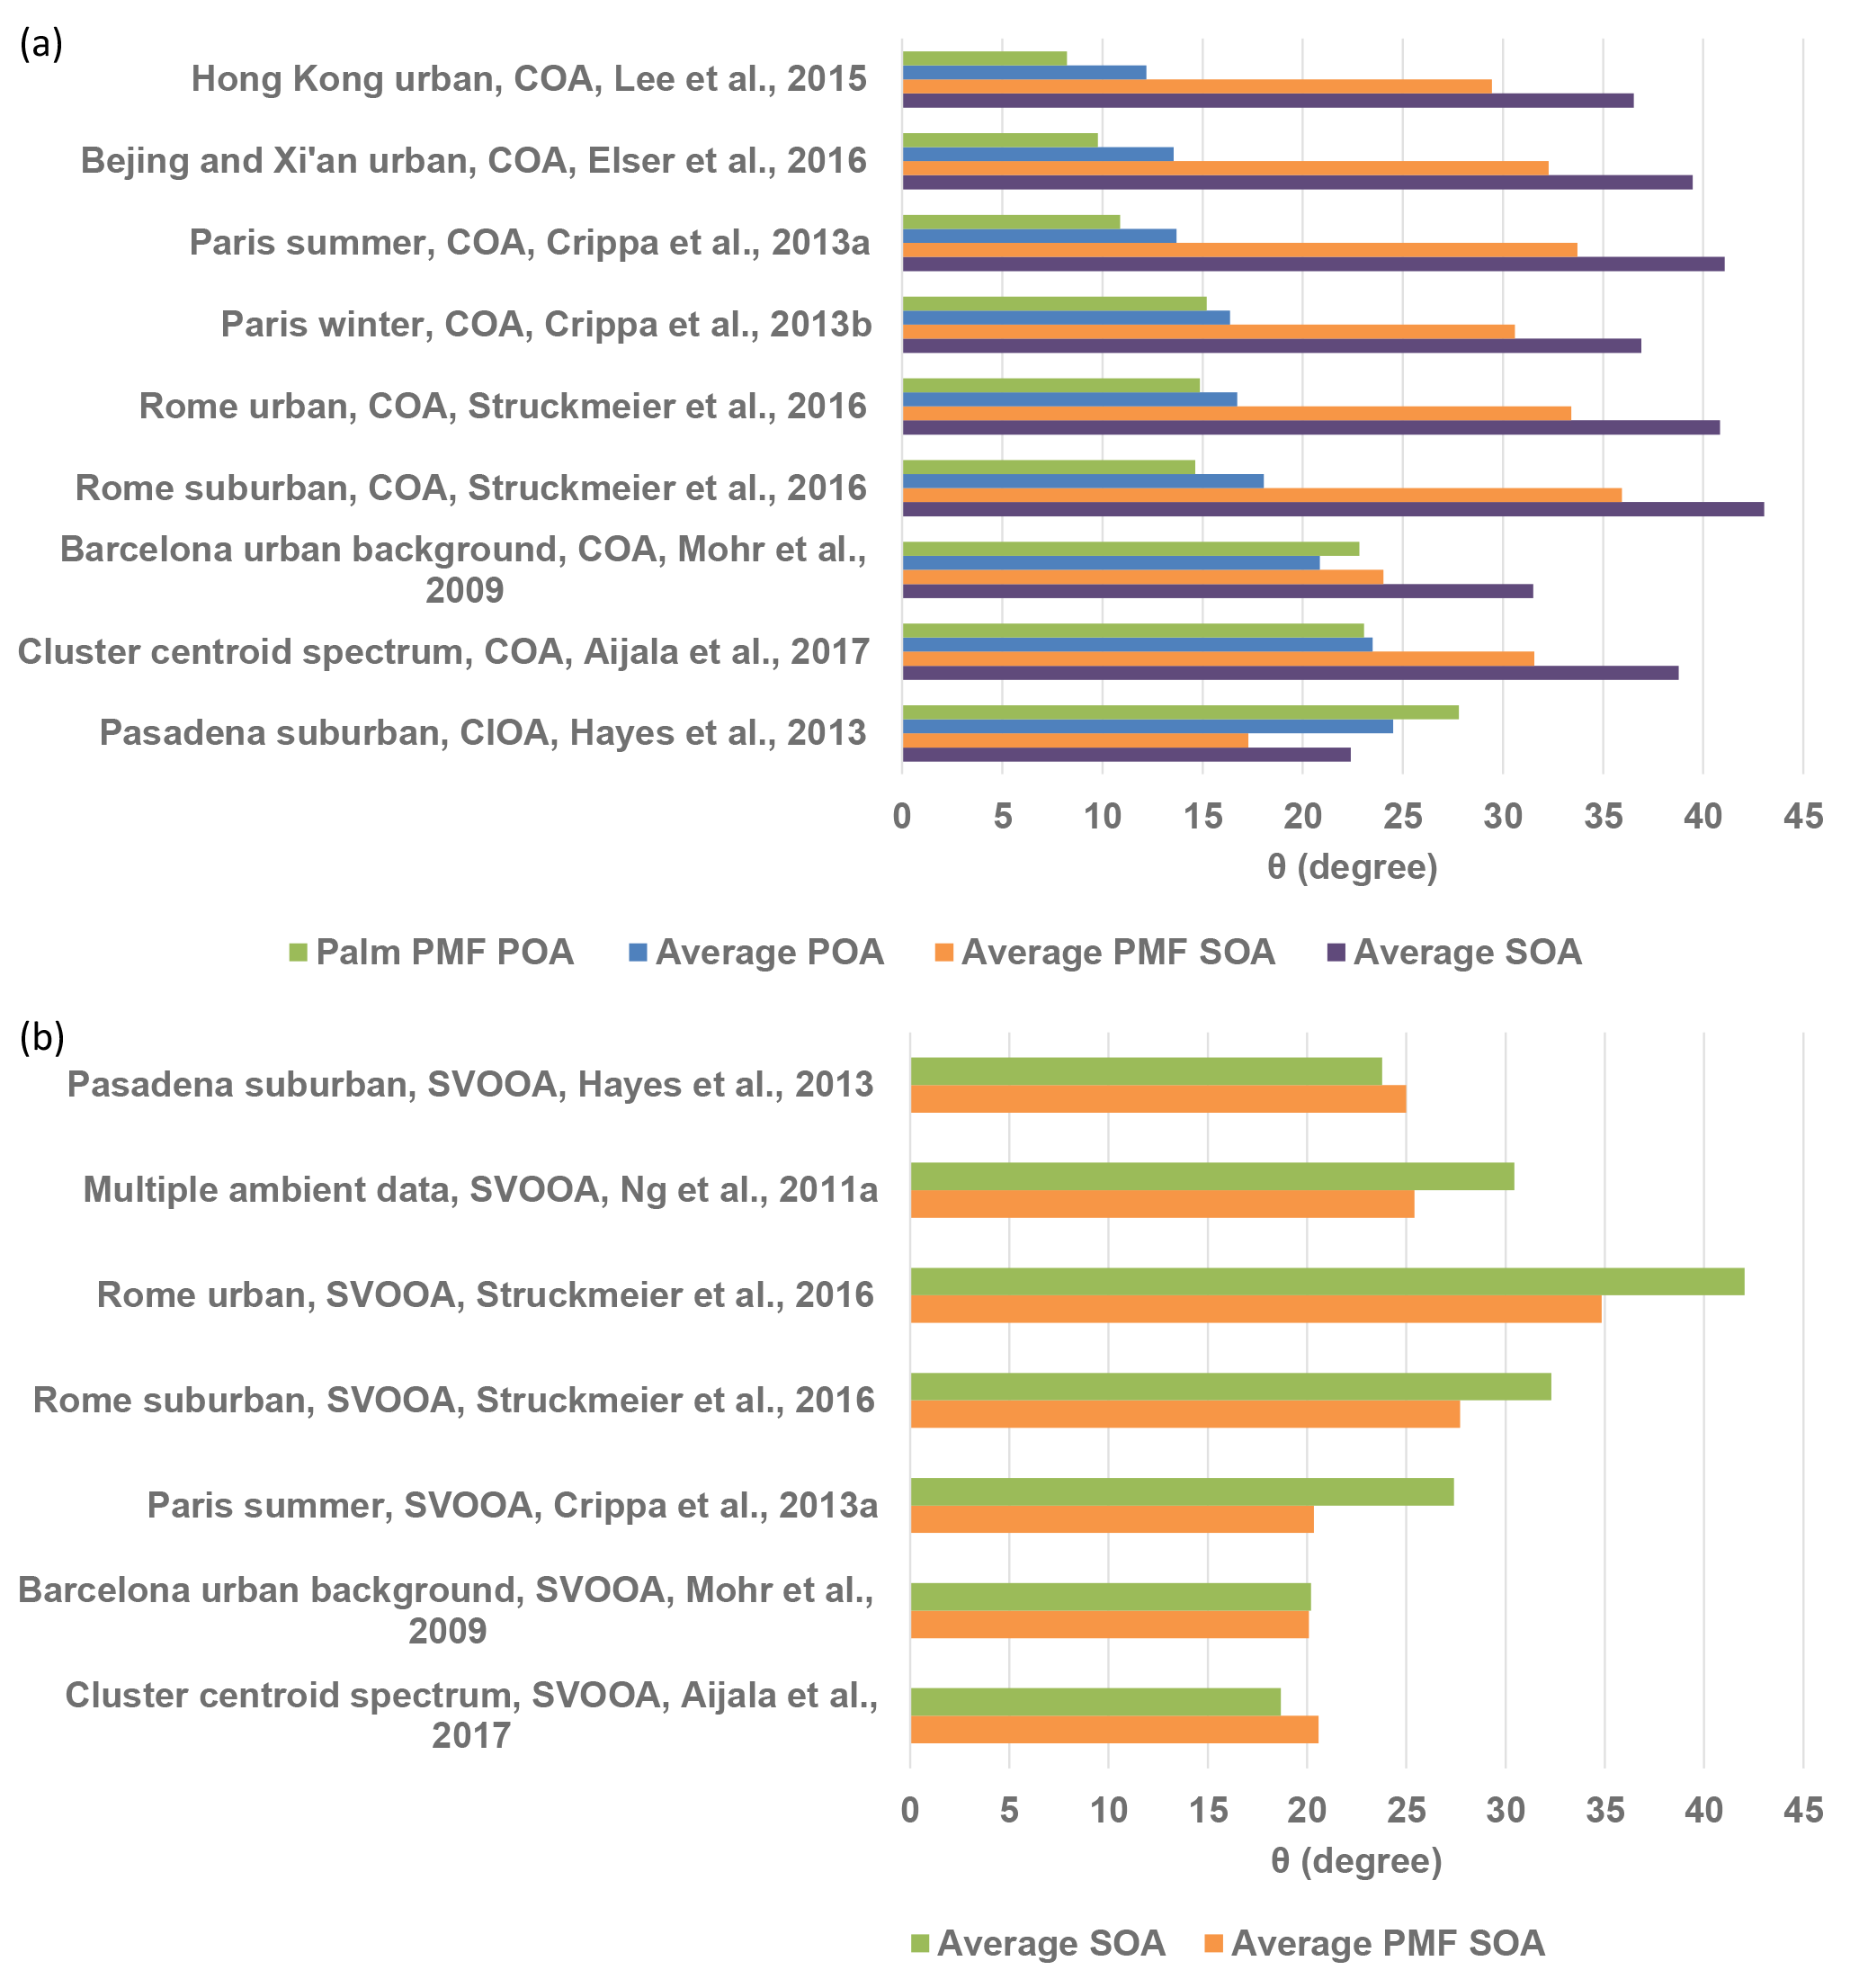
Figure 6(a) Angles (θ) between ambient COA factor mass spectra and the palm PMF POA mass spectrum, average POA mass spectrum, average PMF SOA factor mass spectrum, and average SOA mass spectrum. (b) Angles (θ) between ambient SVOOA factor mass spectra and the average PMF-derived SOA factor and average SOA mass spectra. The average POA mass spectra were averaged for sunflower, peanut, corn, and canola oils (Liu et al., 2017). The average SOA mass spectra were averaged for sunflower, peanut, corn, canola, and soybean oils in this study.
Figure 5 shows PMF-derived SOA factor mass spectra of palm and olive oil and the average mass spectrum of SOA formed from sunflower, peanut, corn, canola, and soybean oils, which was obtained over a 10 min period after the OA concentration reached its maximum for each oil. The SOA factors were dominated by m∕zs 27, 28, 29, 41, 43, 44, and 55; the most abundant ions in these unit masses were , CO+, CHO+, , C2H3O+, , and , respectively (Fig. S6). The abundances of oxygen-containing ions were generally higher than those in the corresponding POA factors. The mass fraction at m∕z 43 (f43=0.087) was higher than f44 (0.059) in the olive oil SOA factor, while f44 (0.074) dominated f43 (0.067) in the palm oil SOA factor. Despite these differences, the mass spectra of the two SOA factors exhibited good agreement (). Although the olive oil and palm oil had different NMOG compositions (Liu et al., 2018) and POA mass spectra, the SOA produced by the two oils had highly similar mass spectra. The SOA factor mass spectra were also highly similar ( for olive oil, 7∘ for palm oil) to the average mass spectrum of SOA from five other cooking oils, which contained a higher mass fraction of m∕z 44 (average f44=0.080). , , , , , and ions were present in both SOA factors, which led to the incorrect separation of the POA and SOA by the residual method, as discussed above.
3.3 Comparison of PMF-resolved factors with ambient factors
Comparisons of mass spectra from laboratory-generated cooking OA with ambient PMF-resolved COA factors can help to constrain COA source apportionment. Figure 6a summarizes θ angles between ambient COA factors from other studies and the palm oil PMF POA spectrum, average PMF SOA spectrum, and average POA and SOA spectra from cooking oils. The olive oil POA mass spectrum was not included in the comparison as it can vary greatly under different experimental conditions. The reference mass spectra from other studies were obtained from the AMS spectral database (http://cires.colorado.edu/jimenez-group/HRAMSsd/, Ulbrich et al., 2018) (Ulbrich et al., 2009). The agreement between ambient COA factors and the palm PMF POA and average POA mass spectra decreased from 8 to 12∘ for ambient COA factors from the commercial and shopping area of Mong kok in Hong Kong (Lee et al., 2015) to 25–28∘ for ambient COA factors from a suburban area in Pasadena (Hayes et al., 2013). Cooking style may be among the factors that drives this variability in θ. Mass spectral agreement was better for urban areas in Hong Kong, Beijing, and Xi'an, where stir-frying foods with vegetable oils is popular than in urban European cities, where grilling and broiling are prevalent (Abdullahi et al., 2013). Atmospheric oxidation may also influence the correlations between the POA factor mass spectra found herein and the ambient COA factors. For example, the mass spectrum of a cooking-influenced organic aerosol (CIOA) factor identified in Pasadena (Hayes et al., 2013) displayed better agreement with the SOA factor and average SOA mass spectra than with the POA factor and average POA spectra. Kaltsonoudis et al. (2017) also found that this CIOA factor correlated well with mass spectra of aged OA from meat charbroiling. The average PMF SOA factor and average SOA spectrum derived herein were poorly correlated (θ generally > 30∘) with other ambient COA factors (Mohr et al., 2009; Crippa et al., 2013a, b; Lee et al., 2015; Elser et al., 2016; Struchmeier et al., 2016; Aijala et al., 2017). Our results suggest that one should consider the cooking style and atmospheric oxidation conditions when constraining COA factors with the default COA mass spectral inputs.
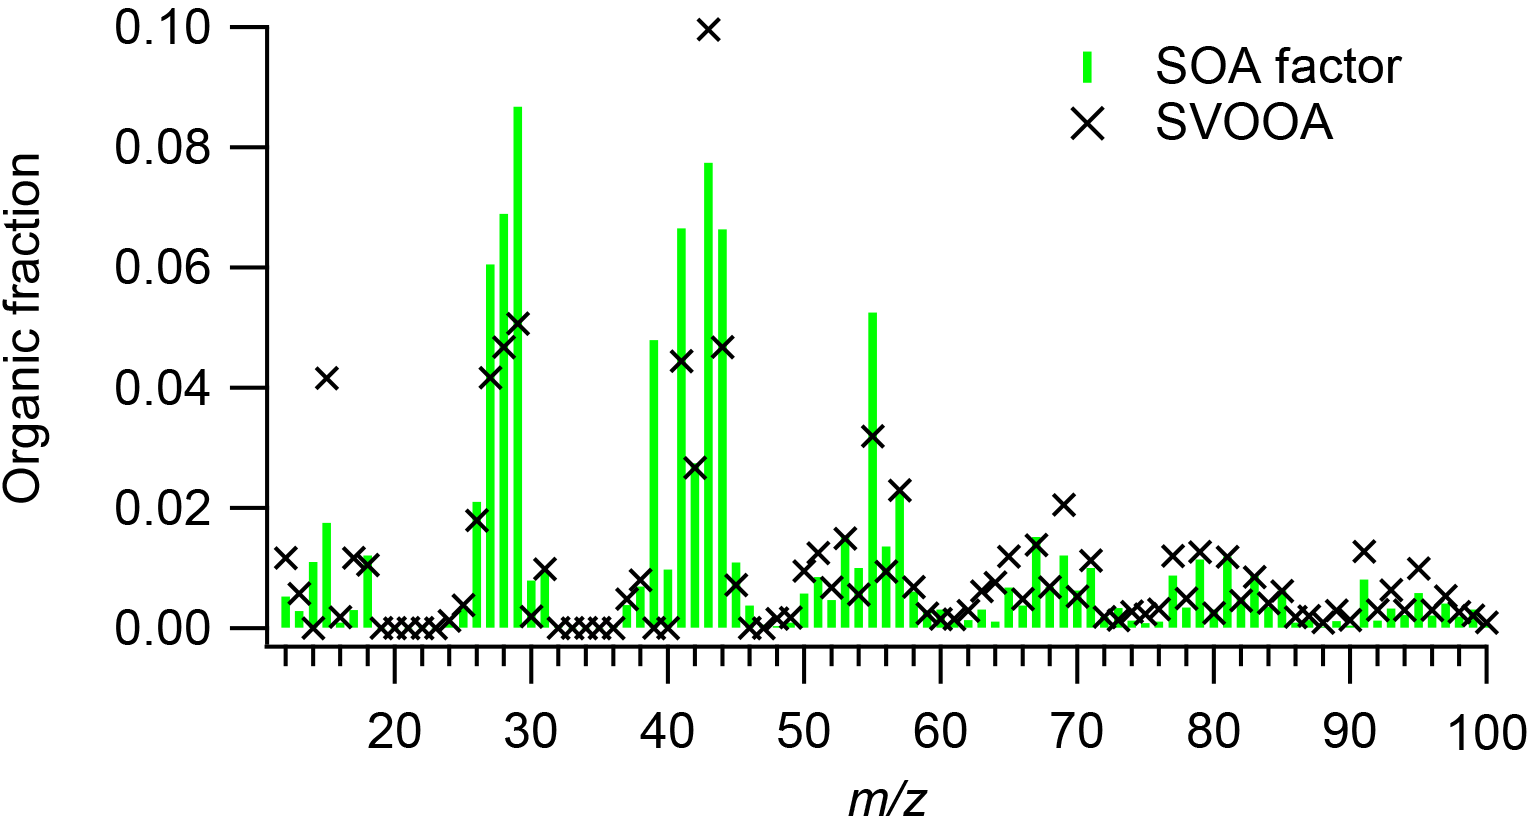
Figure 7Average PMF SOA factor mass spectrum and ambient SV-OOA factor mass spectrum (Ng et al., 2011a).
Figure 7 compares the average PMF SOA factor mass spectrum and average ambient semi-volatile oxygenated organic aerosol (SV-OOA) factor (Ng et al., 2011a). SV-OOA is ubiquitous in the atmosphere and generally associated with SOA (Ng et al., 2010). The SV-OOA factor mass spectrum was recalculated following the Aiken et al. (2008) fragmentation table, assuming that the OA mass at m∕z 28 was equal to that at m∕z 44 and that m∕z 18 was equal to 22.5 % of m∕z 44. The average mass spectrum of the PMF SOA factors exhibited poor agreement with the SV-OOA average mass spectrum (). The average PMF SOA factor for cooking oils had higher abundances of m∕zs 27, 28, 29, 39, 41, 44, and 55 than did the SV-OOA factor and lower mass fractions of m∕zs 15 and 43. In particular, the SV-OOA spectrum had no signal at m∕z 39, while the PMF SOA factor f39 was 0.048. The average mass spectra of the PMF SOA factors and SOA from other cooking oils were also unlike other ambient SV-OOA factors (θ > 20∘) (Mohr et al., 2009; Crippa et al., 2013a; Hayes et al., 2013; Struchmeier et al., 2016; Aijala et al., 2017) (Fig. 6b). The poor correlations between cooking SOA and SV-OOA were not unexpected, as ambient SV-OOA may contain a mixture of SOA from numerous sources, such as vehicle exhaust, biomass burning, and industrial and biogenic emissions.
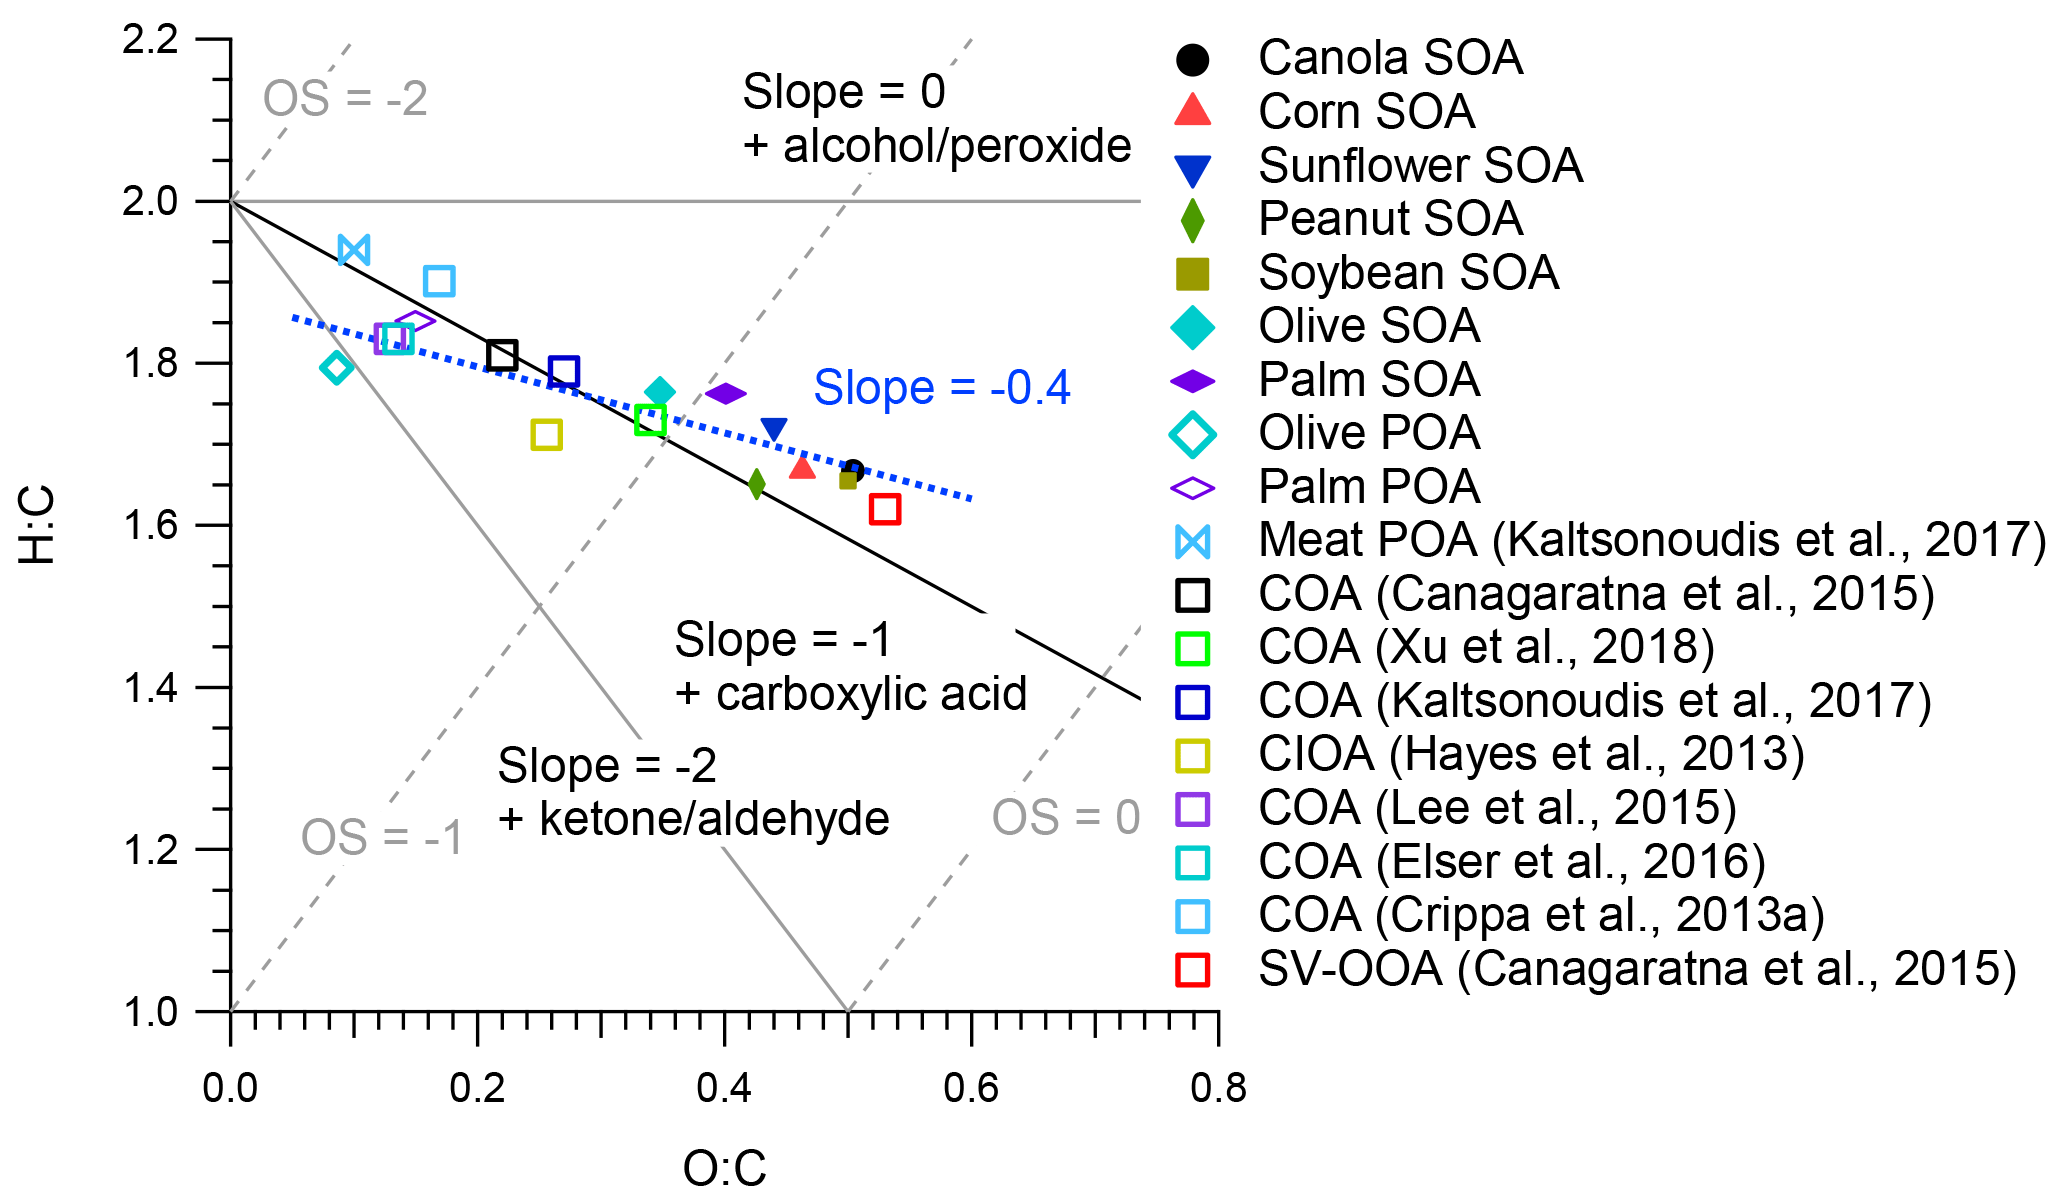
Figure 8Van Krevelen diagram of POA and SOA from different cooking oils, as well as ambient PMF factors. Average carbon oxidation states from Kroll et al. (2011) and functionalization slopes from Heald et al. (2010) are shown for reference.
3.4 OA oxidation state and chemical evolution
Figure 8 shows the H : C and O : C ratios of PMF-resolved POA and SOA factors, SOA from heated cooking oils, and ambient COA and SV-OOA factors in a Van Krevelen diagram. The uncertainty in determining O : C and H : C ratios was 28 % and 13 %, respectively (Canagaratna et al., 2015). The O : C ratio and estimated average carbon oxidation state (OSC) (OSC O : C − H : C) (Kroll et al., 2011) generally increase with increasing atmospheric OA aging. The O : C ratios for the olive and palm PMF POA were 0.09 and 0.15, respectively, comparable to those found for Chinese cooking (0.08–0.13) and meat charbroiling (0.10) (Kaltsonoudis et al., 2017). The O : C ratios for the olive and palm PMF SOA and SOA from other cooking oils ranged from 0.40 to 0.50, slightly lower than that of SV-OOA (0.53), which indicates that the SOA formed from cooking oils herein was less oxidized than ambient SV-OOA. In Van Krevelen space, the entire dataset features a linear trend with a slope of approximately −0.4, which may indicate oxidation mechanisms involving the addition of both carboxylic acid and alcohol or peroxide functional groups without fragmentation and/or the addition of carboxylic acid functional groups with fragmentation (Heald et al., 2010; Ng et al., 2011b). This slope is consistent with the aging of ambient OOA (Ng et al., 2011b) and lower than the −0.8 slope noted in evolving ambient OA data corrected using the improved-ambient method (Heald et al., 2010). The O : C ratios of these ambient COA factors ranged from 0.11 to 0.34, consistent with the oxidation trends determined for cooking OA in this study. Some of the COA factors had O : C ratios higher than those noted for POA from cooking emissions in laboratory studies (e.g., O : C =0.27 for CIOA in Pasadena (Hayes et al., 2013) and O : C =0.34 for COA in Atlanta (Xu et al., 2018)); it is possible that these COA factors contained aged OA and/or SOA formed from cooking emissions.
SOA formation from heated cooking oil emissions was investigated in a smog chamber under high-NOx conditions. For experiments with mixtures of POA and SOA, the POA and SOA factors were separated using PMF, the traditional method, and the residual method; PMF outperformed the other techniques in resolving accurate POA and SOA factors. Although the traditional method, which assumes first-order POA wall losses, worked well when the POA was inert, it greatly overestimated the POA concentration when heterogeneous oxidation occurred. The residual method, which uses different ions as POA tracers, failed to capture the POA concentrations due to the presence of these ions in the SOA mass spectrum.
Mass spectra of palm oil PMF POA and average POA from other cooking oils exhibited good agreement (θ=8–14∘) with ambient COA factors resolved in select Chinese megacities such as Hong Kong, Beijing, and Xi'an and less similarity (θ=11–23∘) with ambient COA factors determined in select European cities. The mass spectrum of a CIOA factor determined in Pasadena was more consistent with the average PMF SOA factor mass spectrum () than with the POA factors (θ=25–28∘). Our results suggest that one should consider the cooking style and atmospheric oxidation conditions when performing deconvolution analyses with the default COA mass spectral inputs.
The average mass spectra of PMF SOA factors and SOA from other cooking oils exhibited little similarity (θ > 20∘) to ambient SV-OOA factors, which is not unexpected given that SV-OOA may contain a mixture of SOA from many sources. In the Van Krevelen diagram, the entire data set in this study yielded a linear trend with a slope of approximately −0.4, which may indicate oxidation mechanisms involving the addition of both carboxylic acid and alcohol or peroxide functional groups without fragmentation and/or the addition of carboxylic acid functional groups with fragmentation.
The data used in this publication are available to the community and can be accessed by request to the corresponding author. The reference mass spectra from the literature can be obtained from the AMS spectral database (Ulbrich et al., 2018).
The supplement related to this article is available online at: https://doi.org/10.5194/acp-18-11363-2018-supplement.
TL, XW, and CKC designed research; ZW, and TL performed research; TL analyzed data; and TL, and CKC wrote the paper.
The authors declare that they have no conflict of interest.
Chak K. Chan would like to acknowledge the support of the National Natural
Science Foundation of China (project no. 41675117). Xinming Wang would like
to acknowledge the support of the Strategic Priority Research Program of the
Chinese Academy of Sciences (grant no. XDB05010200).
Edited by: Daniel Knopf
Reviewed by: two anonymous referees
Abdullahi, K. L., Delgado-Saborit, J. M., and Harrison, R. M.: Emissions and indoor concentrations of particulate matter and its specific chemical components from cooking: A review, Atmos. Environ., 71, 260–294, https://doi.org/10.1016/j.atmosenv.2013.01.061, 2013.
Äijälä, M., Heikkinen, L., Fröhlich, R., Canonaco, F., Prévôt, A. S. H., Junninen, H., Petäjä, T., Kulmala, M., Worsnop, D., and Ehn, M.: Resolving anthropogenic aerosol pollution types – deconvolution and exploratory classification of pollution events, Atmos. Chem. Phys., 17, 3165–3197, https://doi.org/10.5194/acp-17-3165-2017, 2017.
Aiken, A. C., DeCarlo, P. F., Kroll, J. H., Worsnop, D. R., Huffman, J. A., Docherty, K. S., Ulbrich, I. M., Mohr, C., Kimmel, J. R., Sueper, D., Sun, Y., Zhang, Q., Trimborn, A., Northway, M., Ziemann, P. J., Canagaratna, M. R., Onasch, T. B., Alfarra, M. R., Prevot, A. S. H., Dommen, J., Duplissy, J., Metzger, A., Baltensperger, U., and Jimenez, J. L.: O/C and OM/OC Ratios of Primary, Secondary, and Ambient Organic Aerosols with High-Resolution Time-of-Flight Aerosol Mass Spectrometry, Environ. Sci. Technol., 42, 4478–4485, https://doi.org/10.1021/es703009q, 2008.
Allan, J. D., Williams, P. I., Morgan, W. T., Martin, C. L., Flynn, M. J., Lee, J., Nemitz, E., Phillips, G. J., Gallagher, M. W., and Coe, H.: Contributions from transport, solid fuel burning and cooking to primary organic aerosols in two UK cities, Atmos. Chem. Phys., 10, 647–668, https://doi.org/10.5194/acp-10-647-2010, 2010.
Atkinson, R. and Arey, J.: Atmospheric Degradation of Volatile Organic Compounds, Chem. Rev., 103, 4605–4638, https://doi.org/10.1021/cr0206420, 2003.
Canagaratna, M. R., Jimenez, J. L., Kroll, J. H., Chen, Q., Kessler, S. H., Massoli, P., Hildebrandt Ruiz, L., Fortner, E., Williams, L. R., Wilson, K. R., Surratt, J. D., Donahue, N. M., Jayne, J. T., and Worsnop, D. R.: Elemental ratio measurements of organic compounds using aerosol mass spectrometry: characterization, improved calibration, and implications, Atmos. Chem. Phys., 15, 253–272, https://doi.org/10.5194/acp-15-253-2015, 2015.
Canonaco, F., Crippa, M., Slowik, J. G., Baltensperger, U., and Prévôt, A. S. H.: SoFi, an IGOR-based interface for the efficient use of the generalized multilinear engine (ME-2) for the source apportionment: ME-2 application to aerosol mass spectrometer data, Atmos. Meas. Tech., 6, 3649–3661, https://doi.org/10.5194/amt-6-3649-2013, 2013.
Chirico, R., DeCarlo, P. F., Heringa, M. F., Tritscher, T., Richter, R., Prévôt, A. S. H., Dommen, J., Weingartner, E., Wehrle, G., Gysel, M., Laborde, M., and Baltensperger, U.: Impact of aftertreatment devices on primary emissions and secondary organic aerosol formation potential from in-use diesel vehicles: results from smog chamber experiments, Atmos. Chem. Phys., 10, 11545–11563, https://doi.org/10.5194/acp-10-11545-2010, 2010.
Crippa, M., DeCarlo, P. F., Slowik, J. G., Mohr, C., Heringa, M. F., Chirico, R., Poulain, L., Freutel, F., Sciare, J., Cozic, J., Di Marco, C. F., Elsasser, M., Nicolas, J. B., Marchand, N., Abidi, E., Wiedensohler, A., Drewnick, F., Schneider, J., Borrmann, S., Nemitz, E., Zimmermann, R., Jaffrezo, J.-L., Prévôt, A. S. H., and Baltensperger, U.: Wintertime aerosol chemical composition and source apportionment of the organic fraction in the metropolitan area of Paris, Atmos. Chem. Phys., 13, 961–981, https://doi.org/10.5194/acp-13-961-2013, 2013. 2013a.
Crippa, M., El Haddad, I., Slowik, J. G., DeCarlo, P. F., Mohr, C., Heringa, M. F., Chirico, R., Marchand, N., Sciare, J., Baltensperger, U., and Prévôt, A. S. H.: Identification of marine and continental aerosol sources in Paris using high resolution aerosol mass spectrometry, J. Geophys. Res.-Atmos., 118, 1950–1963, https://doi.org/10.1002/jgrd.50151, 2013b.
Dall'Osto, M., Paglione, M., Decesari, S., Facchini, M. C., O'Dowd, C., Plass-Duellmer, C., and Harrison, R. M.: On the Origin of AMS “Cooking Organic Aerosol” at a Rural Site, Environ. Sci. Technol., 49, 13964–13972, https://doi.org/10.1021/acs.est.5b02922, 2015.
DeCarlo, P. F., Kimmel, J. R., Trimborn, A., Northway, M. J., Jayne, J. T., Aiken, A. C., Gonin, M., Fuhrer, K., Horvath, T., Docherty, K. S., Worsnop, D. R., and Jimenez, J. L.: Field-Deployable, High-Resolution, Time-of-Flight Aerosol Mass Spectrometer, Anal. Chem., 78, 8281–8289, https://doi.org/10.1021/ac061249n, 2006.
Deng, W., Hu, Q., Liu, T., Wang, X., Zhang, Y., Song, W., Sun, Y., Bi, X., Yu, J., Yang, W., Huang, X., Zhang, Z., Huang, Z., He, Q., Mellouki, A., and George, C.: Primary particulate emissions and secondary organic aerosol (SOA) formation from idling diesel vehicle exhaust in China, Sci. Total Environ., 593–594, 462–469, https://doi.org/10.1016/j.scitotenv.2017.03.088, 2017.
Donahue, N. M., Robinson, A. L., and Pandis, S. N.: Atmospheric organic particulate matter: From smoke to secondary organic aerosol, Atmos. Environ., 43, 94–106, https://doi.org/10.1016/j.atmosenv.2008.09.055, 2009.
Elser, M., Huang, R.-J., Wolf, R., Slowik, J. G., Wang, Q., Canonaco, F., Li, G., Bozzetti, C., Daellenbach, K. R., Huang, Y., Zhang, R., Li, Z., Cao, J., Baltensperger, U., El-Haddad, I., and Prévôt, A. S. H.: New insights into PM2.5 chemical composition and sources in two major cities in China during extreme haze events using aerosol mass spectrometry, Atmos. Chem. Phys., 16, 3207–3225, https://doi.org/10.5194/acp-16-3207-2016, 2016.
Florou, K., Papanastasiou, D. K., Pikridas, M., Kaltsonoudis, C., Louvaris, E., Gkatzelis, G. I., Patoulias, D., Mihalopoulos, N., and Pandis, S. N.: The contribution of wood burning and other pollution sources to wintertime organic aerosol levels in two Greek cities, Atmos. Chem. Phys., 17, 3145–3163, https://doi.org/10.5194/acp-17-3145-2017, 2017.
Ge, X., Setyan, A., Sun, Y., and Zhang, Q.: Primary and secondary organic aerosols in Fresno, California during wintertime: Results from high resolution aerosol mass spectrometry, J. Geophys. Res.-Atmos., 117, D19301, https://doi.org/10.1029/2012JD018026, 2012.
Gordon, T. D., Presto, A. A., May, A. A., Nguyen, N. T., Lipsky, E. M., Donahue, N. M., Gutierrez, A., Zhang, M., Maddox, C., Rieger, P., Chattopadhyay, S., Maldonado, H., Maricq, M. M., and Robinson, A. L.: Secondary organic aerosol formation exceeds primary particulate matter emissions for light-duty gasoline vehicles, Atmos. Chem. Phys., 14, 4661–4678, https://doi.org/10.5194/acp-14-4661-2014, 2014.
Hallquist, M., Wenger, J. C., Baltensperger, U., Rudich, Y., Simpson, D., Claeys, M., Dommen, J., Donahue, N. M., George, C., Goldstein, A. H., Hamilton, J. F., Herrmann, H., Hoffmann, T., Iinuma, Y., Jang, M., Jenkin, M. E., Jimenez, J. L., Kiendler-Scharr, A., Maenhaut, W., McFiggans, G., Mentel, Th. F., Monod, A., Prévôt, A. S. H., Seinfeld, J. H., Surratt, J. D., Szmigielski, R., and Wildt, J.: The formation, properties and impact of secondary organic aerosol: current and emerging issues, Atmos. Chem. Phys., 9, 5155–5236, https://doi.org/10.5194/acp-9-5155-2009, 2009.
Hayes, P. L., Ortega, A. M., Cubison, M. J., Froyd, K. D., Zhao, Y., Cliff, S. S., Hu, W. W., Toohey, D. W., Flynn, J. H., Lefer, B. L., Grossberg, N., Alvarez, S., Rappenglück, B., Taylor, J. W., Allan, J. D., Holloway, J. S., Gilman, J. B., Kuster, W. C., de Gouw, J. A., Massoli, P., Zhang, X., Liu, J., Weber, R. J., Corrigan, A. L., Russell, L. M., Isaacman, G., Worton, D. R., Kreisberg, N. M., Goldstein, A. H., Thalman, R., Waxman, E. M., Volkamer, R., Lin, Y. H., Surratt, J. D., Kleindienst, T. E., Offenberg, J. H., Dusanter, S., Griffith, S., Stevens, P. S., Brioude, J., Angevine, W. M., and Jimenez, J. L.: Organic aerosol composition and sources in Pasadena, California, during the 2010 CalNex campaign, J. Geophys. Res.-Atmos., 118, 9233–9257, https://doi.org/10.1002/jgrd.50530, 2013.
He, L.-Y., Lin, Y., Huang, X.-F., Guo, S., Xue, L., Su, Q., Hu, M., Luan, S.-J., and Zhang, Y.-H.: Characterization of high-resolution aerosol mass spectra of primary organic aerosol emissions from Chinese cooking and biomass burning, Atmos. Chem. Phys., 10, 11535–11543, https://doi.org/10.5194/acp-10-11535-2010, 2010.
Heald, C. L., Kroll, J. H., Jimenez, J. L., Docherty, K. S., DeCarlo, P. F., Aiken, A. C., Chen, Q., Martin, S. T., Farmer, D. K., and Artaxo, P.: A simplified description of the evolution of organic aerosol composition in the atmosphere, Geophys. Res. Lett., 37, L08803, https://doi.org/10.1029/2010gl042737, 2010.
Jordan, A., Haidacher, S., Hanel, G., Hartungen, E., Mark, L., Seehauser, H., Schottkowsky, R., Sulzer, P., and Mark, T. D.: A high resolution and high sensitivity proton-transfer-reaction time-of-flight mass spectrometer (PTR-TOF-MS), Int. J. Mass Spectrom., 286, 122–128, 2009.
Kaltsonoudis, C., Kostenidou, E., Louvaris, E., Psichoudaki, M., Tsiligiannis, E., Florou, K., Liangou, A., and Pandis, S. N.: Characterization of fresh and aged organic aerosol emissions from meat charbroiling, Atmos. Chem. Phys., 17, 7143–7155, https://doi.org/10.5194/acp-17-7143-2017, 2017.
Kanakidou, M., Seinfeld, J. H., Pandis, S. N., Barnes, I., Dentener, F. J., Facchini, M. C., Van Dingenen, R., Ervens, B., Nenes, A., Nielsen, C. J., Swietlicki, E., Putaud, J. P., Balkanski, Y., Fuzzi, S., Horth, J., Moortgat, G. K., Winterhalter, R., Myhre, C. E. L., Tsigaridis, K., Vignati, E., Stephanou, E. G., and Wilson, J.: Organic aerosol and global climate modelling: a review, Atmos. Chem. Phys., 5, 1053–1123, https://doi.org/10.5194/acp-5-1053-2005, 2005.
Kostenidou, E., Lee, B.-H., Engelhart, G. J., Pierce, J. R., and Pandis, S. N.: Mass Spectra Deconvolution of Low, Medium, and High Volatility Biogenic Secondary Organic Aerosol, Environ. Sci. Technol., 43, 4884–4889, https://doi.org/10.1021/es803676g, 2009.
Kostenidou, E., Florou, K., Kaltsonoudis, C., Tsiflikiotou, M., Vratolis, S., Eleftheriadis, K., and Pandis, S. N.: Sources and chemical characterization of organic aerosol during the summer in the eastern Mediterranean, Atmos. Chem. Phys., 15, 11355–11371, https://doi.org/10.5194/acp-15-11355-2015, 2015.
Kroll, J. H., Donahue, N. M., Jimenez, J. L., Kessler, S. H., Canagaratna, M. R., Wilson, K. R., Altieri, K. E., Mazzoleni, L. R., Wozniak, A. S., Bluhm, H., Mysak, E. R., Smith, J. D., Kolb, C. E., and Worsnop, D. R.: Carbon oxidation state as a metric for describing the chemistry of atmospheric organic aerosol, Nat. Chem., 3, 133–139, 2011.
Lee, B. P., Li, Y. J., Yu, J. Z., Louie, P. K. K., and Chan, C. K.: Characteristics of submicron particulate matter at the urban roadside in downtown Hong Kong – Overview of 4 months of continuous high-resolution aerosol mass spectrometer measurements, J. Geophys. Res.-Atmos., 120, 2015JD023311, https://doi.org/10.1002/2015JD023311, 2015.
Lindinger, W., Hansel, A., and Jordan, A.: On-line monitoring of volatile organic compounds at pptv levels by means of proton-transfer-reaction mass spectrometry (PTR-MS) medical applications, food control and environmental research, Int. J. Mass Spectrom., 173, 191–241, https://doi.org/10.1016/S0168-1176(97)00281-4, 1998.
Liu, T., Wang, X., Deng, W., Hu, Q., Ding, X., Zhang, Y., He, Q., Zhang, Z., Lü, S., Bi, X., Chen, J., and Yu, J.: Secondary organic aerosol formation from photochemical aging of light-duty gasoline vehicle exhausts in a smog chamber, Atmos. Chem. Phys., 15, 9049–9062, https://doi.org/10.5194/acp-15-9049-2015, 2015.
Liu, T., Wang, X., Hu, Q., Deng, W., Zhang, Y., Ding, X., Fu, X., Bernard, F., Zhang, Z., Lü, S., He, Q., Bi, X., Chen, J., Sun, Y., Yu, J., Peng, P., Sheng, G., and Fu, J.: Formation of secondary aerosols from gasoline vehicle exhaust when mixing with SO2, Atmos. Chem. Phys., 16, 675–689, https://doi.org/10.5194/acp-16-675-2016, 2016.
Liu, T., Li, Z., Chan, M., and Chan, C. K.: Formation of secondary organic aerosols from gas-phase emissions of heated cooking oils, Atmos. Chem. Phys., 17, 7333–7344, https://doi.org/10.5194/acp-17-7333-2017, 2017.
Liu, T., Wang, Z., Huang, D. D., Wang, X., and Chan, C. K.: Significant Production of Secondary Organic Aerosol from Emissions of Heated Cooking Oils, Environ. Sci. Tech. Lett., 5, 32–37, https://doi.org/10.1021/acs.estlett.7b00530, 2018.
Miracolo, M. A., Presto, A. A., Lambe, A. T., Hennigan, C. J., Donahue, N. M., Kroll, J. H., Worsnop, D. R., and Robinson, A. L.: Photo-Oxidation of Low-Volatility Organics Found in Motor Vehicle Emissions: Production and Chemical Evolution of Organic Aerosol Mass, Environ. Sci. Technol., 44, 1638–1643, https://doi.org/10.1021/es902635c, 2010.
Mohr, C., Huffman, J. A., Cubison, M. J., Aiken, A. C., Docherty, K. S., Kimmel, J. R., Ulbrich, I. M., Hannigan, M., and Jimenez, J. L.: Characterization of Primary Organic Aerosol Emissions from Meat Cooking, Trash Burning, and Motor Vehicles with High-Resolution Aerosol Mass Spectrometry and Comparison with Ambient and Chamber Observations, Environ. Sci. Technol., 43, 2443–2449, https://doi.org/10.1021/es8011518, 2009.
Mohr, C., DeCarlo, P. F., Heringa, M. F., Chirico, R., Slowik, J. G., Richter, R., Reche, C., Alastuey, A., Querol, X., Seco, R., Peñuelas, J., Jiménez, J. L., Crippa, M., Zimmermann, R., Baltensperger, U., and Prévôt, A. S. H.: Identification and quantification of organic aerosol from cooking and other sources in Barcelona using aerosol mass spectrometer data, Atmos. Chem. Phys., 12, 1649–1665, https://doi.org/10.5194/acp-12-1649-2012, 2012.
Nah, T., Kessler, S. H., Daumit, K. E., Kroll, J. H., Leone, S. R., and Wilson, K. R.: OH-initiated oxidation of sub-micron unsaturated fatty acid particles, Phys. Chem. Chem. Phys., 15, 18649–18663, https://doi.org/10.1039/C3CP52655K, 2013.
Ng, N. L., Canagaratna, M. R., Zhang, Q., Jimenez, J. L., Tian, J., Ulbrich, I. M., Kroll, J. H., Docherty, K. S., Chhabra, P. S., Bahreini, R., Murphy, S. M., Seinfeld, J. H., Hildebrandt, L., Donahue, N. M., DeCarlo, P. F., Lanz, V. A., Prévôt, A. S. H., Dinar, E., Rudich, Y., and Worsnop, D. R.: Organic aerosol components observed in Northern Hemispheric datasets from Aerosol Mass Spectrometry, Atmos. Chem. Phys., 10, 4625–4641, https://doi.org/10.5194/acp-10-4625-2010, 2010.
Ng, N. L., Canagaratna, M. R., Jimenez, J. L., Zhang, Q., Ulbrich, I. M., and Worsnop, D. R.: Real-Time Methods for Estimating Organic Component Mass Concentrations from Aerosol Mass Spectrometer Data, Environ. Sci. Technol., 45, 910–916, https://doi.org/10.1021/es102951k, 2011a.
Ng, N. L., Canagaratna, M. R., Jimenez, J. L., Chhabra, P. S., Seinfeld, J. H., and Worsnop, D. R.: Changes in organic aerosol composition with aging inferred from aerosol mass spectra, Atmos. Chem. Phys., 11, 6465–6474, https://doi.org/10.5194/acp-11-6465-2011, 2011b.
Paatero, P.: A weighted non-negative least squares algorithm for three-way “PARAFAC” factor analysis, Chemometr. Intell. Lab., 38, 223–242, https://doi.org/10.1016/S0169-7439(97)00031-2, 1997.
Paatero, P. and Tapper, U.: Positive matrix factorization: A non-negative factor model with optimal utilization of error estimates of data values, Environmetrics, 5, 111–126, https://https://doi.org/10.1002/env.3170050203, 1994.
Presto, A. A., Gordon, T. D., and Robinson, A. L.: Primary to secondary organic aerosol: evolution of organic emissions from mobile combustion sources, Atmos. Chem. Phys., 14, 5015–5036, https://doi.org/10.5194/acp-14-5015-2014, 2014.
Qin, Y. M., Tan, H. B., Li, Y. J., Schurman, M. I., Li, F., Canonaco, F., Prévôt, A. S. H., and Chan, C. K.: Impacts of traffic emissions on atmospheric particulate nitrate and organics at a downwind site on the periphery of Guangzhou, China, Atmos. Chem. Phys., 17, 10245–10258, https://doi.org/10.5194/acp-17-10245-2017, 2017.
Reyes-Villegas, E., Bannan, T., Le Breton, M., Mehra, A., Priestley, M., Percival, C., Coe, H., and Allan, J. D.: Online Chemical Characterization of Food-Cooking Organic Aerosols: Implications for Source Apportionment, Environ. Sci. Technol., 52, 5308–5318, https://doi.org/10.1021/acs.est.7b06278, 2018.
Sage, A. M., Weitkamp, E. A., Robinson, A. L., and Donahue, N. M.: Evolving mass spectra of the oxidized component of organic aerosol: results from aerosol mass spectrometer analyses of aged diesel emissions, Atmos. Chem. Phys., 8, 1139–1152, https://doi.org/10.5194/acp-8-1139-2008, 2008.
Struckmeier, C., Drewnick, F., Fachinger, F., Gobbi, G. P., and Borrmann, S.: Atmospheric aerosols in Rome, Italy: sources, dynamics and spatial variations during two seasons, Atmos. Chem. Phys., 16, 15277–15299, https://doi.org/10.5194/acp-16-15277-2016, 2016.
Sun, Y.-L., Zhang, Q., Schwab, J. J., Demerjian, K. L., Chen, W.-N., Bae, M.-S., Hung, H.-M., Hogrefe, O., Frank, B., Rattigan, O. V., and Lin, Y.-C.: Characterization of the sources and processes of organic and inorganic aerosols in New York city with a high-resolution time-of-flight aerosol mass apectrometer, Atmos. Chem. Phys., 11, 1581–1602, https://doi.org/10.5194/acp-11-1581-2011, 2011.
Sun, Y. L., Zhang, Q., Schwab, J. J., Chen, W.-N., Bae, M.-S., Hung, H.-M., Lin, Y.-C., Ng, N. L., Jayne, J., Massoli, P., Williams, L. R., and Demerjian, K. L.: Characterization of near-highway submicron aerosols in New York City with a high-resolution aerosol mass spectrometer, Atmos. Chem. Phys., 12, 2215–2227, https://doi.org/10.5194/acp-12-2215-2012, 2012.
Ulbrich, I. M., Canagaratna, M. R., Zhang, Q., Worsnop, D. R., and Jimenez, J. L.: Interpretation of organic components from Positive Matrix Factorization of aerosol mass spectrometric data, Atmos. Chem. Phys., 9, 2891–2918, https://doi.org/10.5194/acp-9-2891-2009, 2009.
Ulbrich, I. M., Handschy, A., Lechner, M., and Jimenez, J. L.: High-Resolution AMS Spectral Database, available at: http://cires.colorado.edu/jimenez-group/HRAMSsd/, last access: 6 August 2018.
United States Department of Agriculture: World vegetable oils supply and distribution, 2012/13–2016/17, 2017.
Wang, X., Liu, T., Bernard, F., Ding, X., Wen, S., Zhang, Y., Zhang, Z., He, Q., Lü, S., Chen, J., Saunders, S., and Yu, J.: Design and characterization of a smog chamber for studying gas-phase chemical mechanisms and aerosol formation, Atmos. Meas. Tech., 7, 301–313, https://doi.org/10.5194/amt-7-301-2014, 2014.
Weitkamp, E. A., Sage, A. M., Pierce, J. R., Donahue, N. M., and Robinson, A. L.: Organic Aerosol Formation from Photochemical Oxidation of Diesel Exhaust in a Smog Chamber, Environ. Sci. Technol., 41, 6969–6975, https://doi.org/10.1021/es070193r, 2007.
Xu, J., Zhang, Q., Chen, M., Ge, X., Ren, J., and Qin, D.: Chemical composition, sources, and processes of urban aerosols during summertime in northwest China: insights from high-resolution aerosol mass spectrometry, Atmos. Chem. Phys., 14, 12593–12611, https://doi.org/10.5194/acp-14-12593-2014, 2014.
Xu, L., Pye, H. O. T., He, J., Chen, Y., Murphy, B. N., and Ng, N. L.: Large Contributions from Biogenic Monoterpenes and Sesquiterpenes to Organic Aerosol in the Southeastern United States, Atmos. Chem. Phys. Discuss., https://doi.org/10.5194/acp-2017-1109, in review, 2018.
Zhang, Q., Jimenez, J. L., Canagaratna, M. R., Ulbrich, I. M., Ng, N. L., Worsnop, D. R., and Sun, Y.: Understanding atmospheric organic aerosols via factor analysis of aerosol mass spectrometry: a review, Anal. Bioanal. Chem., 401, 3045–3067, https://doi.org/10.1007/s00216-011-5355-y, 2011.
Zhang, X., Cappa, C. D., Jathar, S. H., McVay, R. C., Ensberg, J. J., Kleeman, M. J., and Seinfeld, J. H.: Influence of vapor wall loss in laboratory chambers on yields of secondary organic aerosol, P. Natl. Acad. Sci. USA, 111, 5802–5807, https://doi.org/10.1073/pnas.1404727111, 2014.