the Creative Commons Attribution 4.0 License.
the Creative Commons Attribution 4.0 License.
 | 14 Aug 2018
Size-resolved mixing state of black carbon in the Canadian high Arctic and implications for simulated direct radiative effect
John K. Kodros
Sarah J. Hanna
Allan K. Bertram
W. Richard Leaitch
Hannes Schulz
Andreas B. Herber
Marco Zanatta
Julia Burkart
Megan D. Willis
Jonathan P. D. Abbatt
Jeffrey R. Pierce
Transport of anthropogenic aerosol into the Arctic in the spring months has the potential to affect regional climate; however, modeling estimates of the aerosol direct radiative effect (DRE) are sensitive to uncertainties in the mixing state of black carbon (BC). A common approach in previous modeling studies is to assume an entirely external mixture (all primarily scattering species are in separate particles from BC) or internal mixture (all primarily scattering species are mixed in the same particles as BC). To provide constraints on the size-resolved mixing state of BC, we use airborne single-particle soot photometer (SP2) and ultrahigh-sensitivity aerosol spectrometer (UHSAS) measurements from the Alfred Wegener Institute (AWI) Polar 6 flights from the NETCARE/PAMARCMIP2015 campaign to estimate coating thickness as a function of refractory BC (rBC) core diameter and the fraction of particles containing rBC in the springtime Canadian high Arctic. For rBC core diameters in the range of 140 to 220 nm, we find average coating thicknesses of approximately 45 to 40 nm, respectively, resulting in ratios of total particle diameter to rBC core diameters ranging from 1.6 to 1.4. For total particle diameters ranging from 175 to 730 nm, rBC-containing particle number fractions range from 16 % to 3 %, respectively. We combine the observed mixing-state constraints with simulated size-resolved aerosol mass and number distributions from GEOS-Chem–TOMAS to estimate the DRE with observed bounds on mixing state as opposed to assuming an entirely external or internal mixture. We find that the pan-Arctic average springtime DRE ranges from −1.65 to −1.34 W m−2 when assuming entirely externally or internally mixed BC. This range in DRE is reduced by over a factor of 2 (−1.59 to −1.45 W m−2) when using the observed mixing-state constraints. The difference in DRE between the two observed mixing-state constraints is due to an underestimation of BC mass fraction in the springtime Arctic in GEOS-Chem–TOMAS compared to Polar 6 observations. Measurements of mixing state provide important constraints for model estimates of DRE.
- Article
(2640 KB) -
Supplement
(812 KB) - BibTeX
- EndNote


Over the last several decades, the Arctic has warmed at nearly twice the rate of the global mean (Boucher et al., 2013). In addition to CO2, short-lived climate forcers (such as black carbon and methane) may contribute to this increased rate of warming (AMAP, 2015). Black carbon (BC), in particular, may be an efficient warming agent in the Arctic as its potential to decrease planetary albedo is magnified when BC is above a white surface, such as snow (e.g., Bond et al., 2013). BC can affect climate through aerosol–radiation interactions (e.g., the direct radiative effect, semi-direct radiative effect) or through aerosol–cloud interactions (e.g., the cloud-albedo indirect effect) (Boucher et al., 2013). The magnitude to which BC warms an atmospheric column through aerosol–radiation interactions is strongly sensitive to atmospheric concentration, altitude, and chemical mixing state (Bond et al., 2013). In this work, we focus on the mixing state of BC.
The population (or chemical) mixing state of BC refers to the degree to which BC particles are mixed with other aerosol species. In global and regional models in which population mixing state is not explicitly tracked, BC is commonly represented as completely externally mixed (separate from other aerosol species) or completely internally mixed (mixed together with other aerosol species). For BC mass in a given particle size range, the external mixture assumes the BC mass is divided up into particles of the same size as the non-BC particles. Conversely, in the internal mixture, the same BC mass is divided up into a relatively larger number of particles with smaller BC diameters such that the total mixed particle has the representative diameter of the size range. In a full internal mixture, BC mass is spread among all particles. For a given BC mass, the internal mixing-state assumption will produce more absorption as the BC mass is spread amongst more particles, giving rise to greater surface area and thicker coatings (Bond and Bergstrom, 2006; Seinfeld and Pandis, 2012). However, in the atmosphere, BC is often not mixed entirely as an internal or external mixture. For instance, Massoli et al. (2015) found that 35 % of the total non-refractory submicrometer mass was associated with BC-containing particles in coastal California during the CALNEX campaign, and recent studies of Arctic aerosol suggest that a smaller percentage of aerosol particles contain BC (e.g., Raatikainen et al., 2015; Sharma et al., 2017). Thus, the assumption in aerosol models of a full internal or external mixture may lead to overestimates or underestimates of BC absorption.
A second component of BC mixing state is the morphological mixing state. The morphological mixing state refers to the distribution of chemical species within a particle, as well as the shape and location of BC within the aerosol particle. At a remote observation site, China et al. (2015) found substantial variability in the fractal dimension and structure of mixed (i.e., fully encapsulated versus partly encapsulated) BC particles. Despite this variability, a common assumption for the morphological mixing state of BC is that the BC mass forms the core of a particle and the hydrophilic aerosol mass forms a concentric shell around the particle (Bond et al., 2006; Lack and Cappa, 2010). The scattering component of the shell acts as a lens to focus more photons onto the core, thus increasing absorption (Borhen and Huffman, 1983; Bond et al., 2006). However, the degree of absorption enhancement is a strong function of the structure and geometry of the mixed particle as well as the core diameter and shell thickness (He et al., 2015, 2016). Theoretical calculations (known as “core–shell Mie theory”) and laboratory studies have estimated enhancements in absorption for a given BC mass of a factor of 1.3 to 2 (Schnaiter et al., 2003, 2005; Zhang et al., 2008). Based on these findings, Bond et al. (2006) recommend scaling the BC absorption by a factor of 1.5 to account for the “lensing” effect in models that do not assume internal aerosol mixtures. However, field campaigns have found a wider variation of absorption enhancements. While finding that 20 %–30 % of BC particles had acquired a thick coating, McMeeking et al. (2011) and Subramanian et al. (2010) did not find a dependence of mass absorption cross section with coating. Similarly, Cappa et al. (2012) found an absorption enhancement of only 6 % and speculated that the BC may not be at the exact center of the particle. Conversely, Wang et al. (2014) found an absorption enhancement of 1.8 in China, similar to laboratory findings. In addition, Sharma et al. (2017) found values of mass absorption cross section to increase with coating thickness with a steeper slope than theoretical calculations. Thus, accurate model estimates of BC absorption must rely on an understanding of sources of BC and all other aerosol components.
Aerosol number and mass concentrations in the Arctic have a strong seasonal cycle, with contributions from anthropogenic sources leading to a peak in accumulation-mode aerosol mass in the winter and spring (e.g., Quinn et al., 2007; Croft et al., 2016a). Efficient wet removal in the summer results in conditions that favor new particle formation and nucleation-mode aerosol (e.g., Garrett et al., 2011; Browse et al., 2012; Leaitch et al., 2013; Tunved et al., 2013; Croft et al., 2016a, b; Willis et al., 2016). As there is little or no solar irradiance in the Arctic winter, it is essential to accurately simulate aerosol optical properties in the spring. Sources of BC in the Arctic include gas flaring and biomass burning; however, much of the atmospheric BC concentration is transported from lower latitudes (Xu et al., 2017; Qi et al., 2017a; Schulz et al., 2018). Using a combination of observations and a chemical transport model, Xu et al. (2017) found that in the Arctic spring much of the BC concentrations at higher elevations arrived from South Asia, while at lower elevations BC concentrations were transported from Asia and Eastern Europe. Similarly, Qi et al. (2017a) found BC concentrations in the Arctic in April 2008 to be largely from anthropogenic sources in Asia and biomass burning sources in Siberia. Sources of non-BC particles to the Arctic include direct marine sources, new particle formation from natural or possibly anthropogenic precursors, and transport from lower latitudes (e.g., Croft et al., 2016b; Wentworth et al., 2016; Willis et al., 2016).
Despite the dependence of aerosol absorption on BC mixing state, measurements of mixing state in the Arctic are limited. The single-particle soot photometer (SP2) provides direct measurements of size-resolved refractory BC (rBC) mass for particle diameters in the range of approximately 75–700 nm. In addition, through the leading-edge fit method (Gao et al., 2007), the SP2 can provide estimates of coating thickness on rBC particles. Combining the size-resolved coated rBC measurements with a total aerosol size distribution provides information on the fraction of total aerosol number containing rBC, thus providing a constraint on the population mixing state of rBC. Raatikainen et al. (2015) measured rBC mixing-state properties with an SP2 in the Finnish Arctic winter, finding 24 % of particles contain rBC with an average total particle to refractory rBC core diameter of 2. Similarly, Liu et al. (2015) found an average total particle to rBC core diameter of 2.25 (1.7–2.8) during an aircraft campaign in the European Arctic in March. For biomass burning plumes, Kondo et al. (2011) measured a ratio of 1.3–1.6 during aircraft flights in the spring and summer in the Canadian Arctic. Finally, Sharma et al. (2017) found a ratio of 1.4–1.25 at the Alert ground station in spring of 2012.
In this study, we present measurements of BC mixing state aboard the Alfred Wegener Institute (AWI) Polar 6 flights as part of the Network on Climate and Aerosols: Addressing Key Uncertainties in Remote Canadian Environments (NETCARE) and Polar Airborne Measurements and Arctic Regional Climate Model Simulation Project (PAMARCMiP). We use these measurements as constraints on the population mixing state to estimate the direct radiative effect (DRE) in the springtime Arctic and compare these estimates to the DRE calculated using bounding cases of completely external or internal mixing-state assumptions. Note that these measurements do not allow us to constrain the morphological mixing state. While this study focuses on the DRE, we note that other aerosol–radiation interaction processes, such as the semi-direct effect, may also depend on BC mixing state. In Sect. 2.1–2.3, we present the Polar 6 flight paths and size-resolved aerosol measurement setup. In Sect. 2.4, we discuss the chemical transport model and assumptions in the calculation of the DRE. In Sect. 3, we present observations of BC mixing state and implications for simulated DRE. We share our conclusions and study limitations in Sect. 4.

Figure 1Map showing the location of Alert and Eureka as well as the flight paths for the six flights in the Canadian high Arctic portion of the Polar 6 campaign. The flights were undertaken between 7 and 13 April 2015.
2.1 Flight overview and sample locations
As part of the Network on Climate and Aerosols: Addressing Key Uncertainties in Remote Canadian Environments project (NETCARE, http://www.netcare-project.ca; last access: 1 August 2018) and in collaboration with the Polar Airborne Measurements and Arctic Regional Climate Model Simulation Project (PAMARCMiP; Herber et al., 2012), measurements of aerosol, trace gases, and meteorological parameters were made in the high Arctic spring aboard the Alfred Wegener Institute (AWI) Polar 6 aircraft, a DC-3 aircraft converted to a Basler BT-67 (Herber et al., 2008). Measurements on a total of 10 flights took place from 4–22 April 2015 based at four stations: Longyearbyen, Svalbard (78.2∘ N, 15.6∘ E); Alert, Nunavut, Canada (82.5∘ N, 62.3∘ W); Eureka, Nunavut, Canada (80.0∘ N, 85.9∘ W); and Inuvik, Northwest Territories, Canada (68.4∘ N, 133.7∘ W). Polar 6 allowed for measurements from 60–6000 m, with a survey speed of ∼75 m s−1 (∼270 km h−1) with ascent and descent rates of ∼150 m min−1. This study uses observations from flights conducted at Alert and Eureka from 7–13 April 2015. Table S1 in the Supplement presents the date, departure location, and total flight time for the six flights used here. Flight tracks are shown in the map in Fig. 1.
Aerosol was sampled near-isokinetically through a stainless steel shrouded diffuser inlet located ahead of the engines. The inlet provided near-unity transmission of particles 20 nm to ∼1 µm in diameter at typical survey airspeeds, corresponding to a total flow rate of ∼55 L min−1. Bypass lines off the main inlet, at angles less than 90∘, carried aerosol to various instruments described in Sect. 2.2 and 2.3. Aerosol was not actively dried prior to sampling; however, the temperature in the inlet line within the aircraft cabin was > 15 ∘C warmer than the ambient temperature so that the relative humidity decreased significantly.
Periods when the aircraft was in-cloud were determined using data from a forward-scattering spectrometer cloud probe (FSSP-100; Droplet Measurement Technologies, Inc). The FSSP is an optical particle counter that detects droplets in the range of 2–50 µm in diameter. Any periods during which a signal above noise was registered by the FSSP were determined to be in-cloud times and were removed from the dataset. In total the aircraft was in-cloud for ∼0.3 % of the flight time.
2.2 Measurement of refractory black carbon
2.2.1 rBC number vs. rBC core diameter
Measurements of refractory black carbon (following the definition in Petzold et al., 2013) were made with a single-particle soot photometer (SP2; Droplet Measurement Technologies Inc). The SP2 detects individual particles using an intra-cavity Nd:YAG laser operating at 1064 nm. As particles pass through the laser beam, those that contain a strongly absorbing component at 1064 nm (such as black carbon) are heated to incandescence. Light emitted by the incandescing fraction of the particle is detected by a pair of photomultiplier tubes. The peak amplitude of the thermal radiation emitted by the incandescing particle is proportional to the mass of refractory material in the particle (Moteki and Kondo, 2007; Slowik et al., 2007). In this work, size-selected Aquadag particles (Acheson Industries) were used as an external standard for mass calibration of the SP2. Measured Aquadag mobility diameters were converted to rBC (refractory black carbon) mass using the size-dependent effective densities reported by Gysel et al. (2011). Recent studies have shown that the SP2 is more sensitive to Aquadag than it is to ambient rBC (Laborde et al., 2012; Moteki and Kondo, 2010). In order to account for this, we have scaled the slopes of the Aquadag-derived calibration curves by a factor of 0.70±0.05. This scaling factor was derived from Fig. 5 in Laborde et al. (2012), which shows the response of the SP2 to Aquadag and the response of the SP2 to rBC from diesel exhaust, wood smoke, and ambient particles.
Two single-particle soot photometers (referred to as SP2-1 and SP2-2) were used in this study. SP2-1 had a detection range of 0.40–323 fg rBC (equivalent to spherical diameters ranging from 75 to 700 nm at an rBC density of 1.8 g cm−3; Bond and Bergstrom, 2006), while SP2-2 had a detection range of 0.40–9.37 fg rBC (equivalent to spherical diameters ranging from 75 to 220 nm at an rBC density of 1.8 g cm−3; Bond and Bergstrom, 2006). SP2-1 was used to measure rBC number, since it had a wider size detection range than SP2-2. SP2-2 was used to determine coating thicknesses as a function of rBC core diameter due to a misalignment of an optical detector needed for coating analysis in SP2-1. Both SP2s were calibrated against size-selected external BC standards. The lower limit for mass was set at a point at which detection efficiency for particles compared to a CPC was close to 100 %.
2.2.2 rBC coating thickness vs. rBC core diameter
As particles pass through the laser beam in the SP2 they elastically scatter light at 1064 nm. For particles that contain rBC, the particle may be heated and begin to vaporize before the scattering intensity reaches the peak value that an unperturbed particle would have reached. In this case, the unperturbed scattering amplitude can be retrieved by fitting the leading edge of the particle's scattering signal as described by Gao et al. (2007). In the leading-edge fit method, the center position and width of a Gaussian (which reflects the laser beam profile) are fixed from the scattering profiles of non-incandescing particles collected during the preceding and following hour. The unperturbed peak scattering amplitude for an incandescing particle is then determined by fitting the measured scattering profile up to 5 % of the peak scattering intensity using the fixed width and center position and allowing only the amplitude to vary. Fitting the profile only up to 5 % of peak elastic scattering intensity allows the unperturbed peak amplitude to be retrieved. For an individual particle the uncertainty in reproducing the unperturbed amplitude is ∼70 % (∼20 % uncertainty in optical size) but since this uncertainty is random it does not systematically impact our results.
With the scattering amplitude determined by the leading-edge technique and the measured rBC core diameter, a core–shell Mie model can be used to determine the optical diameter of the rBC-containing particles. In the Mie model we used a refractive index of 2.26–1.26i for rBC (Moteki et al., 2010), which is appropriate for rBC from fossil fuel combustion. Other studies have used this value in analyses of particles from urban areas (Laborde et al., 2013) and from biomass burning (Taylor et al., 2014). In the Mie model we used a refractive index of 1.5–0.0i for the coating species. The value of 1.5–0.0i is appropriate for dry sulfate and sodium chloride (Schwarz et al., 2008a, b). Previous studies have shown that varying the refractive index used for the rBC coating material from 1.45 to 1.59 had a minor impact on coating thickness (Taylor et al., 2015).
Although the SP2 can measure individual particle rBC mass down to 0.40 fg (∼75 nm VED) the elastic scattering optical detectors can only measure scattering from bare rBC particles with volume-equivalent diameters of ∼120 nm or greater. As a result, when rBC cores have a diameter smaller than 120 nm only those cores with significant coatings will produce a measurable elastic scattering signal. Additionally, in practice fewer than 90 % of particles with an rBC core diameter of less than 140 nm are successfully assigned a coating. This is because the leading-edge fit method uses two detectors to accurately determine the coating thickness. One of these is a two-element scattering detector used to determine the position of a particle in the laser beam. With this two-element detector, the scattering signal from a particle passing through the laser has a clear notch when it passes the gap between detecting elements and this notch position is used to locate the particle in the beam. In some cases, rBC-containing particles may evaporate prior to crossing the notch position and, as a result, their coating thickness cannot be determined. This happens more frequently for smaller particles. As a result of the two caveats discussed above, there is a bias toward thicker coatings for rBC cores < 140 nm. To account for this bias, we calculate minimum, median, and maximum bounding cases for coating thickness for rBC core diameters less than 140 nm. A detailed discussion of the estimation of each case and the resulting impact on the DRE is included in the Supplement. As we do not see a substantial difference in the DRE across the three bounding cases, we focus on the median value for the remainder of this text. The median estimate of coating thickness for rBC core diameters less than 140 nm is taken as the overall median coating thickness across core diameters 140 to 220 nm.
2.3 Measurement of total aerosol size distributions
Total aerosol size distributions for particles with diameters in the range of 85–1000 nm were measured by an ultrahigh-sensitivity aerosol spectrometer (UHSAS; Droplet Measurement Technology Inc). The UHSAS is a laser-based aerosol spectrometer in which particles intercept the beam of a solid-state Nd3 LiF4 laser operating at ∼1054 nm. Two sets of Mangin mirrors focus light scattered by the particles onto two detectors; one a high-gain avalanche photodiode for detecting particles smaller than 250 nm and the other a low-gain PIN photodiode for the detection of particles larger than 250 nm. Counting efficiency for the UHSAS is > 95 % for particle concentrations < 3000 cm−3. Further details of the instrument operating principles can be found in Cai et al. (2008). The UHSAS was calibrated during operations using polystyrene latex spheres (PSLs), which have a refractive index of n=1.59. Kupc et al. (2018) investigated the size dependence of UHSAS measurements on the assumed refractive index of the particles being measured. For particles with diameters smaller than 600 nm and real refractive indices of n=1.44–1.58, the diameter measured by the UHSAS varied by +4 to −10 % (relative to the refractive index of ammonium sulfate; n=1.52). For this study, a shift in the UHSAS size distribution by 10 % would change the fraction of particles containing rBC by less than 3 %, which has a negligible impact on the DRE calculations. Details of the calibration and comparison with other in-flight measurements can be found in Leaitch et al. (2016), Willis et al. (2016), and Burkart et al. (2017).
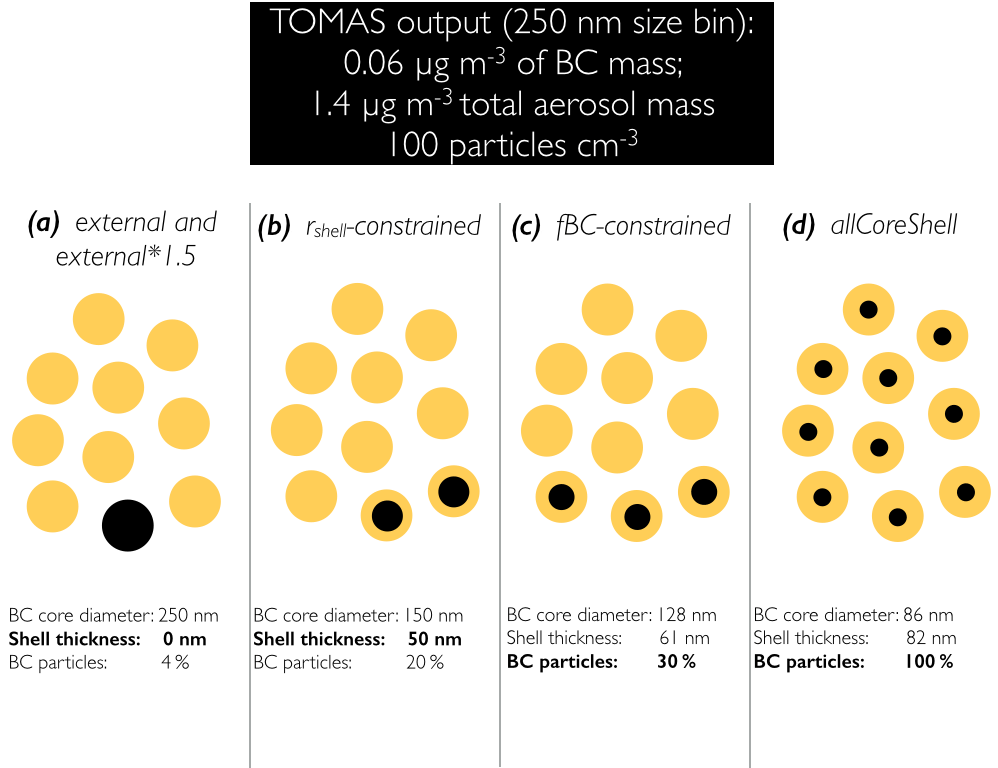
Figure 2Schematic presenting the different BC mixing states for the TOMAS size bin corresponding to particle diameters of 250 nm. The bold text shows the parameter being constrained in each mixing state. In this example, GEOS-Chem–TOMAS simulates 4 % BC mass fraction and a particle number concentration of 100 cm−3. In the external mixing-state assumption, all BC mass forms separate particles (rounded to 1 particle out of 10 for convenience), while in the allCoreShell mixing-state assumption, all BC mass is spread among all particles. The rshell-constrained mixing state uses SP2 measurements to constrain BC core diameter and shell thickness. The fBC-constrained mixing state uses BC-containing particle fractions from the SP2 and UHAS as the constraint on mixing state.
One potential issue with using the UHSAS aboard an aircraft is that as the pressure changes during ascent and descent, the sample flow at the inlet of the chamber can deviate from the measured and regulated flow at the outlet of the chamber (Brock et al., 2011; Kupc et al., 2018), which results in inaccurate particle concentration measurements. Brock et al. (2011) saw particle number deviations from a reference counter of ∼10–15 % on ascent and descent. In this study, comparison to counts of non-incandescent particles from the SP2, which was on the same inlet line, suggest that particle counts deviated by < 5 %.
2.4 Determination of the fraction of total aerosols containing rBC vs. aerosol diameter
To determine the fraction of total aerosol particles containing rBC as a function of size, we first determined the number size distribution of the rBC-containing particles, this time accounting for both the rBC core diameter and the thickness of any coating material. This was done by taking the number size distribution of the rBC cores determined from SP2-1 (Sect. 2.2.1) and applying the coating thicknesses as a function of rBC core size determined from SP2-2 (Sect. 2.2.2). Once the number size distribution of the rBC-containing particles was determined, the fraction of rBC-containing particles as a function of size was determined by dividing the number size distribution of the rBC-containing particles by the number size distribution of the total aerosol determined by the UHSA (Sect. 2.3). As with the coating analysis, this process was carried out separately for each flight and the averages of all flights were combined with GEOS-Chem–TOMAS simulations. Additional details are given in the Supplement.
2.5 Model overview
2.5.1 GEOS-Chem–TOMAS
To simulate aerosol concentrations in the Arctic, we use the Goddard Earth Observing System chemical transport model, GEOS-Chem version 10.01. We simulate April 2015 with 2 months of spin-up not included in the analysis. Transport in GEOS-Chem is driven by MERRA reanalysis meteorology fields. This version of GEOS-Chem uses a horizontal resolution of 4∘ latitude by 5∘ longitude with 47 vertical layers.
Aerosol microphysics is simulated using the TwO-Moment Aerosol Sectional (TOMAS) microphysics scheme (Adams and Seinfeld, 2002) coupled with GEOS-Chem (known as GEOS-Chem–TOMAS). The version of TOMAS used in this study includes 40 size bins ranging from diameters of approximately 1 nm to 10 µm (the exact diameter depends on the density of the aerosol). TOMAS includes tracers for sulfate, BC, organic aerosol, sea salt, dust, and aerosol water. In this work, we will use the term “BC” when referring to simulated mass concentration and “rBC” when referring to measurements made with the SP2. A description of aerosol microphysics in TOMAS is included in Adams and Seinfeld (2002), Lee et al. (2013), and Lee and Adams (2012). Croft et al. (2016a) compare aerosol size distributions simulated by GEOS-Chem–TOMAS to observations at Alert, Nunavut, and Mt. Zeppelin, Svalbard, and include a description of the settings used here.
Global anthropogenic emissions are derived from the Emissions Database for Global Atmospheric Research (EDGAR) Hemispheric Transport of Air Pollution (HTAP) version 2.2 (Janssens-Maenhout et al., 2015). Following the recommendation in Xu et al. (2017), we include BC and organic carbon emissions from gas flaring derived from the Evaluating the Climate and Air Quality Impacts of Short-Lived Pollutants (ECLIPSE) emission inventory (Klimont et al., 2017). Biomass burning emissions are from the Fire Inventory from NCAR (FINN) for the year 2015 (Wiedinmyer et al., 2011). Dust aerosol emissions follow the DEAD scheme (Zender et al., 2003), while sea salt aerosol emissions are based on the scheme of Jaeglé et al. (2011).
2.5.2 Direct radiative effect calculation
The all-sky direct radiative effect is estimated using an offline version of the Rapid Radiative Transfer Model for GCMs (RRTMG; Iacono et al., 2008), following the online version implemented in GEOS-Chem (Heald et al., 2014). RRTMG treats clouds using the Monte Carlo independent column approximation (McICA; Pincus et al., 2003). Aerosol optical properties are calculated using monthly averaged aerosol mass and number concentrations with refractive indices from the Global Aerosol Dataset (GADS). We use Mie code published in Bohren and Huffman (1983) to calculate aerosol optical depth, single scattering albedo, and asymmetry parameter. Available code includes Mie calculations for two concentric spheres (for use in core–shell morphologies). The use of monthly mean aerosol and cloud properties is a limitation of this study; however, we feel this is sufficient to explore the impacts of different BC mixing-state assumptions on the DRE.
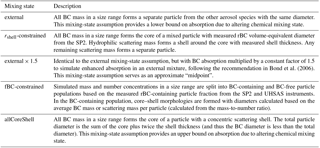
2.5.3 Description of aerosol mixing states
We calculate the DRE with five BC mixing states, which are outlined in Table 1. Figure 2 is a schematic of the mixing states. We discuss a numerical example at the end of this section that follows Fig. 2. In the external mixing state, all BC exists as a separate particle from the other aerosol species (Fig. 2a). The external × 1.5 mixing state multiplies the BC absorption in the external mixing state by a factor of 1.5 to simulate absorption when BC is mixed internally, following the recommendation in Bond et al. (2006b). As the external × 1.5 mixing state only modifies the absorption from the external mixing state, we do not explicitly animate it in Fig. 2. Conversely to the external mixing state, the allCoreShell assumption treats all BC mass in each size bin as the core with other hydrophilic species forming a shell around the BC core (Fig. 2d). The external and allCoreShell mixing states are bounding cases, assuming that 0 and 100 %, respectively, of BC particles are mixed with the other aerosol components. The external × 1.5 mixing state is included as a reference point between the two bounding cases.
We compare these assumed mixing states to two mixing states based on the measurements described in Sect. 2.2–2.3. These measurements constrain only the population mixing state. For cases of mixed BC, we assume an ideal core–shell mixture, but note that this morphological mixing state is an important uncertainty (China et al., 2015). The rshell-constrained mixing state uses measurements from the SP2 of shell thickness as a function of core diameter to constrain BC mixing state (Fig. 2b). Across the SP2 size range, we take the total BC mass in a given size bin simulated by TOMAS and form BC cores with diameters given by the SP2 measurements. We then take the total scattering mass simulated by TOMAS in the same size bin and form concentric surrounding shells based on the thickness measured by the SP2. Any remaining scattering aerosol mass forms a separate particle with no BC included. Outside of the SP2 size range, we retain the ratio of rBC core diameter to total particle diameter at the lower and upper edge of the SP2 range and apply that to estimate core and shell diameters for the remaining TOMAS size bins. Using the measured rBC core diameter and shell thickness from the SP2, the resulting fraction of BC-containing particles for a given size range can be described by Eq. (1):
where ρshell is the density of the shell, rshell is the shell thickness, ρBC is the density of the BC core, rcore is the radius of the core, Mtot is the total aerosol mass, and MBC is the mass of BC. The numerator in Eq. (1) describes the BC mass fraction of the aerosol population for a given size range, while the denominator describes the BC mass fraction for a single aerosol particle. The resulting fraction of BC-containing particles is thus a function of the BC mass fraction and the ratio of the BC radius to the total particle radius. In our approach, values for rshell and rcore are taken from the SP2 measurements, while MBC and Mtot are simulated by GEOS-Chem–TOMAS. The rshell-constrained BC mixing state will not reproduce the measured fraction of rBC-containing particles unless the ratio of BC and scattering mass is similar to observed with the SP2 and UHSAS.
The second measurement-constrained mixing state, fBC-constrained, uses the size-dependent fraction of all particles containing rBC as the measurement constraint (Fig. 2c). In a given size range, we separate total aerosol mass and number (simulated by TOMAS) into a population containing BC and a population not containing BC based on the measured fraction of particles containing BC. We then form BC cores and scattering shells based on the simulated mass-to-number ratio and assumed density for each species. Using the fraction of rBC-containing particles measured with the SP2 and UHSAS, the resulting BC core diameter and shell thickness can be calculated by Eqs. (2) and (3):
where dcore is the BC core diameter, fBC is the fraction of BC-containing particles measured with the SP2 and UHSAS, N is the total particle number, and dtot is the total particle diameter in the given TOMAS size bin. Similarly, this method will not produce the measured rBC core diameter and shell thickness unless TOMAS simulates a similar ratio of BC to scattering mass as is observed. For both rshell-constrained and fBC-constrained, we use the median measured values across all flights (see the Supplement for explanation), and we compare results of the minimum, median, and maximum cases based on the uncertainties in SP2 measurements in the 100–140 nm diameter size range in the Supplement.
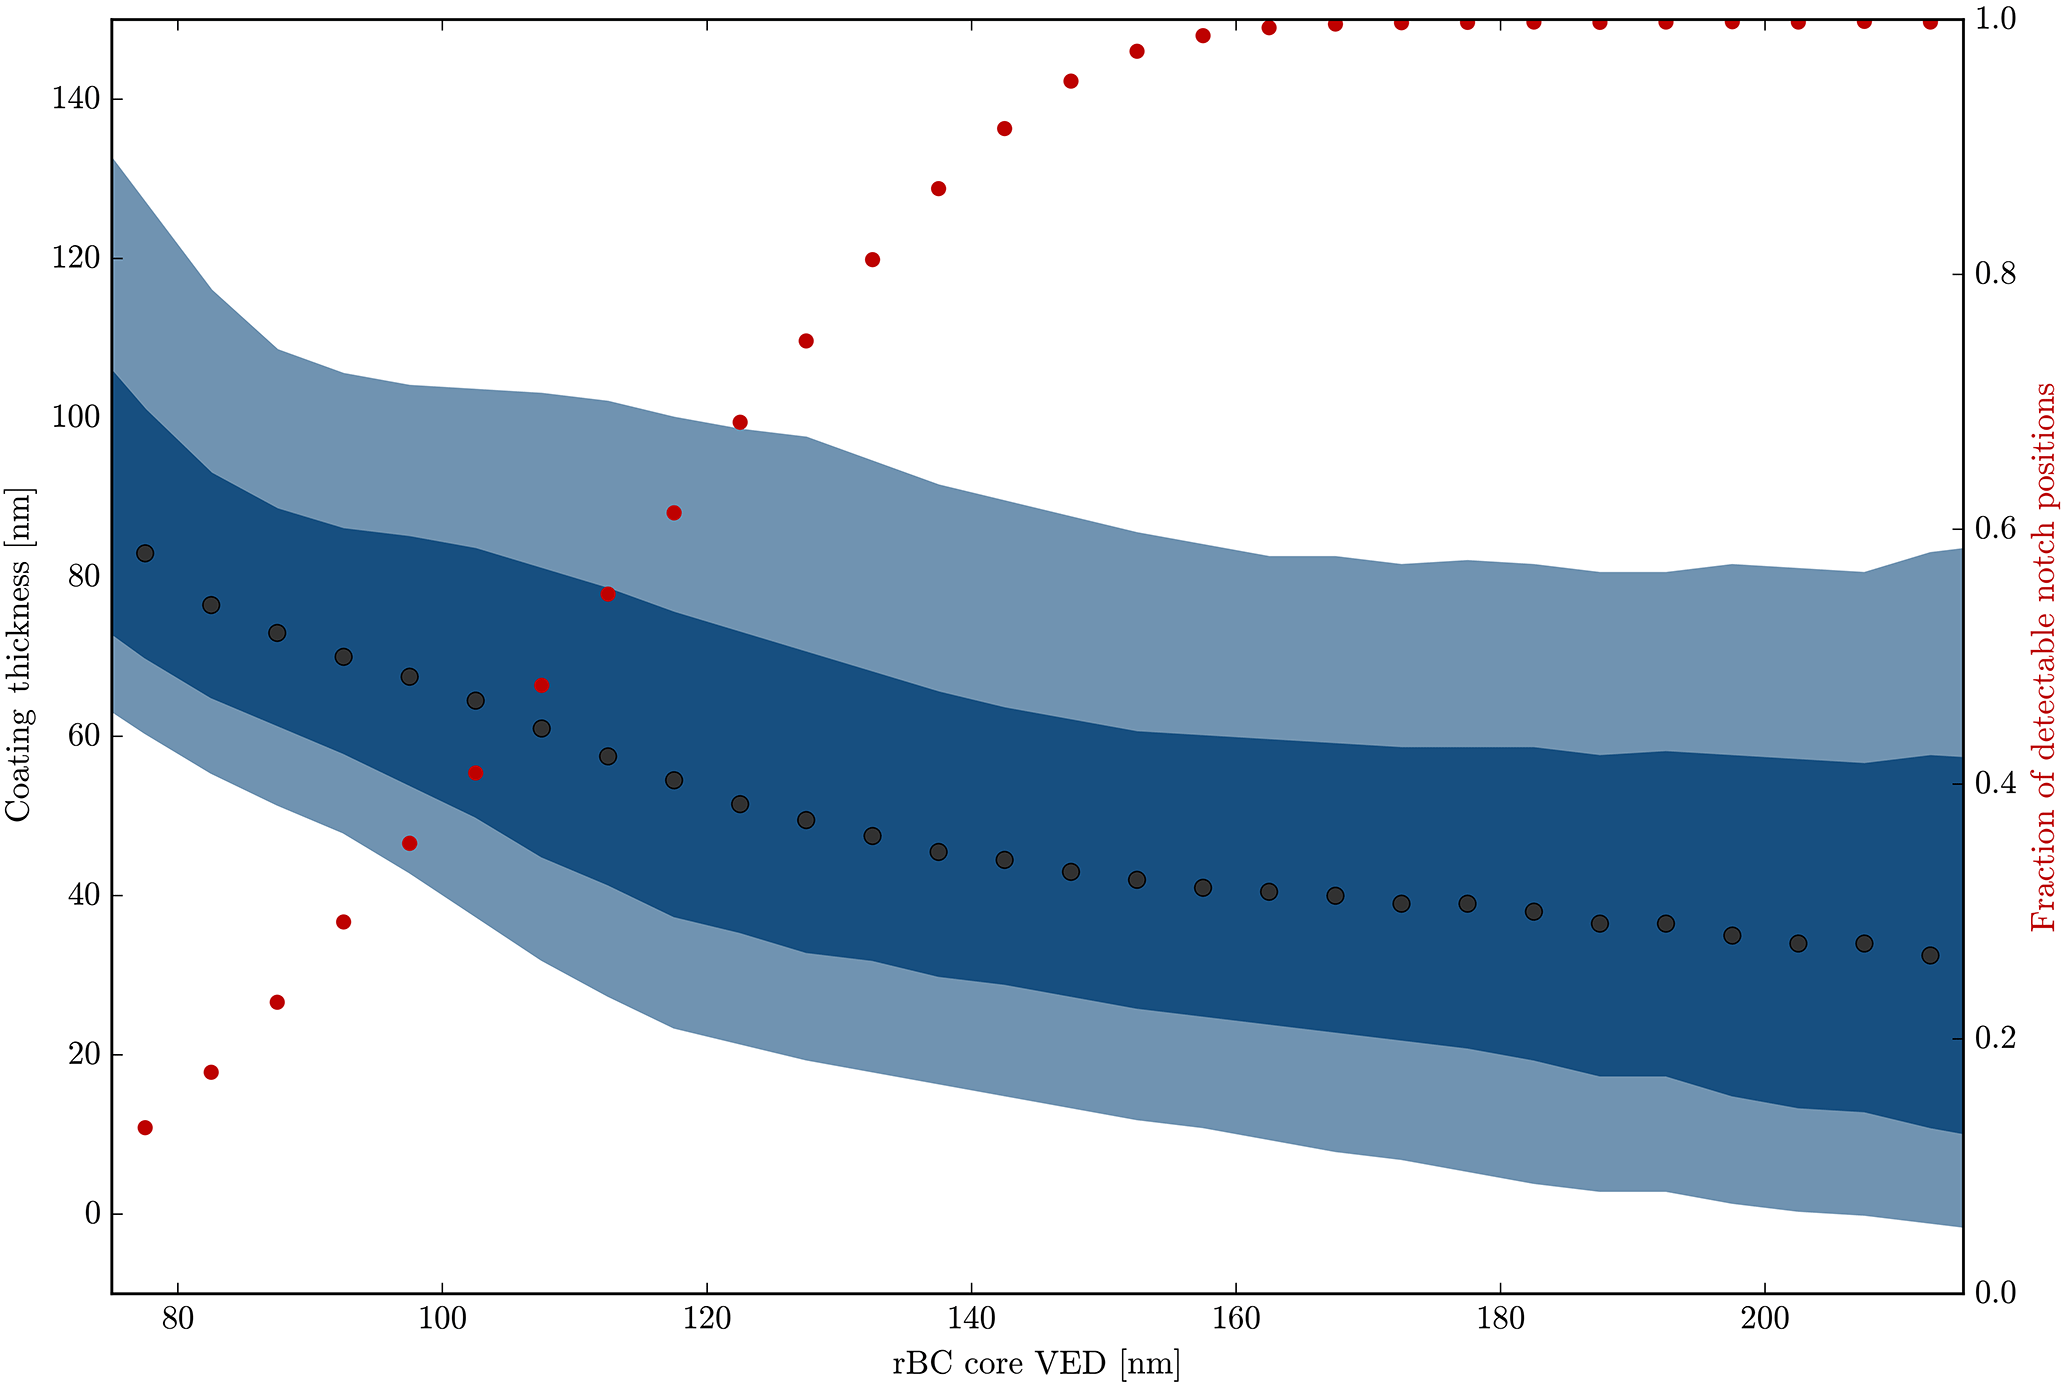
Figure 3Coating thickness as a function of rBC core diameter. Grey markers are the median, dark shaded area is the 25th–75th percentile, lighter shaded area is the 10th–90th percentile of coating thicknesses for each bin.
The different mixing states are depicted schematically in Fig. 2 with the bold text highlighting the parameter being constrained in each case. As an example, we depict the TOMAS size bin for 250 nm diameter particles for which GEOS-Chem–TOMAS simulates a particle number concentration of 100 cm−3 and a ratio of BC to total aerosol mass of 4 %. In the external mixing-state assumption (Fig. 2a), the 0.06 µg m−3 of BC mass is used to form pure BC particles with diameters of 250 nm (by definition, a shell thickness of 0 nm). This results in 4 % of the particle number concentration being pure BC particles, while the remaining particles are composed of non-BC species also with diameters of 250 nm (for convenience, 1 out of 10 particles in the schematic depiction of external is pure BC). In the rshell-constrained mixing state (Fig. 2b), we use the observed rBC core diameter and corresponding shell thickness from the SP2 measurements (in this example a core of 150 nm and a shell thickness of 50 nm) to allocate the same 0.06 µg m−3 BC mass into mixed particles with total diameter 250 nm. As the BC diameter is now only 150 nm, the resulting BC-containing particle number fraction is 20 %. In the fBC-constrained mixing state (Fig. 2c), we instead constrain by the fraction of rBC-containing particles measured with the SP2 and UHSAS (30 % in this example). To allocate the same BC mass onto 30 % of particles, the BC core diameter has to equal 128 nm, resulting in a shell thickness of 61 nm (to create a particle with total diameter of 250 nm). Finally, to allocate the same BC mass onto all particles in the allCoreShell mixing-state assumption (Fig. 2d), the BC core diameter is further reduced to 86 nm and the shell thickness increased to 82 nm.
3.1 Measurements of coating thickness as a function of rBC core size and fraction of rBC-containing particles
Figure 3 shows measured coating thickness as a function of the volume-equivalent diameter (VED) of the rBC cores (both the rBC cores and the coating are assumed to be spherical). The alternate axis gives the fraction of detectable notch positions (see Sect. 2.2.4 for details). The black dots represent the median and the shaded regions represent the interquartile range and 10th–90th percentile range of measurements for all particles across the different flights and altitudes. For rBC core diameters ranging from 140–220 nm (the region with greater than 90 % successful fits), the median measured coating thickness decreases slightly from 45 to 40 nm (with an interquartile range of 30–70 to 17–65 nm). This results in total particle to rBC core diameter ratios ranging from 1.6 (IQR: 1.4–2.0) for rBC cores at 140 nm to 1.4 (IQR: 1.2–1.6) for rBC cores at 220 nm. This range is similar to measurements in the Canadian Arctic by Kondo et al. (2011). When combining with model results, we use only the measured core and shell thicknesses in the range with greater than 90 % detectable notch positions (i.e., core diameters larger than 140 nm) and use minimum and maximum bounding assumptions in the region 70–140 nm. Figure S2 shows the minimum and maximum shell thickness across the range 70–700 nm. A detailed examination of vertical variability in rBC measurements from this campaign is included in Schulz et al. (2018).
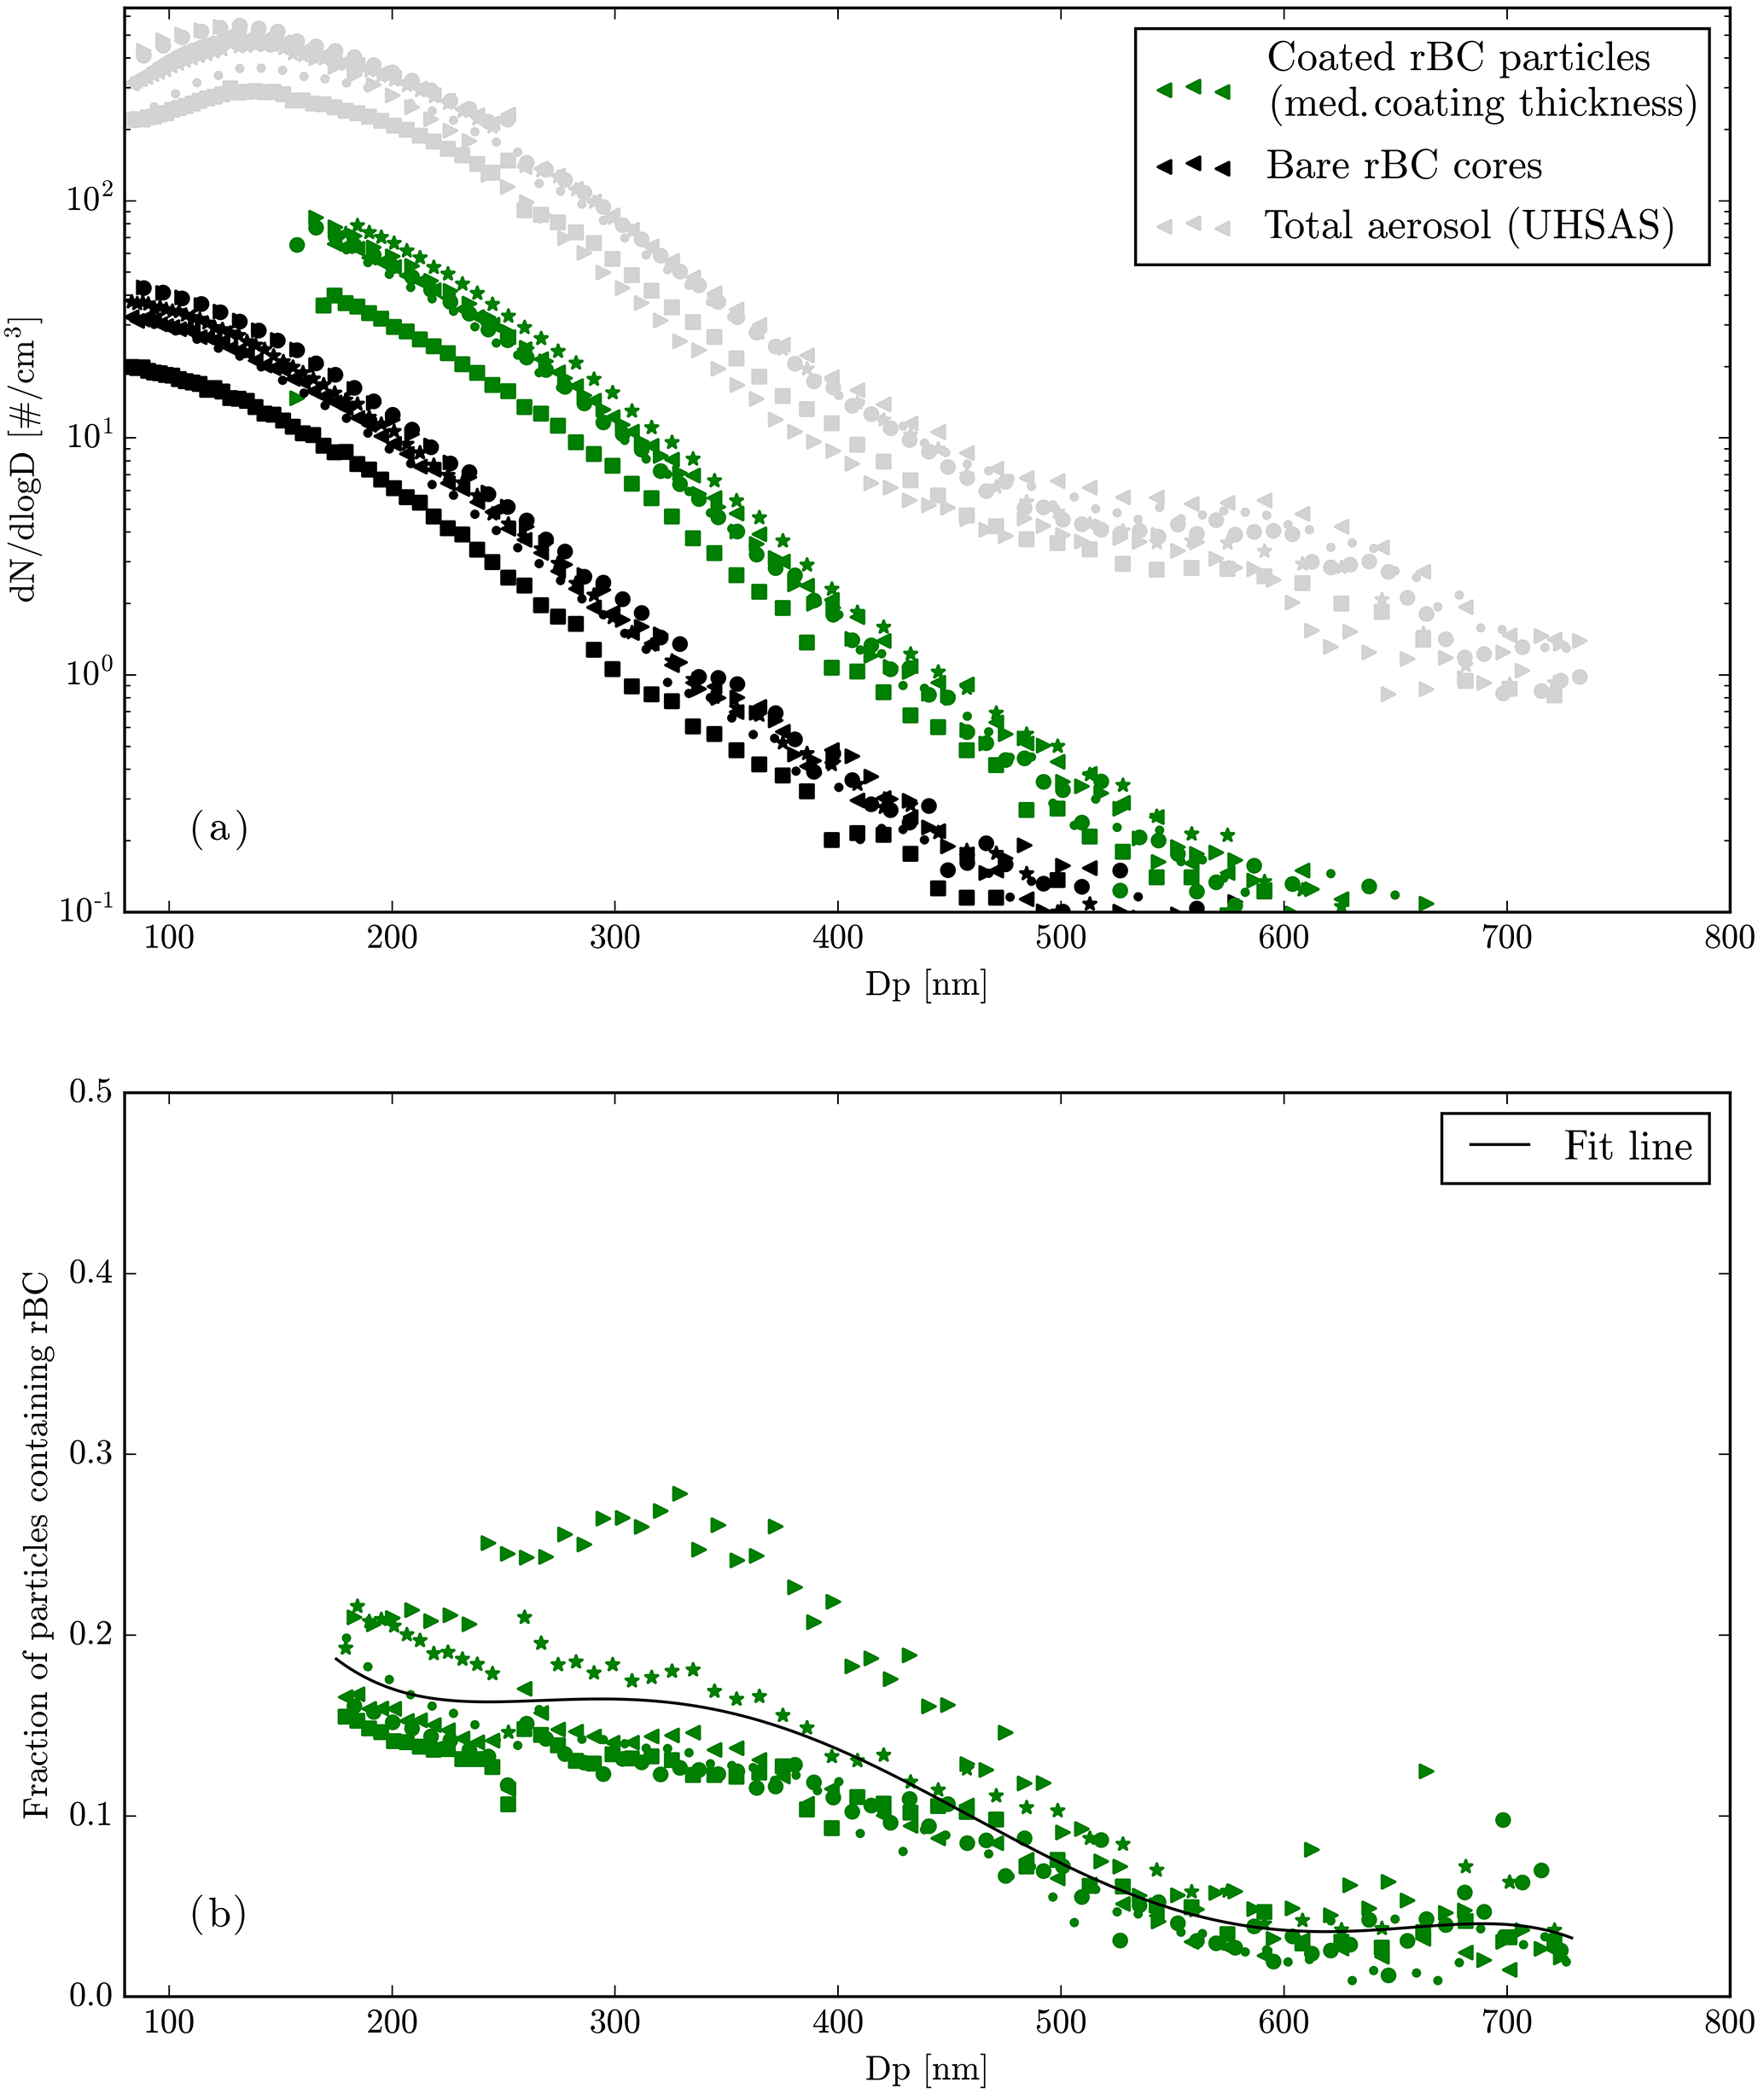
Figure 4Number distributions for the bare rBC cores (black), the coated rBC-containing particles (green), and the total aerosol as detected by the UHSAS (grey) for the median coating thickness scenario. Shown in the bottom panel is the distribution of the fraction of the total aerosol containing rBC in the median coating scenario. The solid black line is a polynomial fit to the observations following the form (with × in nm) y=1.25 – – – .
Across all flights (and altitudes), we do not find substantial variability in measured coating thickness. This lack of variability is likely due to atmospheric processing over several days during transport of the air mass to the Arctic region. In the Supplement, we plot coating thickness for each flight in Fig. S3. The low degree of variability across flights justifies the use of campaign averages in our model analysis.
Figure 4a shows the measured number distributions for uncoated rBC, coated rBC, and total particle number, with sets of symbols representing the average across an individual flight. The diameters of the coated rBC particles represent a sum of the rBC core diameter and twice the shell thickness. The total aerosol size distribution has a mode centered near 150 nm, similar to measured accumulation-mode particles in the Arctic spring reported in Croft et al. (2016a). The bare rBC size distribution peaks below the 70 nm size limit of the SP2. To estimate the size-resolved fraction of particles containing rBC, we take the ratio of the SP2-coated rBC particles and the UHSAS total particle size distribution (Fig. 4b). The solid line in Fig. 4b is the best fit to the experimental data shown in Fig. 4b. A polynomial function was used because this gave a good fit to the experimental data. The coefficients for this fit are provided in the caption to Fig. 4; however, we note that this fit is derived only from measurements in the springtime Arctic and is not based on any underlying understanding of the chemical or physical processes involved. With this polynomial fit, we find that 16 % of particles in the 175–330 nm diameter size range contain rBC, with values ranging from 10–29 %. For particles with diameters ranging between 550 and 730 nm, this fraction decreases to 3 %. This result is similar in magnitude to surface measurements of rBC-containing particle fractions from Sharma et al. (2017) for Alert, Canada. In general, we expect chemically aged plumes to be more internally mixed (through condensation and coagulation). The relatively low fractions of rBC-containing particles measured here may suggest local sources of non-BC accumulation-mode particles, such as sea salt, which is common in April at Alert (e.g., Leaitch et al., 2018), or slow coagulation timescales.
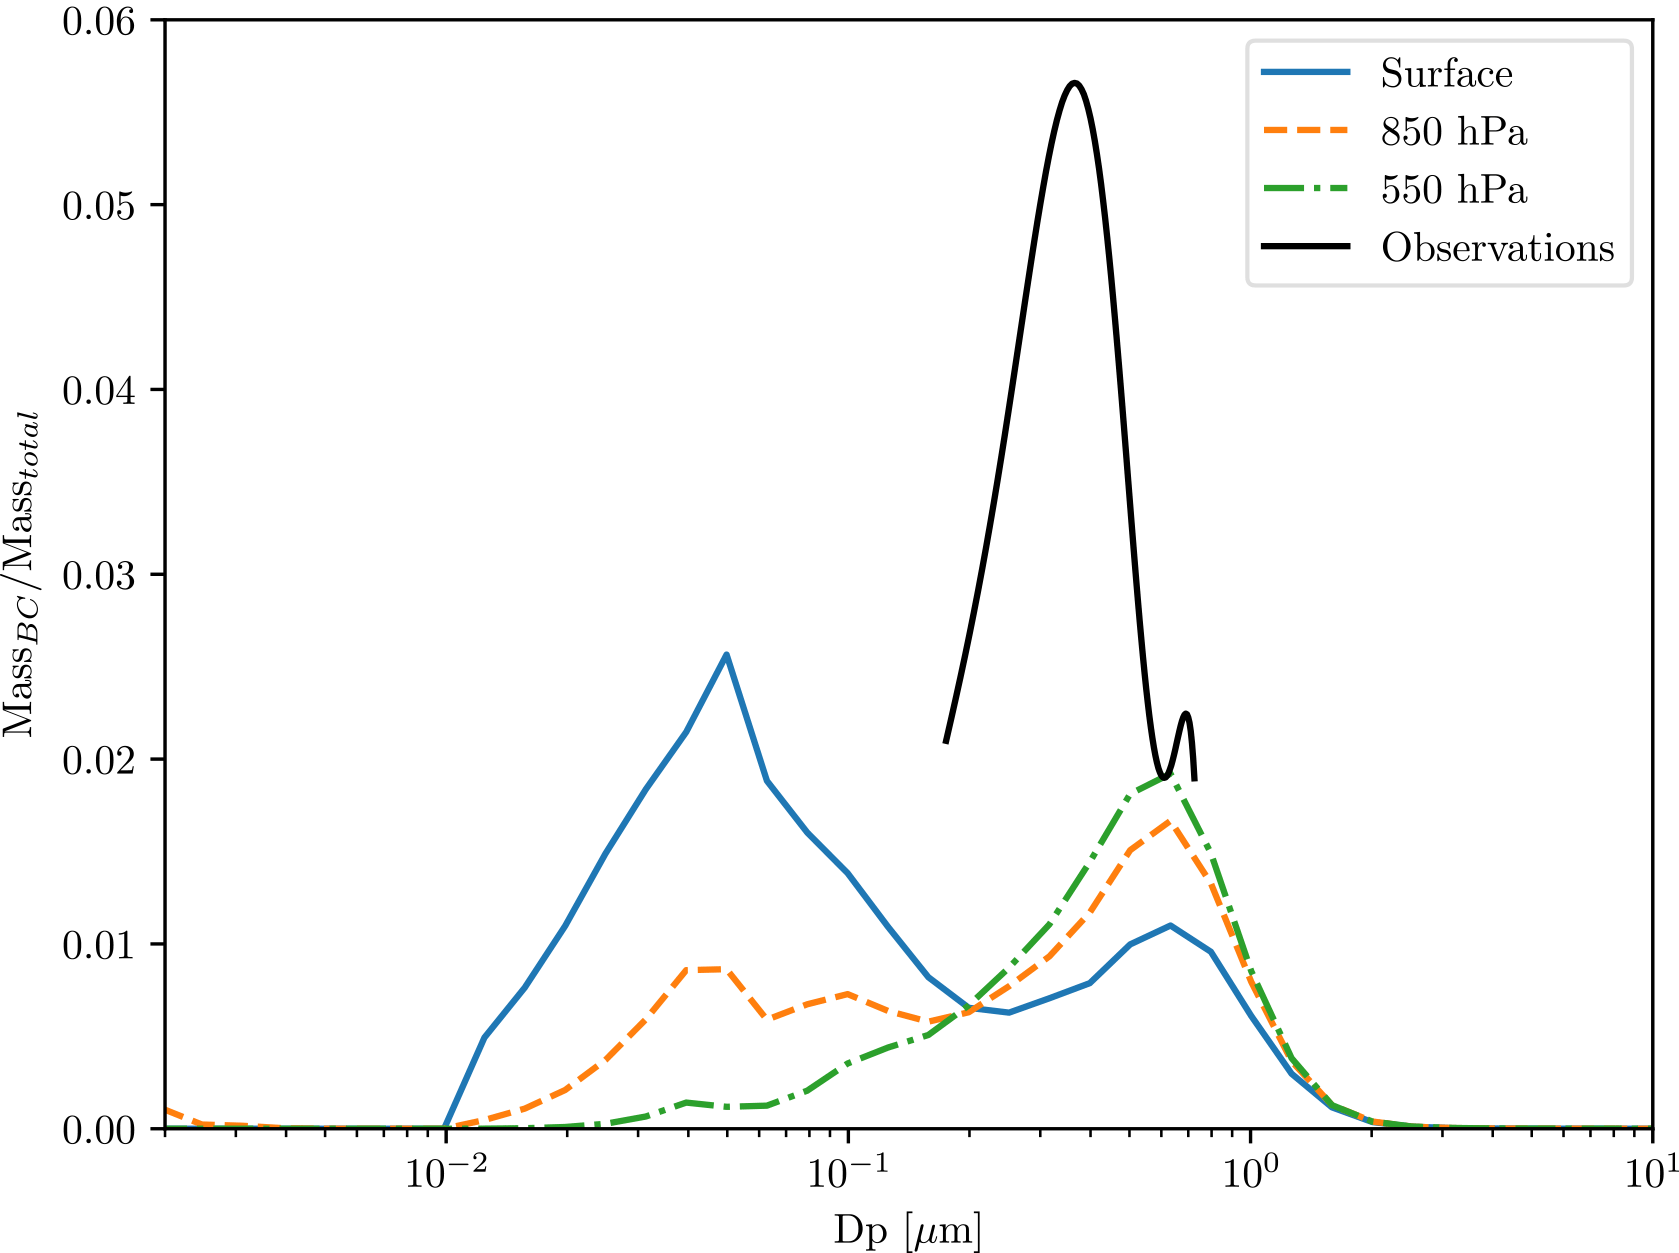
Figure 5The fraction of BC aerosol mass relative to total aerosol mass at each size bin in GEOS-Chem–TOMAS at three vertical levels along with the fraction determined from the SP2 and UHSAS observations.
3.2 Comparison to model simulations
Figure 5 shows the size-resolved fraction of BC mass relative to total aerosol mass based on the ratio of the SP2 to USHAS compared to GEOS-Chem–TOMAS simulations. Due to instrument constraints, the measured size range is restricted to diameters of 175–730 nm compared to the TOMAS size range of 1 nm to 10 µm. Across the measurement size range, TOMAS predicts a lower BC mass fraction relative to total aerosol mass except at higher altitudes (∼550 hPa) for diameters of 700 nm. The lower BC mass fraction is a result of both lower BC mass concentrations and higher non-BC mass simulated in GEOS-Chem–TOMAS than observed in the SP2 and UHSAS. The lower BC mass concentrations may be due to the representation of dry and wet scavenging in TOMAS, which does not include recent updates described in Qi et al. (2017b, c). In TOMAS, BC mass fraction is the greatest at the surface for sub-200 nm diameter particles with a second peak at higher altitudes for particle diameters around 700 nm. In the model, these BC mass fractions translate to a contribution of roughly 1 %–5 % of optical extinction from BC to the total aerosol optical extinction in the Arctic (calculated assuming fully externally mixed BC).
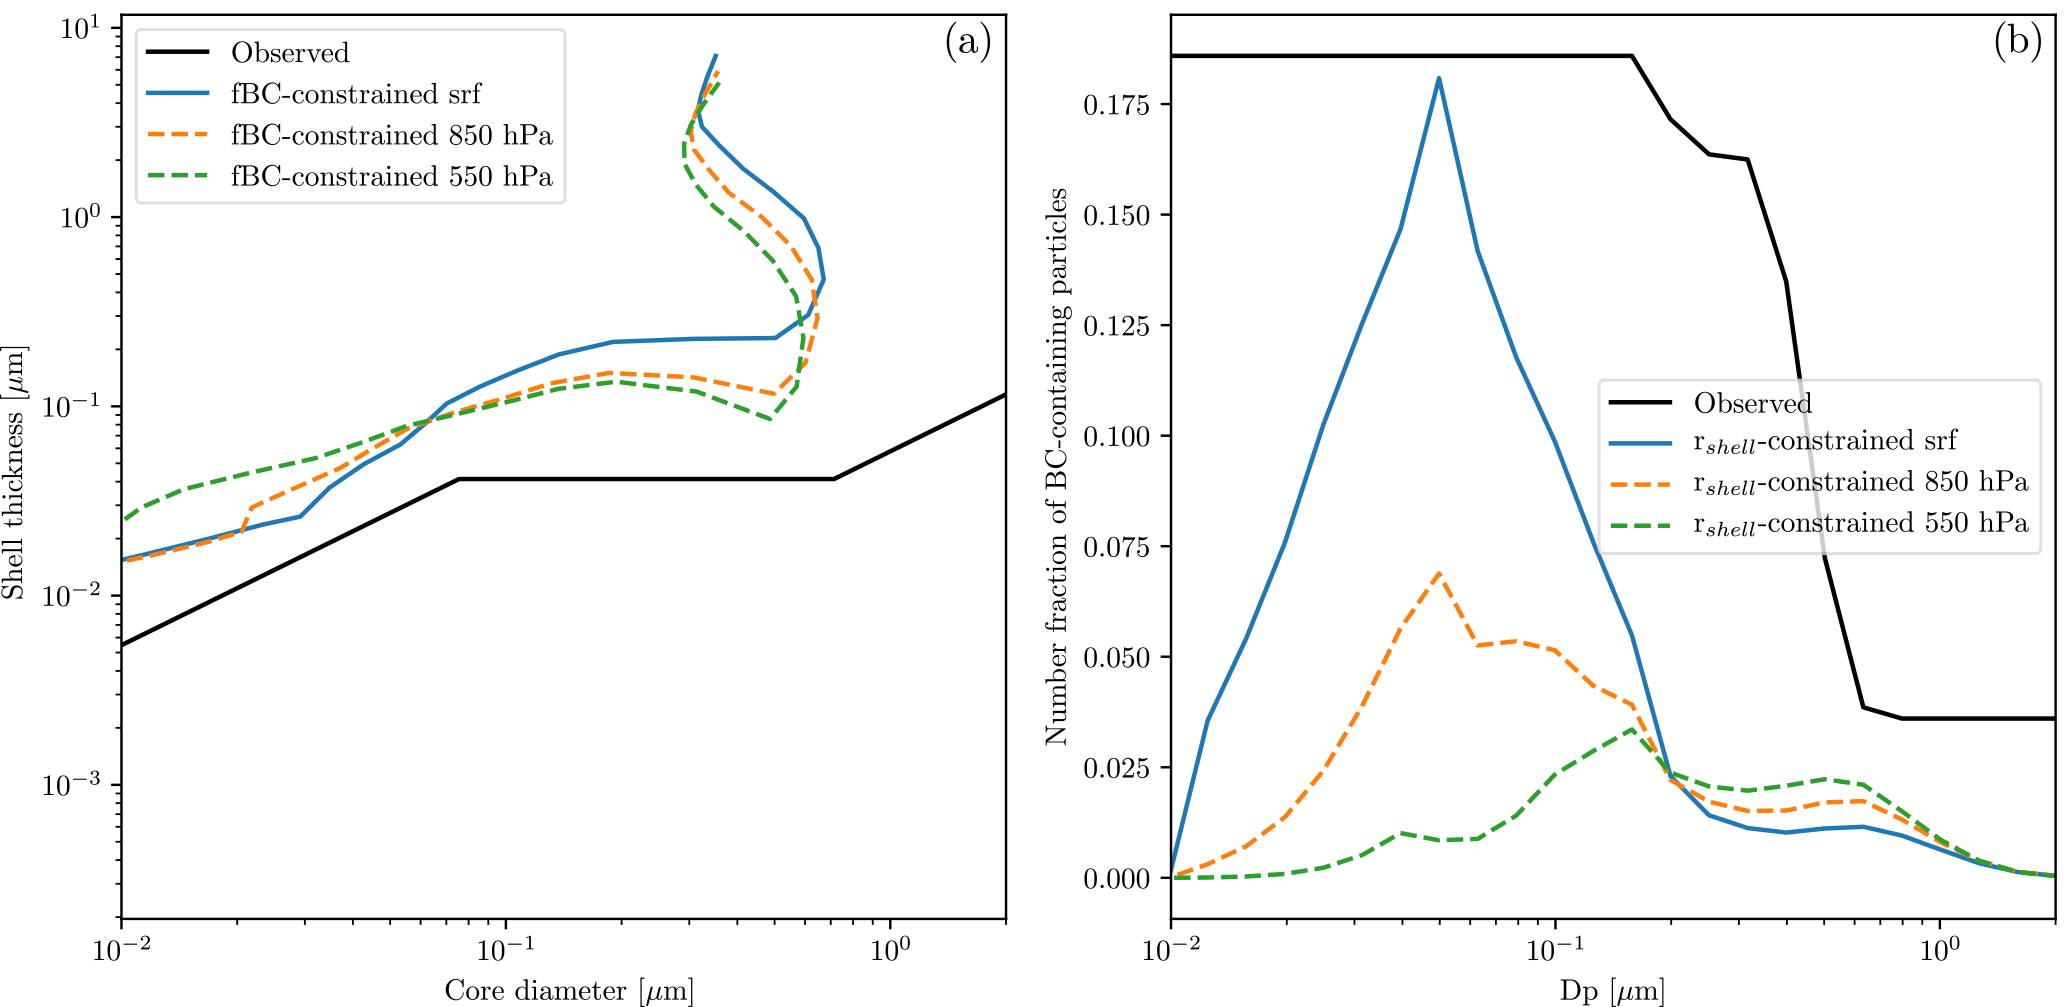
Figure 6The simulated pan-Arctic mean shell thickness as a function of BC core diameter when the number fraction of BC is constrained by observations (a), and the simulated number fraction of BC when shell thickness as a function of core diameter is constrained by observations (b).
As the ratio of BC mass to total aerosol mass in TOMAS is lower than in measurements, the two different mixing-state constraints (rshell-constrained and fBC-constrained) do not converge with the measurements. The effect of this is shown in Fig. 6. In Fig. 6a, we constrain all grid cells in the Arctic to have the measured fraction of BC-containing particles (shown in Fig. 4b and re-binned to the TOMAS size bins in the black line in Fig. 6b) and calculate the resulting BC core diameter and shell thickness. The black line in Fig. 6a presents the measured core diameter and shell thickness for comparison. As the relative BC mass to total aerosol mass in TOMAS is less than observed (Fig. 5), this results in smaller BC core diameters and larger shell thicknesses. Similarly, in Fig. 6b, we constrain TOMAS aerosol mass to have the measured BC core diameters and shell thickness (shown in Fig. 3 and re-binned to TOMAS sizes in the black line in Fig. 3a) and calculate the resulting fraction of BC-containing particles. The resulting fraction of BC-containing particles for diameters of 200 nm using the rshell-constrained method is a factor of 6 less than observed. If the BC mass to total aerosol mass ratio in GEOS-Chem–TOMAS matched the observations, both the shell thickness and fraction of BC-containing particles could be constrained simultaneously.
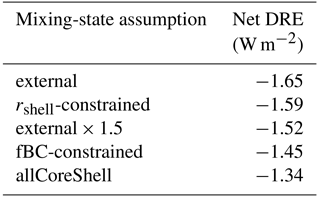
Table 2The net direct radiative effect (DRE) calculated using each mixing state averaged over the Arctic for April.
3.3 Implications for the direct radiative effect
To explore the impact of mixing state on DRE in the Arctic spring, we calculate the DRE due to all aerosol with the bounding mixing-state assumptions and the measurement constraints on mixing state. Figure 7 shows the net DRE over the Arctic for April assuming all BC is externally mixed. The pan-Arctic average DRE is −1.65 W m−2, but locally there are regions of opposing sign. Regions with a slight positive DRE are areas where the aerosol mixture is darker than the underlying albedo. This occurs mostly over snow-covered land surfaces as opposed to oceans where the water and sea ice have a lower albedo and the aerosol mixture is more reflective than the surface. We include a map of monthly mean albedo for the Arctic in April in the Supplement. We note that this result is likely sensitive to monthly average albedo estimates.
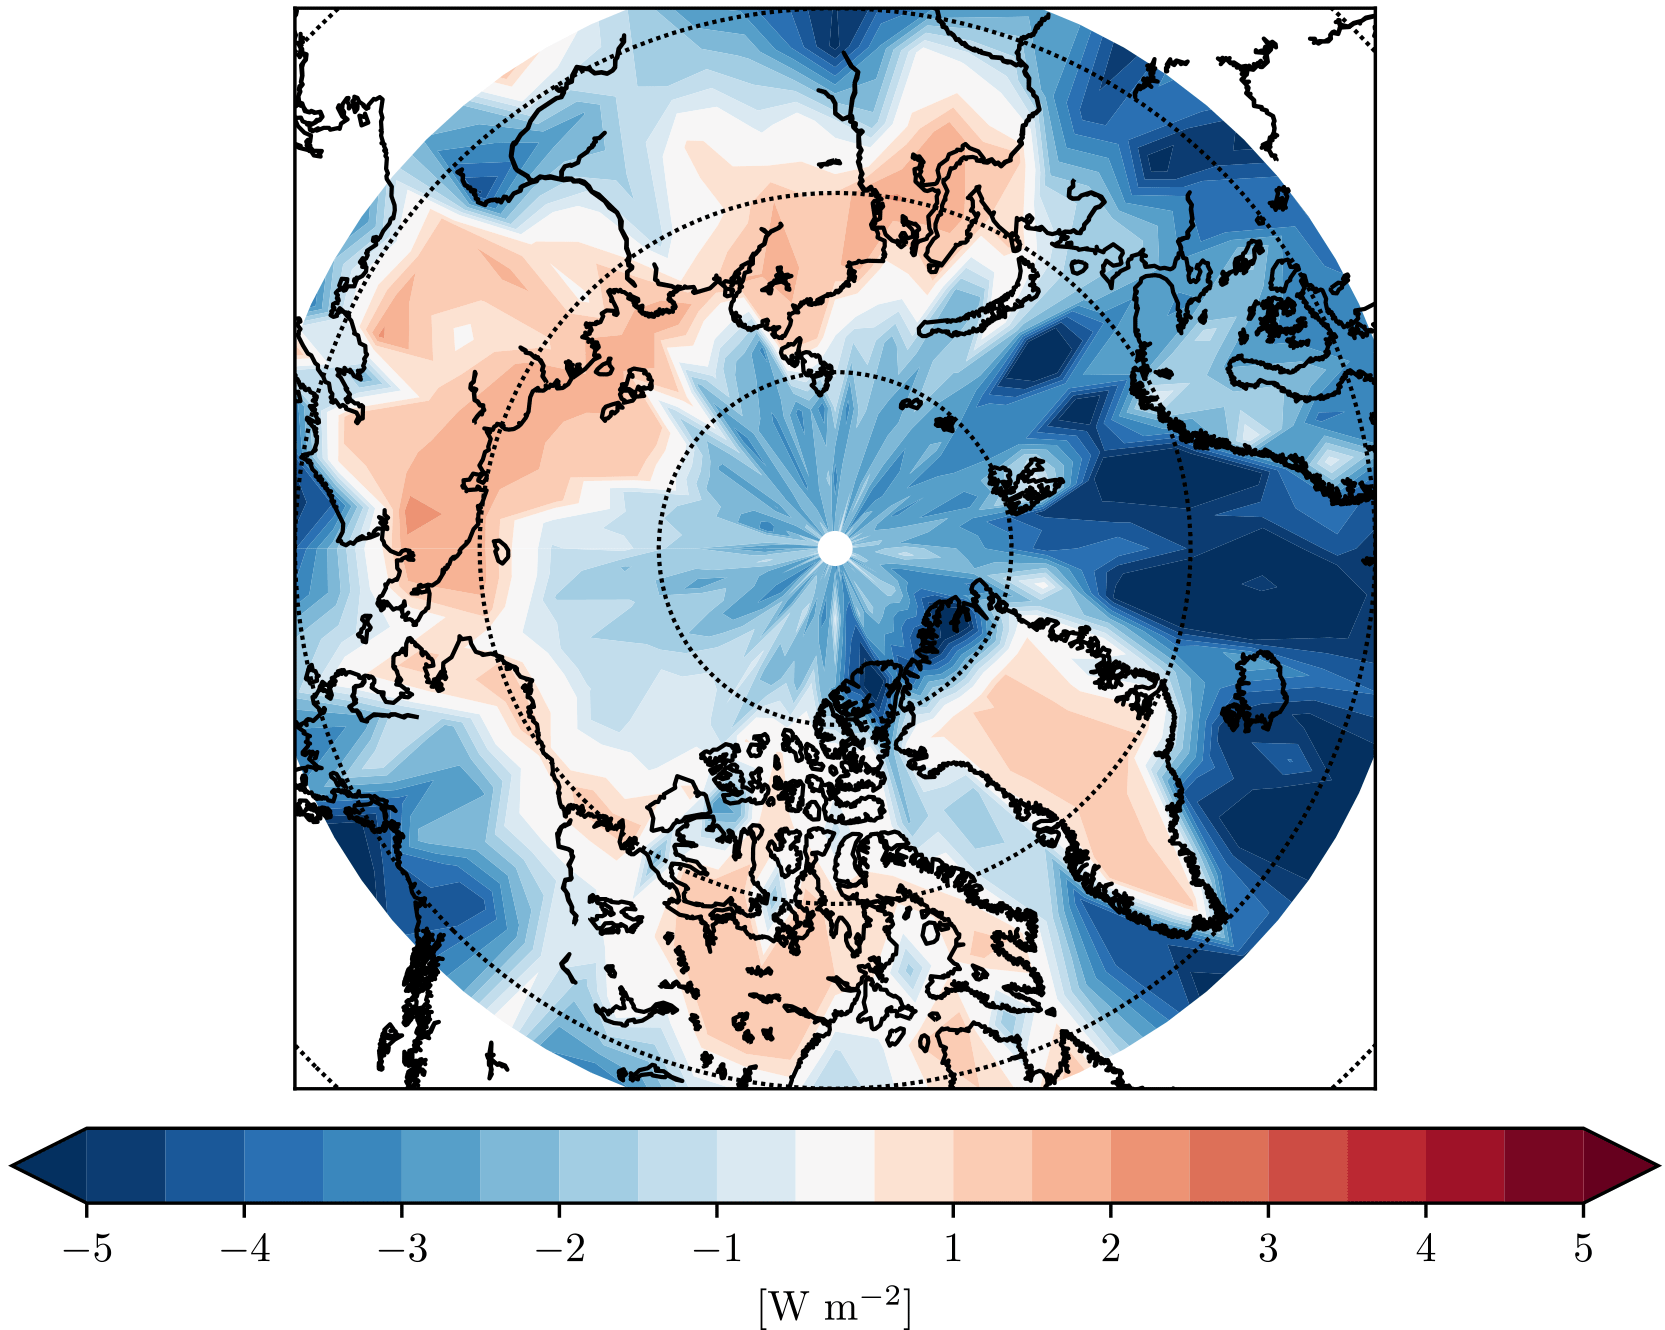
Figure 7The net direct radiative effect over the Arctic in April assuming externally mixed particles.
Table 2 presents the April pan-Arctic mean DRE from all aerosol for the five different mixing-state assumptions. As expected, the DRE calculated with the external mixing-state assumption produces the most negative DRE (−1.65 W m−2), while the allCoreShell assumption produces the most positive DRE (−1.34 W m−2). The external × 1.5 assumption, included as a reference, is close to halfway (−1.52 W m−2) between the two bounding assumptions. The fBC-constrained mixing state is less negative (−1.45 W m−2) than the rshell-constrained mixing state (−1.59 W m−2). This is because constraining by the fraction of BC-containing particles results in smaller BC cores with larger shell thickness in TOMAS (Fig. 6a) that leads to a larger amount of absorption. The range in the pan-Arctic mean DRE using the bounding mixing-state assumptions (external, allCoreShell) is 0.3 W m−2 (or about 20 %). Conversely, using the measurement constraints on BC mixing state (rshell-constrained, fBC-constrained) results in a range of pan-Arctic mean DRE of 0.14 W m−2 (or about 9 %). Thus, using the measurement constraints on BC mixing state reduces the range in DRE from assumptions of BC mixing state by a factor of 2. The remaining range in DRE across the measurement-constrained mixing states arises from the model predicting a different BC to total aerosol mass fraction.

Figure 8The difference in DRE between fBC-constrained (a, b, c) and rshell-constrained (d, e, f) compared to the bounding mixing-state assumptions.
The difference in the DRE between the measurement-constrained mixing states (fBC-constrained and rshell-constrained) and the bounding mixing states (external, external × 1.5, and allCoreShell) is plotted in Fig. 8. Both the measurement-constrained mixing states are more positive than completely externally mixed BC. While less than 15 % of particles contain BC, the fBC-constrained mixing state is 0.19 W m−2 more positive than the external mixing-state assumption (or 58 % of the difference between external and allCoreShell) and 0.05 W m−2 more positive than the external × 1.5 mixing-state assumption (but 0.11 W m−2 more negative than the allCoreShell mixing-state assumption). Conversely, the rshell-constrained mixing state is only 0.06 W m−2 more positive than the external mixing-state assumption (or 20 % of the difference between external and allCoreShell) and 0.07 W m−2 less negative than the external × 1.5 mixing-state assumption (but 0.25 W m−2 more negative than the allCoreShell mixing-state assumption). Regionally the areas with the largest differences between mixing states are those with a slight positive net DRE in Fig. 8 (Greenland, the Canadian high Arctic, and Russia). This further underscores the sensitivity to underlying surface albedo. In these regions, the fBC-constrained DRE is 0.05-0.2 W m−2 more positive than the external × 1.5 mixing-state assumption, while the rshell-constrained mixing state is 0.05–0.2 W m−2 more negative.
Table S2 presents the pan-Arctic mean DRE for the rshell-constrained and fBC-constrained mixing states using the minimum and maximum estimates for coating thickness for rBC core diameters less than 140 nm. In the pan-Arctic mean, the difference in DRE is less than 1 % across the minimum and maximum bounding assumptions. This is likely caused by an overall minor contribution to optical extinction in particle sizes less than 140 nm.
3.4 Study limitations
We acknowledge several limitations in understanding the difference in DRE when using measurement constraints (instrument limitations are discussed in Sect. 2). First, the measurements described here constrain only population mixing state. With regard to particle morphology, we assume a core–shell configuration with BC at the exact center of the particle. Several studies have suggested this may not always be representative of atmospheric aerosol (e.g., Cappa et al., 2012; China et al., 2015). We note that as we assume BC is always at the center of a mixed particle, BC absorption in this work is therefore an upper bound. Second, we assume all BC particles are coated (though sometimes with very thin coats as in the minimum coating assumption; see the Supplement). Some studies show that plumes may have a combination of coated and uncoated BC, with the coated BC fraction increasing with the chemical age of the plume (e.g., Subramanian et al., 2010). Third, we use averages of measurements across flights and altitudes for BC size distribution and coating information. A separate paper, Schulz et al. (2018), will examine the spatial and vertical variability of BC measurements made in this campaign. Fourth, our measurements of BC mixing state only apply to BC particles in a limited size range. The size distributions in Fig. 4 imply a substantial fraction of BC and non-BC number concentration outside the size range of our measurements. We attempt to account for this limitation in our model analysis through consideration of upper and lower bounds on coating and BC-containing particles. Finally, the measurements used here are limited spatially and temporally. Future work may expand on the measurements reported here for other months and a larger spatial domain.
In this study, we present measurements of BC mixing state in the springtime Canadian high Arctic. Using an SP2 aboard the Polar 6 flights, we find that on average for rBC core diameters in the range of 140–220 nm, median coating thickness decreases from 45 to 40 nm (with an interquartile range of 30–70 nm to 17–65 nm). The ratio of total particle to rBC core diameter in this study (1.6–1.4) is comparable to measurements in the springtime Canadian Arctic by Kondo et al. (2011) and Sharma et al. (2017), as well as measurements in the European Arctic from Raatikainen et al. (2015) and Liu et al. (2015). Combining the SP2 size-resolved rBC measurements with total aerosol size distributions from the UHSAS instrument, we estimate approximately 16 % of particles contain rBC in the 175–330 nm diameter range, and 3 % of particles contain rBC in the 550–730 nm diameter range. We use these measurements separately as constraints on the BC mixing state simulated in TOMAS. When constraining TOMAS mass and number concentrations with the shell thickness as a function of rBC core diameter (rshell-constrained), we calculate only 5 % of 200 nm particles contain BC (compared to 16 % from the SP2 and UHSAS observations). Conversely, constraining by the fraction of particles containing rBC (fBC-constrained), we find that the ratio of total particle to core diameter ranges from 2.6–2.7 across the SP2 size range (compared to 1.6–1.4). The reason these constraints do not converge towards the measurements is that GEOS-Chem–TOMAS simulates a lower BC mass concentration and higher non-BC mass concentration than measured by the SP2 and UHSAS, resulting in smaller BC mass to total aerosol mass ratio.
We estimate the Arctic DRE in April 2015 using bounding mixing-state assumptions of entirely externally mixed and internally mixed BC and compare this to the DRE estimate using the measurement-constrained mixing states. The estimated range of the DRE using the measurement-constrained mixing states (−1.45 to −1.59 W m−2) is approximately a factor of 2 less than the estimated range when using the bounding mixing-state assumptions (−1.34 to −1.65 W m−2). We find that the fBC-constrained mixing state is 0.19 W m−2 less negative than the completely external mixing-state assumption (and 0.11 W m−2 more negative than the completely internal assumption), while the rshell-constrained mixing state is 0.06 W m−2 less negative than the completely external mixing-state assumption (and 0.25 W m−2 more negative than the completely internal assumption). As the BC mass fraction in TOMAS is lower than observed, constraining by the fraction of BC-containing particles results in smaller BC cores with larger shell thickness. If the BC mass fraction in TOMAS matches the observations, both mixing-state parameters (shell thickness and fraction of BC-containing particles) can be constrained simultaneously and the DRE in both cases would be identical. Over regions of bright underlying surface albedo the differences can be greater than 0.4 W m−2. The difference in the calculated DRE between rshell-constrained and fBC-constrained highlights the importance of accurately simulating all aerosol components in order to represent the chemical mixing state.
NETCARE (Network on Climate and Aerosols, 2015, http://www.netcare-project.ca, last access: 1 August 2018), which organized the aircraft flight described in this paper, is moving towards a publicly available, online data archive. In the meantime, the data can be accessed by contacting the principal investigator of the network: Jon Abbatt at the University of Toronto (jabbatt@chem.utoronto.ca). In addition, the measurements of coating thickness and fraction of particles containing rBC are included as Supplement CSV files to this paper.
The supplement related to this article is available online at: https://doi.org/10.5194/acp-18-11345-2018-supplement.
Aircraft measurements from the Polar 6 campaign as part of NETCARE were planned and carried out by SH, AB, WRL, HS, AH, MZ, JB, MW, and JA. The NETCARE project is supervised by JA. SH led the analysis of measurements of black carbon mixing state with input from AB and WRL. JP, WRL, and JK designed the use of SP2 and UHSAS measurements to constrain simulated mixing state. Model simulations and subsequent analysis was led by JK with input from JP. JK prepared the paper along with contributions from SH on the methodology of aircraft BC measurements and input from all coauthors.
The authors declare that they have no conflict of interest.
This article is part of the special issue “NETCARE (Network on Aerosols and Climate: Addressing Key Uncertainties in Remote Canadian Environments) (ACP/AMT/BG inter-journal SI)”. It is not associated with a conference.
The authors acknowledge the financial support provided for NETCARE through
the Climate Change and Atmospheric Research Program at NSERC Canada, as well
as support from Environment and Climate Change Canada and the Alfred Wegener
Institute. This research has also been supported by a grant from the US
Environmental Protection Agency's Science to Achieve Results (STAR) program
through grant no. 83543801 and the US National Oceanic and Atmospheric
Administration, an Office of Science, Office of Atmospheric Chemistry, Carbon
Cycle, and Climate Program, under the cooperative agreement award
NA17OAR430001. We also gratefully acknowledge support from SFB/TR 172 ArctiC Amplification:
Climate Relevant Atmospheric and SurfaCe Processes, and Feedback Mechanisms (AC)3 in
subproject C02 funded by the DFG (Deutsche Forschungsgesellschaft).
Finally, this material is based upon work supported by the
National Science Foundation under grant no. AGS-1559607.
Edited by: Lynn M. Russell
Reviewed by: three
anonymous referees
Adams, P. J. and Seinfeld, J. H.: Predicting global aerosol size distributions in general circulation models, J. Geophys. Res., 107, 4370, https://doi.org/10.1029/2001JD001010, 2002.
AMAP: AMAP Assessment 2015: Black Carbon and Ozone as Arctic Climate Forcers, Arctic Monitoring and Assessment Programme (AMAP), Oslo, Norway, 2015.
Bohren, C. F. and Huffman, D. R.: Absorption and scattering of light by small particles, Wiley Interscience, New York, USA, 1983.
Bond, T. C. and Bergstrom, R. W.: Light Absorption by Carbonaceous Particles: An Investigative Review, Aerosol Sci. Technol., 40, 27–67, https://doi.org/10.1080/02786820500421521, 2006.
Bond, T. C., Habib, G., and Bergstrom, R. W.: Limitations in the enhancement of visible light absorption due to mixing state, J. Geophys. Res., 111, D20211, https://doi.org/10.1029/2006JD007315, 2006.
Bond, T. C., Doherty, S. J., Fahey, D. W., Forster, P. M., Berntsen, T., DeAngelo, B. J., Flanner, M. G., Ghan, S., Kärcher, B., Koch, D., Kinne, S., Kondo, Y., Quinn, P. K., Sarofim, M. C., Schultz, M. G., Schulz, M., Venkataraman, C., Zhang, H., Zhang, S., Bellouin, N., Guttikunda, S. K., Hopke, P. K., Jacobson, M. Z., Kaiser, J. W., Klimont, Z., Lohmann, U., Schwarz, J. P., Shindell, D., Storelvmo, T., Warren, S. G., and Zender, C. S.: Bounding the role of black carbon in the climate system: A scientific assessment, J. Geophys. Res.-Atmos., 118, 5380–5552, https://doi.org/10.1002/jgrd.50171, 2013.
Boucher, O., Randall, D., Artaxo, P., Bretherton, C., Feingold, G., Forster, P., Kerminen, V.-M., Kondo, Y., Liao, H., Lohmann, U., Rasch, P., Satheesh, S. K., Sherwood, S., Stevens, B., and Zhang, X. Y.: Clouds and Aerosols, in: Climate Change 2013: The Physical Science Basis, Contribution of Working Group I to the Fifth Assessment Report of the Intergovernmental Panel on Climate Change, edited by: Stocker, T. F., Qin, D., Plattner, G.-K., Tignor, M., Allen, S. K., Boschung, J., Nauels, A., Xia, Y., Bex, V., and Midgley, P. M., Cambridge University Press, Cambridge, United Kingdom and New York, NY, USA, 2013.
Brock, C. A., Cozic, J., Bahreini, R., Froyd, K. D., Middlebrook, A. M., McComiskey, A., Brioude, J., Cooper, O. R., Stohl, A., Aikin, K. C., de Gouw, J. A., Fahey, D. W., Ferrare, R. A., Gao, R.-S., Gore, W., Holloway, J. S., Hübler, G., Jefferson, A., Lack, D. A., Lance, S., Moore, R. H., Murphy, D. M., Nenes, A., Novelli, P. C., Nowak, J. B., Ogren, J. A., Peischl, J., Pierce, R. B., Pilewskie, P., Quinn, P. K., Ryerson, T. B., Schmidt, K. S., Schwarz, J. P., Sodemann, H., Spackman, J. R., Stark, H., Thomson, D. S., Thornberry, T., Veres, P., Watts, L. A., Warneke, C., and Wollny, A. G.: Characteristics, sources, and transport of aerosols measured in spring 2008 during the aerosol, radiation, and cloud processes affecting Arctic Climate (ARCPAC) Project, Atmos. Chem. Phys., 11, 2423–2453, https://doi.org/10.5194/acp-11-2423-2011, 2011
Browse, J., Carslaw, K. S., Arnold, S. R., Pringle, K., and Boucher, O.: The scavenging processes controlling the seasonal cycle in Arctic sulphate and black carbon aerosol, Atmos. Chem. Phys., 12, 6775–6798, https://doi.org/10.5194/acp-12-6775-2012, 2012.
Burkart, J., Willis, M. D., Bozem, H., Thomas, J. L., Law, K., Hoor, P., Aliabadi, A. A., Köllner, F., Schneider, J., Herber, A., Abbatt, J. P. D., and Leaitch, W. R.: Summertime observations of elevated levels of ultrafine particles in the high Arctic marine boundary layer, Atmos. Chem. Phys., 17, 5515–5535, https://doi.org/10.5194/acp-17-5515-2017, 2017
Cappa, C. D., Onasch, T. B., Massoli, P., Worsnop, D. R., Bates, T. S., Cross, E. S., Davidovits, P., Hakala, J., Hayden, K. L., Jobson, B. T., Kolesar, K. R., Lack, D. A., Lerner, B. M., Li, S.-M., Mellon, D., Nuaaman, I., Olfert, J. S., Petäjä, T., Quinn, P. K., Song, C., Subramanian, R., Williams, E. J., and Zaveri, R. a: Radiative absorption enhancements due to the mixing state of atmospheric black carbon, Science, 337, 1078–1081, https://doi.org/10.1126/science.1223447, 2012.
China, S., Scarnato, B., Owen, R. C., Zhang, B., Ampadu, M. T., Kumar, S., Dzepina, K., Dziobak, M. P., Fialho, P., Perlinger, J. A., Hueber, J., Helmig, D., Mazzoleni, L. R., and Mazzoleni, C.: Morphology and mixing state of aged soot particles at a remote marine free troposphere site: Implications for optical properties, Geophys. Res. Lett., 42, 1243–1250, https://doi.org/10.1002/2014GL062404, 2015.
Croft, B., Martin, R. V., Leaitch, W. R., Tunved, P., Breider, T. J., D'Andrea, S. D., and Pierce, J. R.: Processes controlling the annual cycle of Arctic aerosol number and size distributions, Atmos. Chem. Phys., 16, 3665–3682, https://doi.org/10.5194/acp-16-3665-2016, 2016a.
Croft, B., Wentworth, G. R., Martin, R. V, Leaitch, W. R., Murphy, J. G., Murphy, B. N., Kodros, J. K., Abbatt, J. P. D., and Pierce, J. R.: Contribution of Arctic seabird-colony ammonia to atmospheric particles and cloud-albedo radiative effect, Nat. Commun., 7, 13444, https://doi.org/10.1038/ncomms13444, 2016b.
Gao, R. S., Schwarz, J. P., Kelly, K. K., Fahey, D. W., Watts, L. A., Thompson, T. L., Spackman, J. R., Slowik, J. G., Cross, E. S., Han, J.-H., Davidovits, P., Onasch, T. B., and Worsnop, D. R.: A Novel Method for Estimating Light-Scattering Properties of Soot Aerosols Using a Modified Single-Particle Soot Photometer, Aerosol Sci. Technol., 41, 125–135, https://doi.org/10.1080/02786820601118398, 2007.
Garrett, T. J., Brattström, S., Sharma, S., Worthy, D. E. J., and Novelli, P.: The role of scavenging in the seasonal transport of black carbon and sulfate to the Arctic, Geophys. Res. Lett., 38, L16805, https://doi.org/10.1029/2011GL048221, 2011.
Gysel, M., Laborde, M., Olfert, J. S., Subramanian, R., and Gröhn, A. J.: Effective density of Aquadag and fullerene soot black carbon reference materials used for SP2 calibration, Atmos. Meas. Tech., 4, 2851–2858, https://doi.org/10.5194/amt-4-2851-2011, 2011.
He, C., Liou, K.-N., Takano, Y., Zhang, R., Levy Zamora, M., Yang, P., Li, Q., and Leung, L. R.: Variation of the radiative properties during black carbon aging: theoretical and experimental intercomparison, Atmos. Chem. Phys., 15, 11967–11980, https://doi.org/10.5194/acp-15-11967-2015, 2015.
He, C., Takano, Y., Liou, K.-N., Yang, P., Li, Q., and Mackowski, D. W.: Intercomparison of the GOS approach, superposition T-matrix method, and laboratory measurements for black carbon optical properties during aging, J. Quant. Spectrosc. Ra., 184, 287–296, https://doi.org/10.1016/j.jqsrt.2016.08.004, 2016.
Heald, C. L., Ridley, D. A., Kroll, J. H., Barrett, S. R. H., Cady-Pereira, K. E., Alvarado, M. J., and Holmes, C. D.: Contrasting the direct radiative effect and direct radiative forcing of aerosols, Atmos. Chem. Phys., 14, 5513–5527, https://doi.org/10.5194/acp-14-5513-2014, 2014.
Herber, A., Dethloff, K., Haas, C., Steinhage, D., Strapp, J. W., Bottenheim, J., McElroy, T., and Yamanouchi, T.: Polar 5 – A new research aircraft for improved access to the Arctic, ISAR-1, Drastic Change under Global Warming, Extended Abstract, 54–57, 2008.
Herber, A., Haas, C., Bottenheim, J., Liu, P., Shao-Meng, L., Staebler, R., Strapp, J. W., and Dethloff, K.: Regular Airborne Surveys of Arctic Sea Ice and Atmosphere, Eos, 93, 41–48, https://doi.org/10.1029/2010gl042652, 2012.
Iacono, M. J., Delamere, J. S., Mlawer, E. J., Shephard, M. W., Clough, S. A., and Collins, W. D.: Radiative forcing by long-lived greenhouse gases: Calculations with the AER radiative transfer models, J. Geophys. Res., 113, D13103, https://doi.org/10.1029/2008JD009944, 2008.
Jaeglé, L., Quinn, P. K., Bates, T. S., Alexander, B., and Lin, J.-T.: Global distribution of sea salt aerosols: new constraints from in situ and remote sensing observations, Atmos. Chem. Phys., 11, 3137–3157, https://doi.org/10.5194/acp-11-3137-2011, 2011.
Janssens-Maenhout, G., Crippa, M., Guizzardi, D., Dentener, F., Muntean, M., Pouliot, G., Keating, T., Zhang, Q., Kurokawa, J., Wankmüller, R., Denier van der Gon, H., Kuenen, J. J. P., Klimont, Z., Frost, G., Darras, S., Koffi, B., and Li, M.: HTAP_v2.2: a mosaic of regional and global emission grid maps for 2008 and 2010 to study hemispheric transport of air pollution, Atmos. Chem. Phys., 15, 11411–11432, https://doi.org/10.5194/acp-15-11411-2015, 2015.
Klimont, Z., Kupiainen, K., Heyes, C., Purohit, P., Cofala, J., Rafaj, P., Borken-Kleefeld, J., and Schöpp, W.: Global anthropogenic emissions of particulate matter including black carbon, Atmos. Chem. Phys., 17, 8681–8723, https://doi.org/10.5194/acp-17-8681-2017, 2017.
Kondo, Y., Matsui, H., Moteki, N., Sahu, L., Takegawa, N., Kajino, M., Zhao, Y., Cubison, M. J., Jimenez, J. L., Vay, S., Diskin, G. S., Anderson, B., Wisthaler, A., Mikoviny, T., Fuelberg, H. E., Blake, D. R., Huey, G., Weinheimer, A. J., Knapp, D. J., and Brune, W. H.: Emissions of black carbon, organic, and inorganic aerosols from biomass burning in North America and Asia in 2008, J. Geophys. Res., 116, D08204, https://doi.org/10.1029/2010JD015152, 2011.
Kupc, A., Williamson, C., Wagner, N. L., Richardson, M., and Brock, C. A.: Modification, calibration, and performance of the Ultra-High Sensitivity Aerosol Spectrometer for particle size distribution and volatility measurements during the Atmospheric Tomography Mission (ATom) airborne campaign, Atmos. Meas. Tech., 11, 369–383, https://doi.org/10.5194/amt-11-369-2018, 2018.
Laborde, M., Mertes, P., Zieger, P., Dommen, J., Baltensperger, U., and Gysel, M.: Sensitivity of the Single Particle Soot Photometer to different black carbon types, Atmos. Meas. Tech., 5, 1031–1043, https://doi.org/10.5194/amt-5-1031-2012, 2012.
Laborde, M., Crippa, M., Tritscher, T., Jurányi, Z., Decarlo, P. F., Temime-Roussel, B., Marchand, N., Eckhardt, S., Stohl, A., Baltensperger, U., Prévôt, A. S. H., Weingartner, E., and Gysel, M.: Black carbon physical properties and mixing state in the European megacity Paris, Atmos. Chem. Phys., 13, 5831–5856, https://doi.org/10.5194/acp-13-5831-2013, 2013.
Lack, D. A. and Cappa, C. D.: Impact of brown and clear carbon on light absorption enhancement, single scatter albedo and absorption wavelength dependence of black carbon, Atmos. Chem. Phys., 10, 4207–4220, https://doi.org/10.5194/acp-10-4207-2010, 2010.
Leaitch, W. R., Sharma, S., Huang, L., Toom-Sauntry, D., Chivulescu, A., Macdonald, A. M., von Salzen, K., Pierce, J. R., Bertram, A. K., Schroder, J. C., Shantz, N. C., Chang, R. Y.-W., and Norman, A.-L.: Dimethyl sulfide control of the clean summertime Arctic aerosol and cloud, Elem. Sci. Anthr., 1, 000017, https://doi.org/10.12952/journal.elementa.000017, 2013.
Leaitch, W. R., Korolev, A., Aliabadi, A. A., Burkart, J., Willis, M. D., Abbatt, J. P. D., Bozem, H., Hoor, P., Köllner, F., Schneider, J., Herber, A., Konrad, C., and Brauner, R.: Effects of 20–100 nm particles on liquid clouds in the clean summertime Arctic, Atmos. Chem. Phys., 16, 11107–11124, https://doi.org/10.5194/acp-16-11107-2016, 2016.
Leaitch, W. R., Russell, L. M., Liu, J., Kolonjari, F., Toom, D., Huang, L., Sharma, S., Chivulescu, A., Veber, D., and Zhang, W.: Organic functional groups in the submicron aerosol at 82.5∘ N, 62.5∘ W from 2012 to 2014, Atmos. Chem. Phys., 18, 3269–3287, https://doi.org/10.5194/acp-18-3269-2018, 2018.
Lee, Y. H. and Adams, P. J.: A Fast and Efficient Version of the TwO-Moment Aerosol Sectional (TOMAS) Global Aerosol Microphysics Model, Aerosol Sci. Technol., 46, 678–689, https://doi.org/10.1080/02786826.2011.643259, 2012.
Lee, Y. H., Pierce, J. R., and Adams, P. J.: Representation of nucleation mode microphysics in a global aerosol model with sectional microphysics, Geosci. Model Dev., 6, 1221–1232, https://doi.org/10.5194/gmd-6-1221-2013, 2013.
Liu, D., Quennehen, B., Darbyshire, E., Allan, J. D., Williams, P. I., Taylor, J. W., Bauguitte, S. J.-B., Flynn, M. J., Lowe, D., Gallagher, M. W., Bower, K. N., Choularton, T. W., and Coe, H.: The importance of Asia as a source of black carbon to the European Arctic during springtime 2013, Atmos. Chem. Phys., 15, 11537–11555, https://doi.org/10.5194/acp-15-11537-2015, 2015.
Massoli, P., Onasch, T. B., Cappa, C. D., Nuamaan, I., Hakala, J., Hayden, K., Li, S.-M., Sueper, D. T., Bates, T. S., Quinn, P. K., Jayne, J. T., and Worsnop, D. R.: Characterization of black carbon-containing particles from soot particle aerosol mass spectrometer measurements on the R/V Atlantis during CalNex 2010, J. Geophys. Res.-Atmos., 120, 2575–2593, https://doi.org/10.1002/2014JD022834, 2015.
McMeeking, G. R., Morgan, W. T., Flynn, M., Highwood, E. J., Turnbull, K., Haywood, J., and Coe, H.: Black carbon aerosol mixing state, organic aerosols and aerosol optical properties over the United Kingdom, Atmos. Chem. Phys., 11, 9037–9052, https://doi.org/10.5194/acp-11-9037-2011, 2011.
Moteki, N. and Kondo, Y.: Effects of Mixing State on Black Carbon Measurements by Laser-Induced Incandescence, Aerosol Sci. Technol., 41, 398–417, https://doi.org/10.1080/02786820701199728, 2007.
Moteki, N., Kondo, Y., and Nakamura, S.: Method to measure refractive indices of small nonspherical particles: Application to black carbon particles, J. Aerosol Sci., 41, 513–521, https://doi.org/10.1016/j.jaerosci.2010.02.013, 2010.
NETCARE (Network on Climate and Aerosols): Addressing Key Uncertainties in Remote Canadian Environments, available at: http://www.netcare-project.ca (last access: 1 August 2018), 2015.
Petzold, A., Ogren, J. A., Fiebig, M., Laj, P., Li, S.-M., Baltensperger, U., Holzer-Popp, T., Kinne, S., Pappalardo, G., Sugimoto, N., Wehrli, C., Wiedensohler, A., and Zhang, X.-Y.: Recommendations for reporting “black carbon”; measurements, Atmos. Chem. Phys., 13, 8365–8379, https://doi.org/10.5194/acp-13-8365-2013, 2013.
Pincus, R., Barker, H. W., and Morcrette, J.-J.: A fast, flexible, approximate technique for computing radiative transfer in inhomogeneous cloud fields, J. Geophys. Res.-Atmos., 108, 4376, https://doi.org/10.1029/2002JD003322, 2003.
Qi, L., Li, Q., Henze, D. K., Tseng, H.-L., and He, C.: Sources of springtime surface black carbon in the Arctic: an adjoint analysis for April 2008, Atmos. Chem. Phys., 17, 9697–9716, https://doi.org/10.5194/acp-17-9697-2017, 2017a.
Qi, L., Li, Q., Li, Y., and He, C.: Factors controlling black carbon distribution in the Arctic, Atmos. Chem. Phys., 17, 1037–1059, https://doi.org/10.5194/acp-17-1037-2017, 2017b.
Qi, L., Li, Q., He, C., Wang, X., and Huang, J.: Effects of the Wegener–Bergeron–Findeisen process on global black carbon distribution, Atmos. Chem. Phys., 17, 7459–7479, https://doi.org/10.5194/acp-17-7459-2017, 2017c.
Quinn, P. K., Shaw, G., Andrews, E., Dutton, E. G., Ruoho-Airola, T., and Gong, S. L.: Arctic haze: current trends and knowledge gaps, Tellus B, 59, 99–114, 2007.
Raatikainen, T., Brus, D., Hyvärinen, A.-P., Svensson, J., Asmi, E. and Lihavainen, H.: Black carbon concentrations and mixing state in the Finnish Arctic, Atmos. Chem. Phys., 15, 10057–10070, https://doi.org/10.5194/acp-15-10057-2015, 2015.
Schnaiter, M., Horvath, H., Möhler, O., Naumann, K. H., Saathoff, H., and Schöck, O. W.: UV-VIS-NIR spectral optical properties of soot and soot-containing aerosols, J. Aerosol Sci., 34, 1421–1444, https://doi.org/10.1016/S0021-8502(03)00361-6, 2003.
Schnaiter, M., Linke, C., Möhler, O., Naumann, K. H., Saathoff, H., Wagner, R., Schurath, U., and Wehner, B.: Absorption amplification of black carbon internally mixed with secondary organic aerosol, J. Geophys. Res.-Atmos., 110, 1–11, https://doi.org/10.1029/2005JD006046, 2005.
Schulz, H., Bozem, H., Zanatta, M., Leaitch, W. R., Herber, A. B., Burkart, J., Willis, M. D., Hoor, P. M., Abbatt, J. P. D., and Gerdes, R.: High-Arctic aircraft measurements characterising black carbon vertical variability in spring and summer, Atmos. Chem. Phys. Discuss., https://doi.org/10.5194/acp-2018-587, in review, 2018.
Schwarz, J. P., Gao, R. S., Spackman, J. R., Watts, L. A., Thomson, D. S., Fahey, D. W., Ryerson, T. B., Peischl, J., Holloway, J. S., Trainer, M., Frost, G. J., Baynard, T., Lack, D. A., de Gouw, J. A., Warneke, C., and Del Negro, L. A.: Measurement of the mixing state, mass, and optical size of individual black carbon particles in urban and biomass burning emissions, Geophys. Res. Lett., 35, L13810, https://doi.org/10.1029/2008GL033968, 2008a.
Schwarz, J. P., Spackman, J. R., Fahey, D. W., Gao, R. S., Lohmann, U., Stier, P., Watts, L. A., Thomson, D. S., Lack, D. A., Pfister, L., Mahoney, M. J., Baumgardner, D., Wilson, J. C., and Reeves, J. M.: Coatings and their enhancement of black carbon light absorption in the tropical atmosphere, J. Geophys. Res., 113, D03203, https://doi.org/10.1029/2007JD009042, 2008b.
Seinfeld, J. H. and Pandis, S. N.: Atmospheric chemistry and physics: from air pollution to climate change, John Wiley & Sons, 2012.
Sharma, S., Leaitch, W. R., Huang, L., Veber, D., Kolonjari, F., Zhang, W., Hanna, S. J., Bertram, A. K., and Ogren, J. A.: An evaluation of three methods for measuring black carbon in Alert, Canada, Atmos. Chem. Phys., 17, 15225–15243, https://doi.org/10.5194/acp-17-15225-2017, 2017.
Slowik, J. G., Cross, E. S., Han, J.-H., Davidovits, P., Onasch, T. B., Jayne, J. T., Williams, L. R., Canagaratna, M. R., Worsnop, D. R., Chakrabarty, R. K., Moosmüller, H., Arnott, W. P., Schwarz, J. P., Gao, R.-S., Fahey, D. W., Kok, G. L., and Petzold, A.: An Inter-Comparison of Instruments Measuring Black Carbon Content of Soot Particles, Aerosol Sci. Technol., 41, 295–314, https://doi.org/10.1080/02786820701197078, 2007.
Subramanian, R., Kok, G. L., Baumgardner, D., Clarke, A., Shinozuka, Y., Campos, T. L., Heizer, C. G., Stephens, B. B., de Foy, B., Voss, P. B., and Zaveri, R. A.: Black carbon over Mexico: the effect of atmospheric transport on mixing state, mass absorption cross-section, and BC ∕ CO ratios, Atmos. Chem. Phys., 10, 219–237, https://doi.org/10.5194/acp-10-219-2010, 2010.
Taylor, J. W., Allan, J. D., Allen, G., Coe, H., Williams, P. I., Flynn, M. J., Le Breton, M., Muller, J. B. A., Percival, C. J., Oram, D., Forster, G., Lee, J. D., Rickard, A. R., Parrington, M., and Palmer, P. I.: Size-dependent wet removal of black carbon in Canadian biomass burning plumes, Atmos. Chem. Phys., 14, 13755–13771, https://doi.org/10.5194/acp-14-13755-2014, 2014.
Taylor, J. W., Allan, J. D., Liu, D., Flynn, M., Weber, R., Zhang, X., Lefer, B. L., Grossberg, N., Flynn, J., and Coe, H.: Assessment of the sensitivity of core/shell parameters derived using the single-particle soot photometer to density and refractive index, Atmos. Meas. Tech., 8, 1701–1718, https://doi.org/10.5194/amt-8-1701-2015, 2015.
Tunved, P., Ström, J., and Krejci, R.: Arctic aerosol life cycle: linking aerosol size distributions observed between 2000 and 2010 with air mass transport and precipitation at Zeppelin station, Ny-A∘ lesund, Svalbard, Atmos. Chem. Phys., 13, 3643–3660, https://doi.org/10.5194/acp-13-3643-2013, 2013.
Wang, Q., Huang, R.-J., Cao, J., Han, Y., Wang, G., Li, G., Wang, Y., Dai, W., Zhang, R., and Zhou, Y.: Mixing State of Black Carbon Aerosol in a Heavily Polluted Urban Area of China: Implications for Light Absorption Enhancement, Aerosol Sci. Technol., 48, 689–697, https://doi.org/10.1080/02786826.2014.917758, 2014.
Wentworth, G. R., Murphy, J. G., Croft, B., Martin, R. V., Pierce, J. R., Côté, J.-S., Courchesne, I., Tremblay, J.-É., Gagnon, J., Thomas, J. L., Sharma, S., Toom-Sauntry, D., Chivulescu, A., Levasseur, M., and Abbatt, J. P. D.: Ammonia in the summertime Arctic marine boundary layer: sources, sinks, and implications, Atmos. Chem. Phys., 16, 1937–1953, https://doi.org/10.5194/acp-16-1937-2016, 2016.
Wiedinmyer, C., Akagi, S. K., Yokelson, R. J., Emmons, L. K., Al-Saadi, J. A., Orlando, J. J., and Soja, A. J.: The Fire INventory from NCAR (FINN): a high resolution global model to estimate the emissions from open burning, Geosci. Model Dev., 4, 625–641, https://doi.org/10.5194/gmd-4-625-2011, 2011.
Willis, M. D., Burkart, J., Thomas, J. L., Köllner, F., Schneider, J., Bozem, H., Hoor, P. M., Aliabadi, A. A., Schulz, H., Herber, A. B., Leaitch, W. R., and Abbatt, J. P. D.: Growth of nucleation mode particles in the summertime Arctic: a case study, Atmos. Chem. Phys., 16, 7663–7679, https://doi.org10.5194/acp-16-7663-2016, 2016.
Xu, J.-W., Martin, R. V., Morrow, A., Sharma, S., Huang, L., Leaitch, W. R., Burkart, J., Schulz, H., Zanatta, M., Willis, M. D., Henze, D. K., Lee, C. J., Herber, A. B., and Abbatt, J. P. D.: Source attribution of Arctic black carbon constrained by aircraft and surface measurements, Atmos. Chem. Phys., 17, 11971–11989, https://doi.org/10.5194/acp-17-11971-2017, 2017.
Zender, C. S.: Mineral Dust Entrainment and Deposition (DEAD) model: Description and 1990s dust climatology, J. Geophys. Res., 108, 4416, https://doi.org/10.1029/2002JD002775, 2003.
Zhang, R., Khalizov, A. F., Pagels, J., Zhang, D., Xue, H., and McMurry, P. H.: Variability in morphology, hygroscopicity, and optical properties of soot aerosols during atmospheric processing, P. Natl. Acad. Sci. USA, 105, 10291–10296, https://doi.org/10.1073/pnas.0804860105, 2008.