the Creative Commons Attribution 4.0 License.
the Creative Commons Attribution 4.0 License.
 | 10 Aug 2018
On the role of aerosols, humidity, and vertical wind shear in the transition of shallow-to-deep convection at the Green Ocean Amazon 2014/5 site
Sudip Chakraborty
Kathleen A. Schiro
Rong Fu
J. David Neelin
The preconditioning of the atmosphere for a shallow-to-deep convective transition during the dry-to-wet season transition period (August–November) is investigated using Department of Energy (DOE) Atmospheric Radiation Measurement (ARM) GoAmazon2014/5 campaign data from March 2014 to November 2015 in Manacapuru, Brazil. In comparison to conditions observed prior to shallow convection, anomalously high humidity in the free troposphere and boundary layer is observed prior to a shallow-to-deep convection transition. An entraining plume model, which captures this leading dependence on lower tropospheric moisture, is employed to study indirect thermodynamic effects associated with vertical wind shear (VWS) and cloud condensation nuclei (CCN) concentration on preconvective conditions. The shallow-to-deep convective transition primarily depends on humidity, especially that from the free troposphere, which tends to increase plume buoyancy. Conditions preceding deep convection are associated with high relative humidity, and low-to-moderate CCN concentration (less than the 67th percentile, 1274 cm−3). VWS, however, shows little relation to moisture and plume buoyancy. Buoyancy estimates suggest that the latent heat release due to freezing is important to deep convective growth under all conditions analyzed, consistent with potential pathways for aerosol effects, even in the presence of a strong entrainment. Shallow-only convective growth, however, shows an association with a strong (weak) low (deep) level VWS and with higher CCN concentration.
- Article
(11510 KB) -
Supplement
(309 KB) - BibTeX
- EndNote


Deep convection is the primary source of global precipitation over the tropics and midlatitudes (Houze, 2004) and has a large influence on extreme rainfall events like floods and droughts (Houze et al., 2015). Deep convection is also associated with strong latent heat profiles of the atmosphere (Yin et al., 2014; Schumacher et al., 2004). Investigating the meteorological parameters and suitable environmental conditions favoring the formation and evolution of deep convection is thus of interest to more accurately predict rainfall in climate models.
Climate models often exhibit large uncertainties in rainfall variability and projection over the Amazon (Vera et al., 2006; Li et al., 2006), due in large part to the poor parameterization and an inability to simulate the formation of deep convective clouds and their evolution. Shallow and congestus convection transports moisture from the atmospheric boundary layer (BL) to the lower and middle troposphere, thus allowing for the development of deep convection (Zhuang et al., 2017; Del Genio and Wu, 2010; Jensen and Del Genio, 2006). However, many previous studies illustrate difficulties in representing the shallow-to-deep evolution in models (Del Genio and Wu, 2010; Waite and Khouider, 2010). Direct connections between the shallow-to-deep convection evolution and the ambient environment as well as land surface are neither fully understood nor adequately represented in climate models. There are a number of factors that can potentially dictate whether shallow convection will develop into deep, precipitating convection, such as free tropospheric moisture, vertical wind shear, cold pool formation, cloud–aerosol interactions, and the diurnal cycle.
Many studies have investigated the role of total precipitable water and moisture content of the BL on the strength and evolution of deep convections both over tropical land and ocean sites (Schiro et al., 2016; Holloway and Neelin, 2009). In addition, there are ample studies that show that free tropospheric moistening is important for deep convective evolution (Waite and Khouider, 2010; Zhang and Klein, 2010; Kumar et al., 2013; Sherwood et al., 2004). Additionally, vertical wind shear (VWS) is known to influence deep convective clouds by influencing the slantwise ascent of the moisture (Moncrieff, 1978), separating the updraft and downdraft regions. In a recent study, it was shown that deep tropospheric VWS (DVWS) has a significant impact on the lifetime of mesoscale convective systems (Chakraborty et al., 2016) and can regulate the anvil's formation (Koren et al., 2010; Weisman and Rotunno, 2004; Petersen et al., 2006; Kilroy et al., 2014; Harrison, 1992) as well as the updraft speed of the parcels (Weisman and Rotunno, 2004). However, low-level VWS (LVWS) can influence the rainfall and total condensation within developing convection (Weisman and Rotunno, 2004). However, it is still not clear how deep or lower tropospheric VWS affects updraft buoyancy. In addition, aerosols can delay the formation of precipitation size hydrometeors, invigorating strong convection, while suppressing shallower and weaker convection (Rosenfeld et al., 2008; Koren et al., 2008; Lin et al., 2006; Andreae et al., 2004). Low-to-moderate aerosols enhance convective strength and such an influence depends on humidity (Chakraborty et al., 2016). Furthermore, satellite data analyses have suggested that during the dry-to-wet transition season over the Amazon, biomass burning aerosols can increase warm clouds through their indirect effect under higher relative humidity (RH) and moderate aerosol loading, whereas under lower RH and heavy aerosol loading conditions, biomass burning aerosols tend to decrease clouds (e.g., Yu et al., 2006). Thus, it is suggested that relatively small changes in the BL and in the free troposphere, due to changes of humidity, wind profile, and aerosols, can trigger or suppress deep convection. However, we lack a clear understanding of the influence of these parameters on the deep convective evolution from shallow convection, primarily due to observational constraints.
A few recent studies have investigated deep convective evolution and buoyancy using ground-based measurements over the Amazonia (Zhuang et al., 2017; Schiro et al., 2016). Schiro et al. (2016) found that given sufficient mixing in the lower troposphere, column water vapor can be used as a proxy to understand the impact of free tropospheric humidity on plume buoyancy related to deep convective evolution. Sensitivity of buoyancy to other factors in the Amazon was also suggested, such as BL and microphysical processes, but the role of aerosols or VWS on deep convective evolution from shallow clouds was not analyzed. Another study by Zhuang et al. (2017) suggested that wind shear plays no significant role in convective evolution and that convective available potential energy is highest during the transition period. However, they did not assess indirect effects of vertical wind shear on the thermodynamic environment and updraft buoyancy. Additionally, these studies primarily focus on the wet season when RH is high, yet not explicitly on the transition season when RH is lower and aerosol concentration can be high. It is thus unclear whether other variables, such as VWS and aerosols, influence the transition to deep convection, either directly or by indirectly modifying the thermodynamic environment, or whether there may be factors such as air mass source that simultaneously affect VWS or aerosols and contributions by humidity to onset of deep convection. A key to answering these questions might be found by analyzing the preconvective environment. Here, we examine the association of these variables with estimates of plume buoyancy prior to the formation of deep convection.
The DOE Atmospheric Radiation Measurement (ARM) Mobile Facility in Manacapuru, Brazil, established as part of the Green Ocean Amazon campaign (GoAmazon2014/5) provides a suite of ground-based measurements with high spatial and temporal resolution from January 2014 to December 2015. We analyze profiles of entraining plume buoyancies and assess how deep convection may be affected by humidity, VWS, and aerosol concentrations seasonally. Our main interest is to assess the effects of these variables on shallow-to-deep convection transition in the dry-to-wet transition season (August–November) in an effort to shed light on factors that control the increasing frequency of shallow-to-deep convection transition that drives the monsoon onset (Wright et al., 2017).
A suite of ground-based observations from the GOAmazon campaign in Manacapuru, Brazil, is employed in this study to better understand the shallow-to-deep convective transition. The main site is located at 3∘12′ S, 60∘35′ W at 50 m altitude above sea level. The data for this analysis span from March 2014 to November 2015. Selection of this period was based on data availability.
2.1 Data
The primary instrument used to distinguish between shallow and deep convection by estimating cloud boundaries is a zenith-pointing 95 GHz W-band radar (Atmospheric Radiation Measurement Climate Research Facility, 2014), which works in both a co-polarization and cross-polarization mode. The reflectivity data (valid range between −90 and 50 dBZ) have temporal and vertical resolutions of 1 s and 30 m, respectively, that are provided as a function of height and time in the units of decibels relative to reflectivity (dBZ) with measurement accuracy of 0.5 dBZ. This dataset is available from February 2014 to November 2015. In addition to using the radar data to identify the cloud top, we have also used the micropulse lidar (MPL) to codetect the convective tops. This is to reduce the uncertainty of the detection (as well as false detection) of the shallow and deep clouds due to the radar attenuation problem (Atmospheric Radiation Measurement Climate Research Facility, 2015a). The MPL is a ground-based optical remote sensing system that determines the top and base heights of clouds using a 30 s cloud mask based on the Wang and Sassen (2001) algorithm. Based on a time-resolved signal of transmitted and backscattered pulse, a real-time detection of the clouds can be made. These datasets are available from January 2014 to December 2015.
Vertical profiles of thermodynamic variables, such as zonal and meridional wind speed and direction, temperature, and relative humidity at pressure altitudes (from the surface to 3 hPa) are derived from the balloon-borne sounding system (SONDEWNPN, Atmospheric Radiation Measurement Climate Research Facility, 2015b). These data are available from January 2014 to November 2015 and the measurements are taken daily at 05:30, 11:30, 14:30 (occasional), 17:30, and 23:30 GMT. Radiosonde data provide information about meteorological and thermodynamic profiles, such as humidity, temperature, wind speed, and direction.
Since we are also interested in understanding the role of aerosols on the convective transition (AOSMET, Atmospheric Radiation Measurement Climate Research Facility, 2015c), we have used datasets from the aerosol observing system (AOS) that provides in situ aerosol absorption and scattering coefficients as functions of the particle size and wavelength at the surface. The AOS also provides information about particle number concentration, size distribution, and the chemical composition of the particles and has a cloud condensation nuclei (CCN) particle counter that measures the CCN concentrations at a temporal resolution of 1 min. It passes aerosol particles through thermodynamically unstable supersaturated water vapor in a column and the water vapor condenses on the aerosol particles. Particles that grow larger are counted. In this way, they measure the activated ambient aerosol particle number concentration that can be activated as CCN. We analyze CCN in this study to understand the influence of ambient aerosols on deep convection.
2.2 Methods
We calculate the mean buoyancy perturbation profiles between the environment and an entraining plume for ensembles of events in which shallow and deep convective characteristics are defined as described below. This permits investigation of the thermodynamic effect of BL humidity (between surface and 950 hPa), free tropospheric relative humidity (between 850 and 400 hPa), low-level VWS, deep tropospheric VWS, and CCN concentrations. Low-level VWS is defined as the difference of the mean wind speed (zonal, since meridional wind difference is smaller) between the two 100 mbar thick layers centering at 937 and 737 hPa (Weisman and Rotunno, 2000); the deep level VWS is the difference between the layers centering at the 887 hPa and 287 hPa pressure levels (Chakraborty et al., 2016; Petersen et al., 2006). We calculate VWS by subtracting the mean wind speed of the top layer from that of the bottom layer.
We define shallow convection as having a cloud top height (CTH) below 4 km above the surface with a convective depth of more than 2 km. Deep convection is identified when CTH extends 8 km or more above the surface with a depth of more than 6 km (Wang and Sassen, 2007). In order to avoid errors related to the attenuated radar and lidar pulses, we used both the radar reflectivity (> −5 dBZ; Wang and Sassen, 2007) and CTH derived from the MPL to identify shallow and deep convection. From the radar dataset, we first separate the shallow convection based on whether they remain shallow cloud until demise or whether they grow into deep convection with time. Since we are interested in understanding why some shallow convection evolves into deep convection while others do not, we investigate the meteorological, thermodynamic, and aerosol properties before these shallow clouds form. Conditions before shallow convection, which grows into deep convection with time, are considered to be “before shallow-to-deep”, or BSHDP. However, conditions pertaining to shallow convection that stays shallow are considered to be “before-shallow” (BSH). For the information regarding the profiles of RH, temperature, and wind speed during the BSH and BSHDP conditions, we use the radiosonde measurements taken within 2 h before the shallow or shallow-to-deep convective event. CCN concentrations are averaged over ±30 min centered on the time of radiosonde launch. These averaging time frames and radiosonde measurements are statistically robust, as shown in Schiro et al. (2016), where they show that temporal averaging up to and including 3 h yields robust statistics defining the transition to deep convection. In this study, we show the impacts of CCN based on 30 min average before and after the radiosonde measurement. We estimate mixing ratio profiles for the BSH and BSHDP conditions from the radiosonde data from a series of equations:
where Vsat is the saturation vapor pressure, P is the pressure, T is the temperature, RH is the relative humidity, and mrsat is the saturation mixing ratio (mr) at any level.
Lastly, we evaluate the variations of entraining plume buoyancies with RH, VWS, and CCN during BSHDP and BSH events to infer the influences of these environmental conditions on the development of deep convection. The methods described in Holloway and Neelin (2009) are used here to calculate the buoyancy profiles, defined as the virtual temperature (Tv) differences between the environment and an entraining parcel. Buoyancies are computed using mixing and microphysical assumptions that span a range of possibilities. Results are presented primarily for deep inflow A (DIA) mixing with and without freezing. Deep inflow B (DIB) mixing with and without freezing, and a mixing assuming constant value of the entrainment parameter is presented in the Supplement to test sensitivity. Parcels originate from 1000 mb and Tv is interpolated in increments of 5 mb. The constant mixing case is an isobaric, fixed rate of linear mixing defined here to be 0.05 hPa−1. DIA corresponds instead to an large-eddy-simulated-based mixing scheme (Siebesma et al., 2007) in which the mixing coefficient depends inversely on height (αz−1), which has been shown to be a more realistic representation of buoyancy compared to constant mixing (Schiro et al., 2016; Holloway and Neelin, 2009). In DIB mixing, mass flux increases linearly at low levels, but tapers in the midtroposphere (Schiro et al., 2016; Holloway and Neelin, 2009). Schemes without freezing assume that the liquid water potential temperature is conserved while schemes that include freezing conserve the ice–liquid water potential temperature and all liquid is converted to ice when the plume reaches 0 ∘C. Schiro et al. (2016) show results suggesting that DIA might be a suitable scheme over the Amazon by illustrating the consistency between the sharp increase in precipitation observed with both increasing column water vapor (CWV) and plume buoyancies, and results are fairly similar between the two deep inflow schemes, so DIA is presented as representative.
3.1 Mean characteristics of the BSH and BSHDP convective environments
To identify favorable atmospheric conditions before shallow and deep convective systems form, we evaluate differences in the mixing ratio averaged over all BSHDP (BSH) conditions relative to such averages over all the clear sky conditions, denoted mr′, in all seasons (wet, dry, and dry–wet transition). Figure 1 shows that BSHDP conditions are associated with a higher mean mixing ratio throughout the troposphere than BSH conditions. During the transition season, such differences are the largest compared to the wet and dry seasons, especially above the 800 hPa level. Differences in mr′ between the BSH and BSHDP conditions can reach up to 2 g kg−1 at the 600 hPa level during the transition period. Additionally, mr′ during BSHDP conditions is deeper (up to 300 hPa) in the transition season compared to the wet season (650 hPa) and dry season (500 hPa). Differences between mr′ during BSH and BSHDP conditions are smaller during the wet season. This is likely due to the greater column moisture available throughout the wet season (Collow et al., 2016).
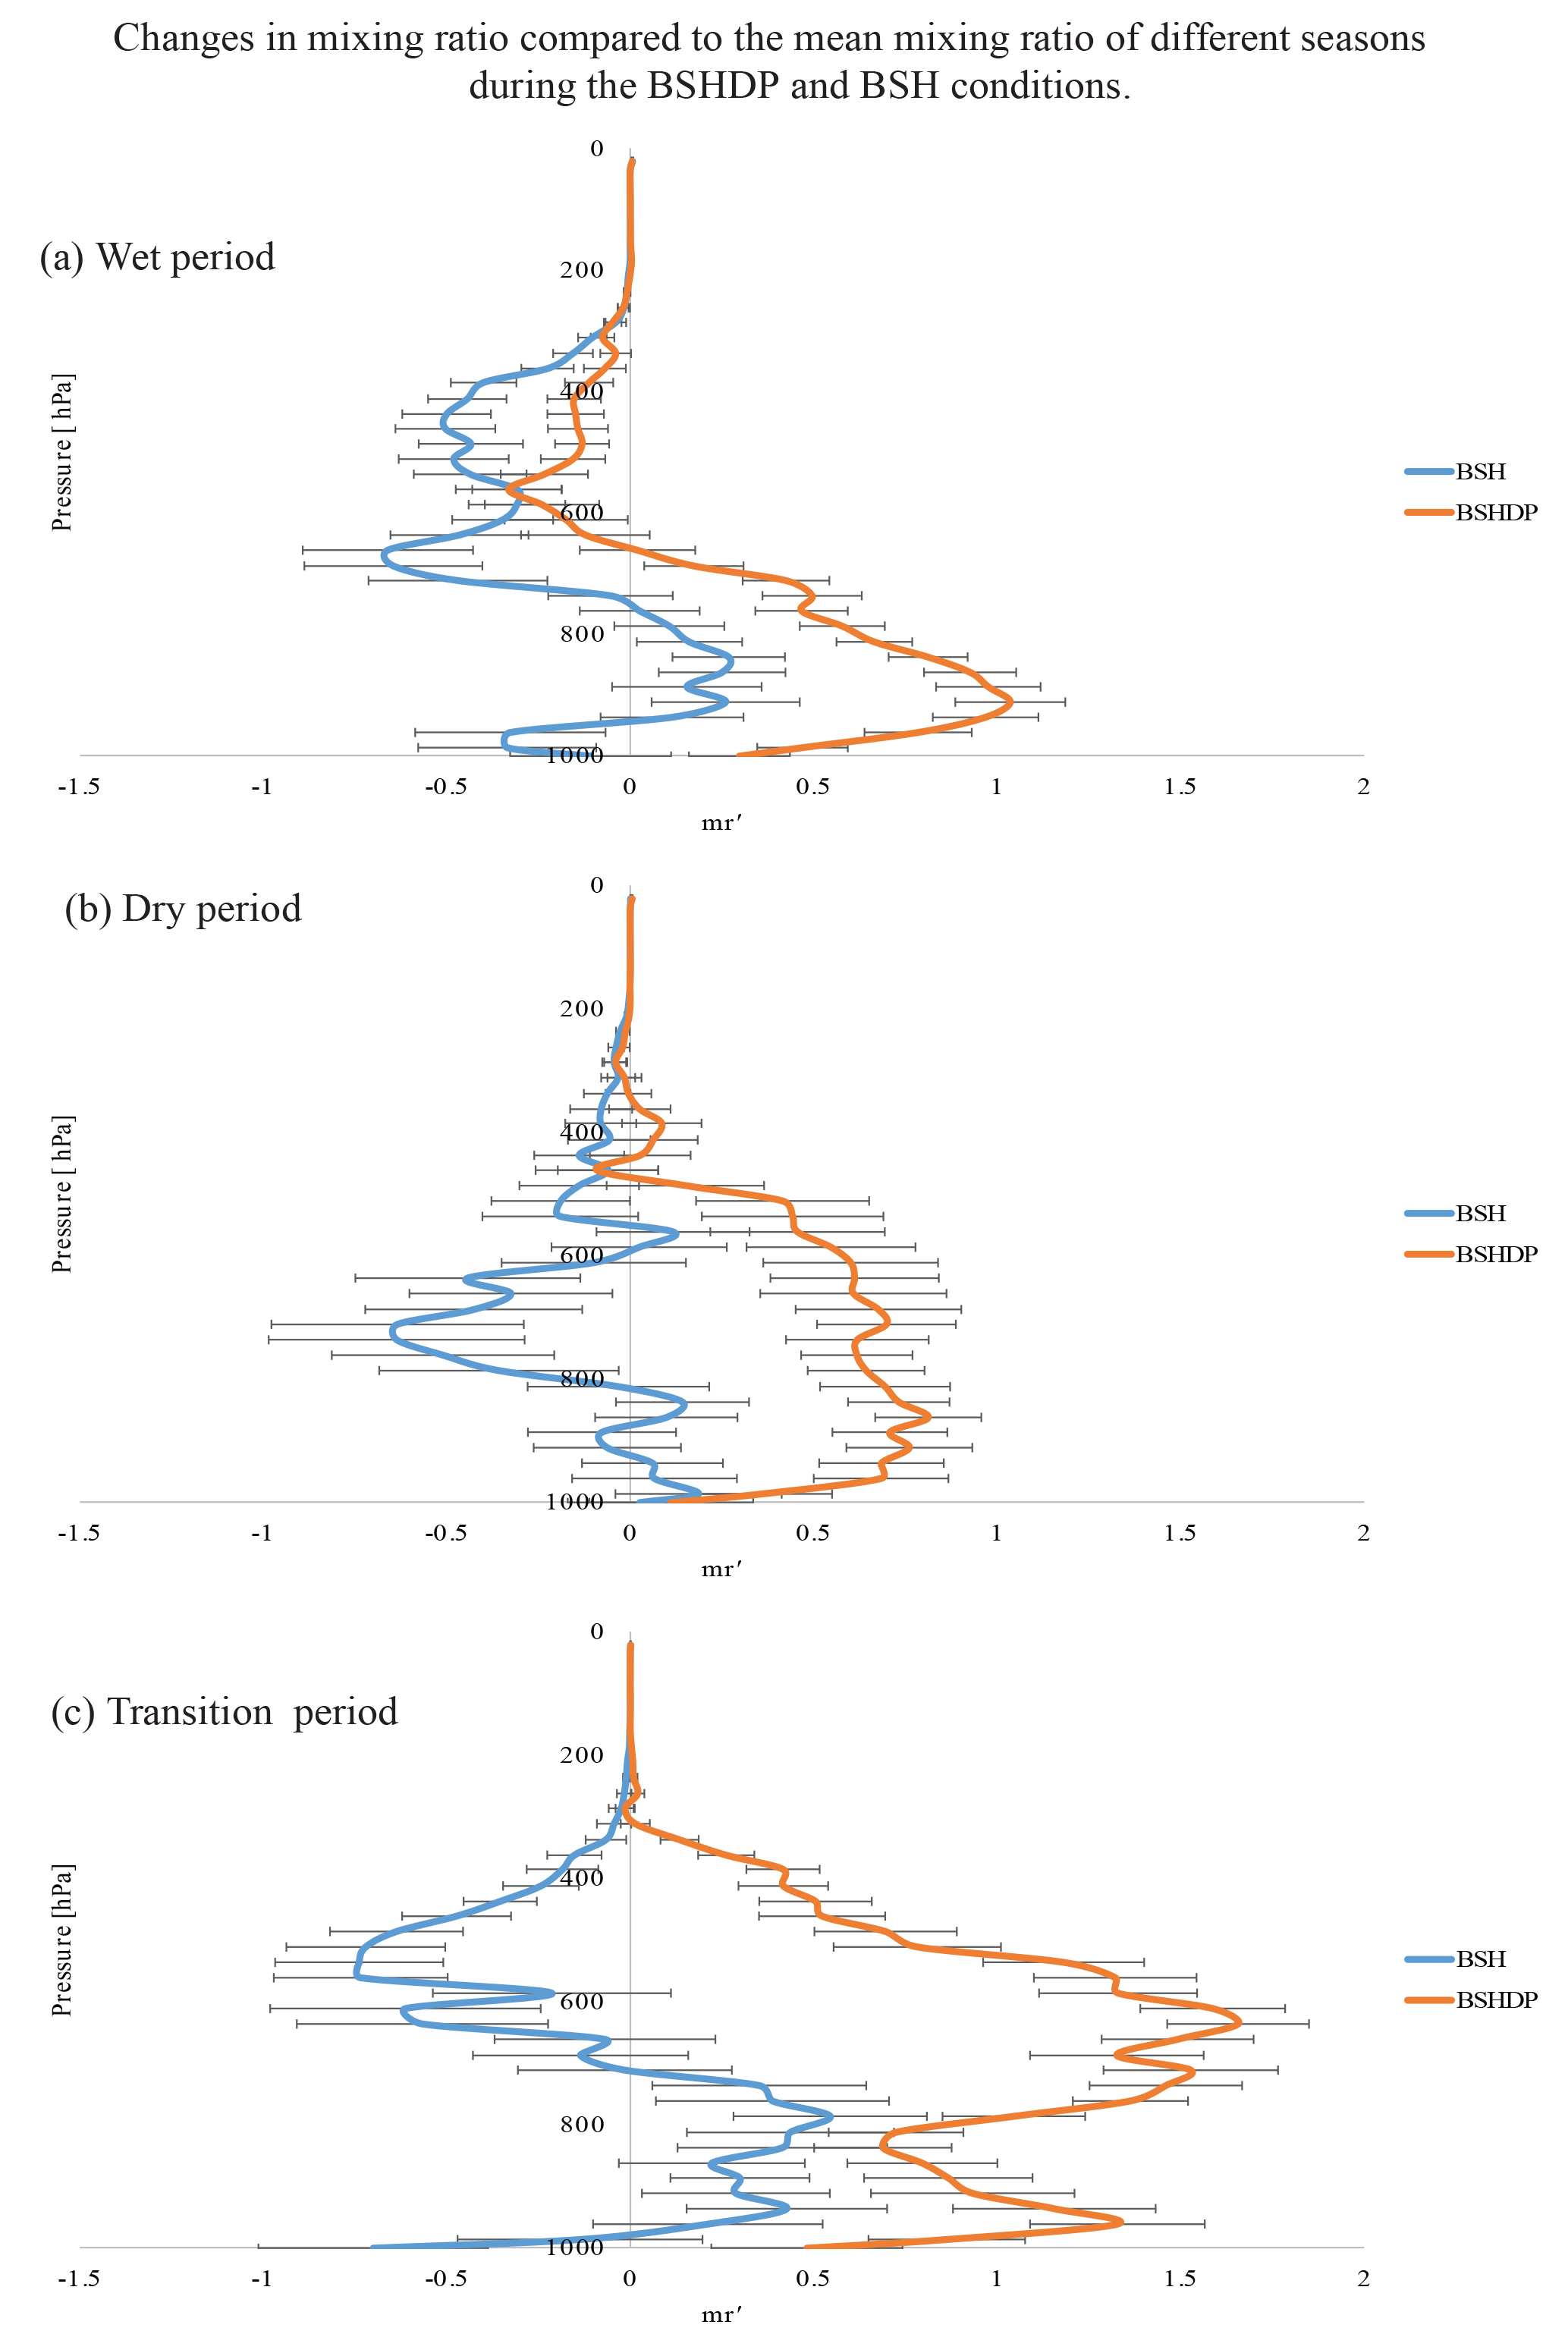
Figure 1Differences in the mixing ratio (mr′) averaged over the before shallow (BSH) and before shallow-to-deep (BSHDP) conditions relative to that averaged over clear sky conditions during the (a) wet, (b) dry, and (c) transition periods. Error bars show two standard deviations for the data.
Similarly, we evaluate the mean RH associated with the BSH and BSHDP conditions at the 1000–850 hPa (lower troposphere), 850–700 hPa (lower free troposphere), 700–500 hPa (middle troposphere), and 500–350 hPa (upper–middle troposphere) levels during all three seasons. Figure 2 shows that the preshallow convective conditions are associated with smaller RH compared to BSHDP conditions for all four layers during all three seasons; however, this difference is the strongest and most significant during the transition period above 700 hPa.
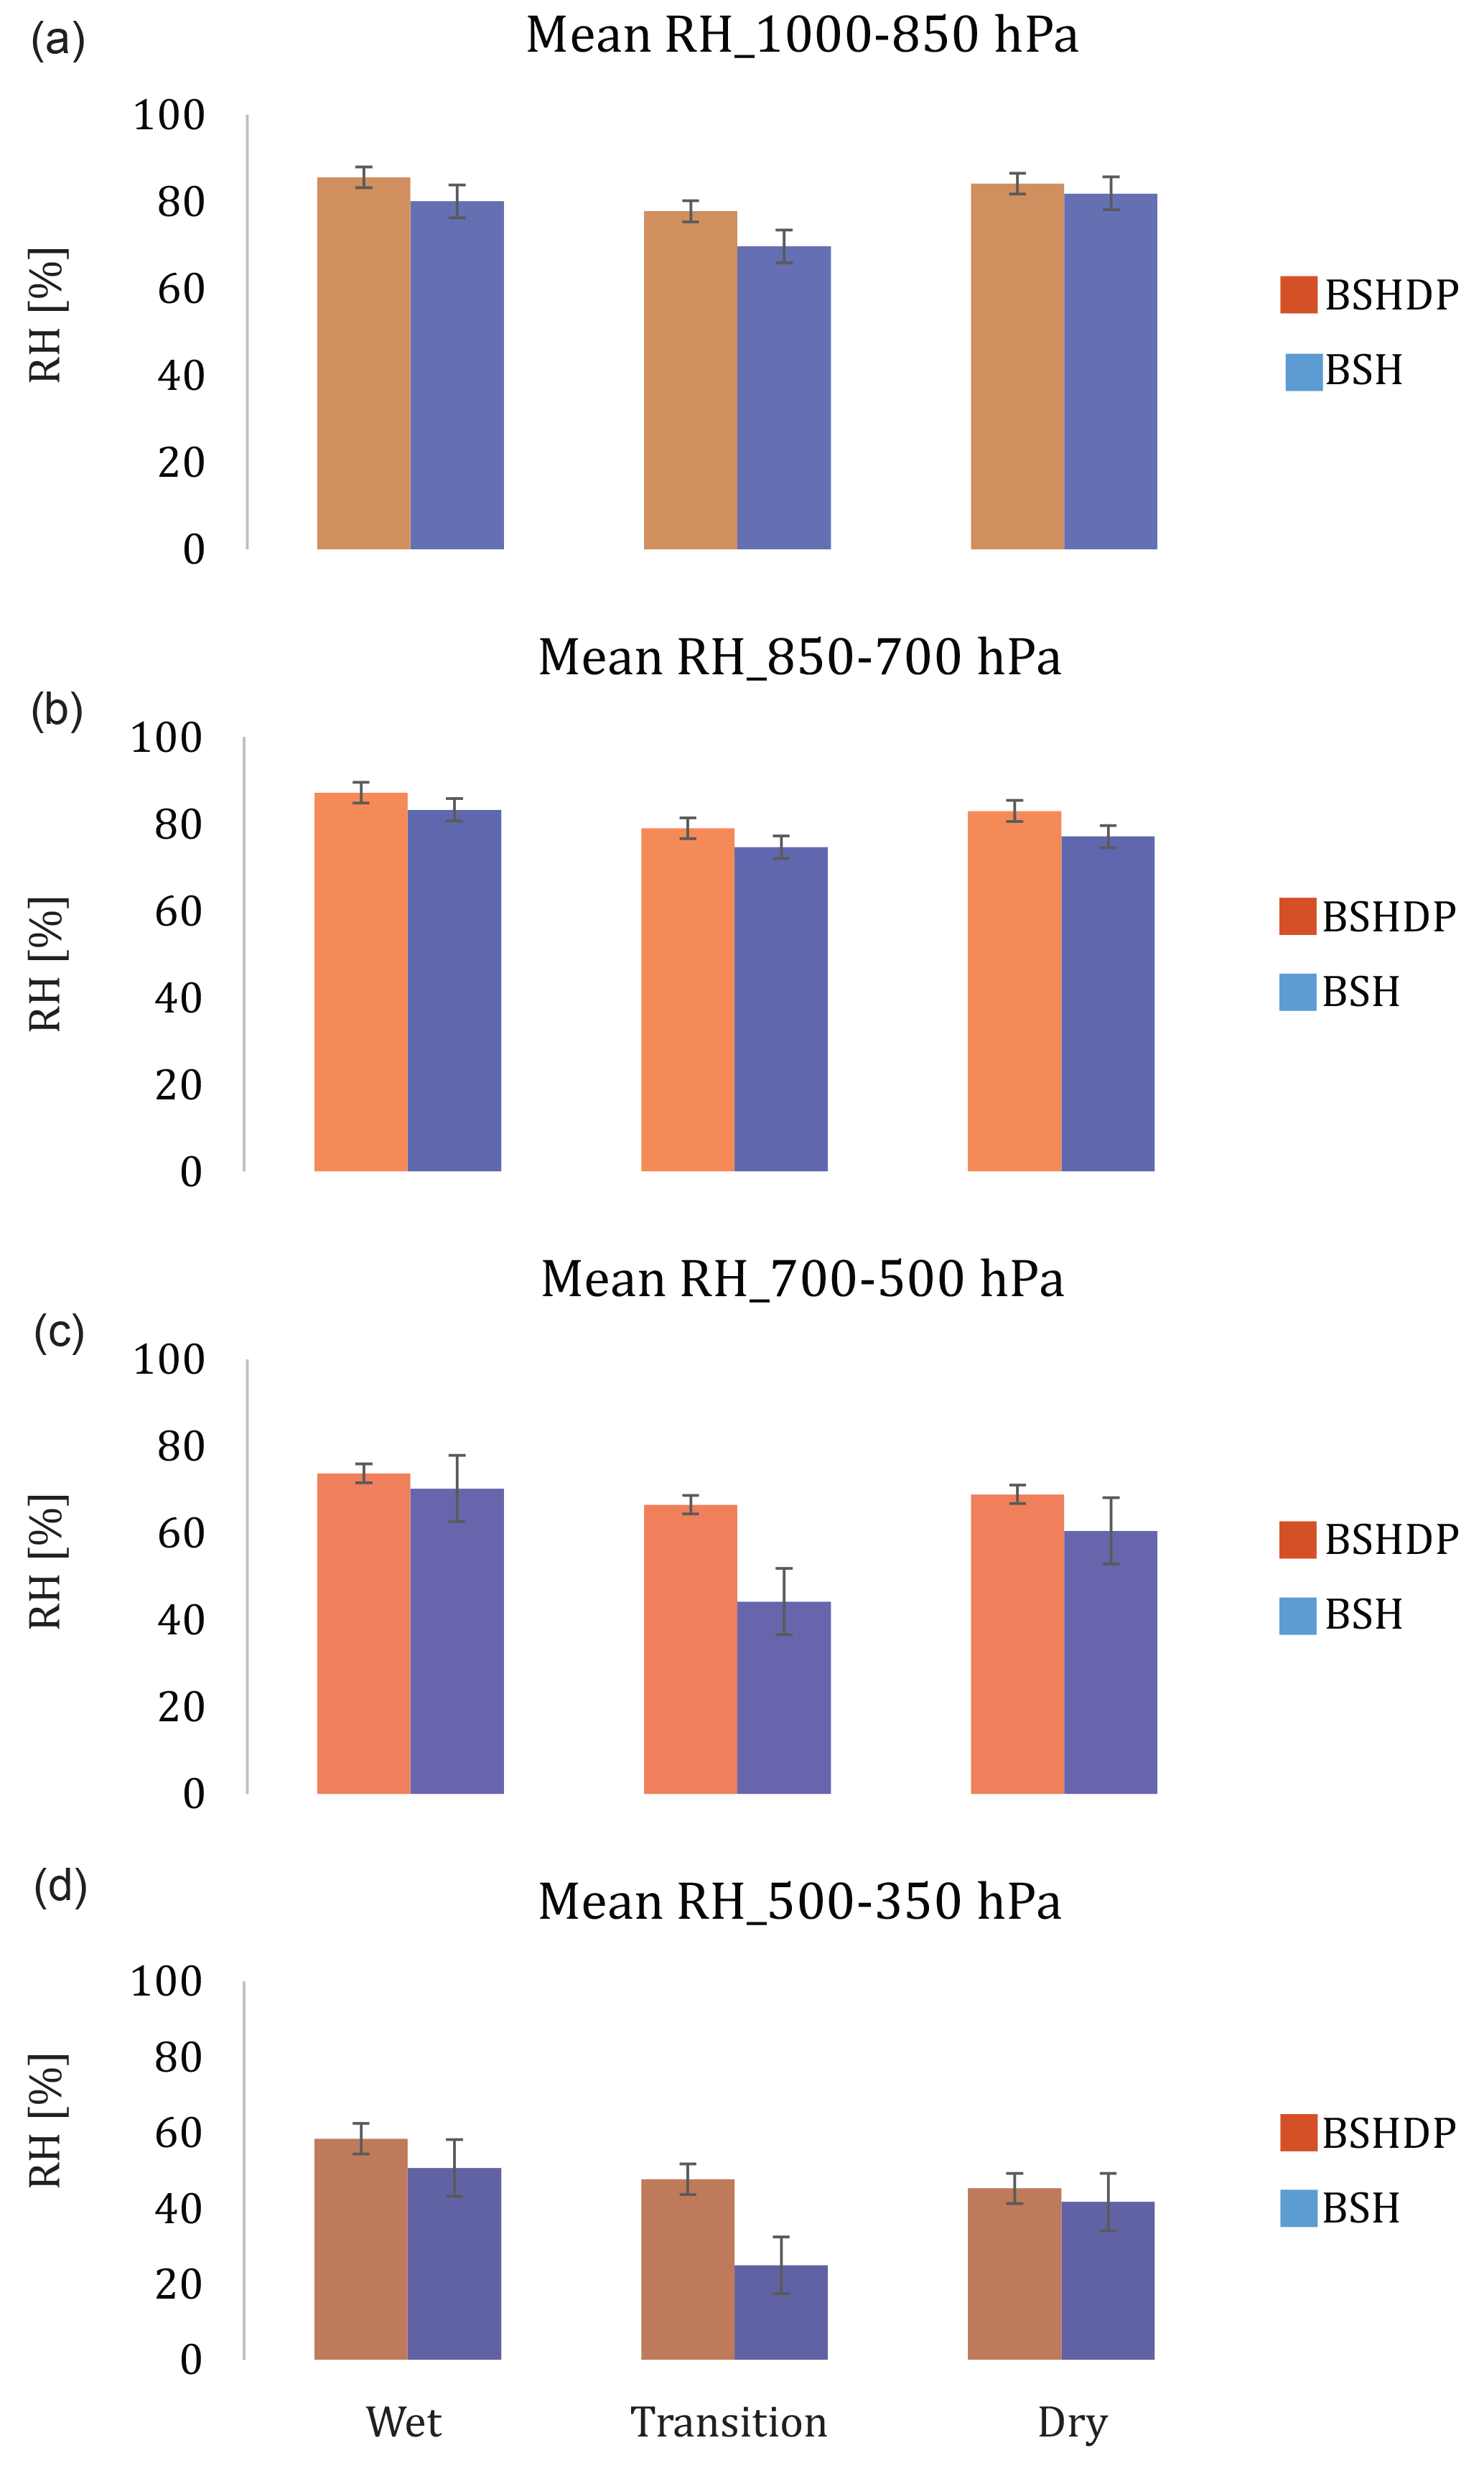
Figure 2Mean RH of different levels during the BSH and BSHDP conditions. Error bars show standard error of 2 for the data.
Figure 3 shows the differences in mean wind speed before the BSHDP and BSH conditions. BSHDP conditions are associated with a change in wind speed compared to the clear sky condition up to a height of 300 hPa, whereas BSH conditions are associated with a stronger wind up to an altitude of 750 hPa only. This suggests that shallow convection may occur in a low-level sheared environment in comparison to clear sky conditions.
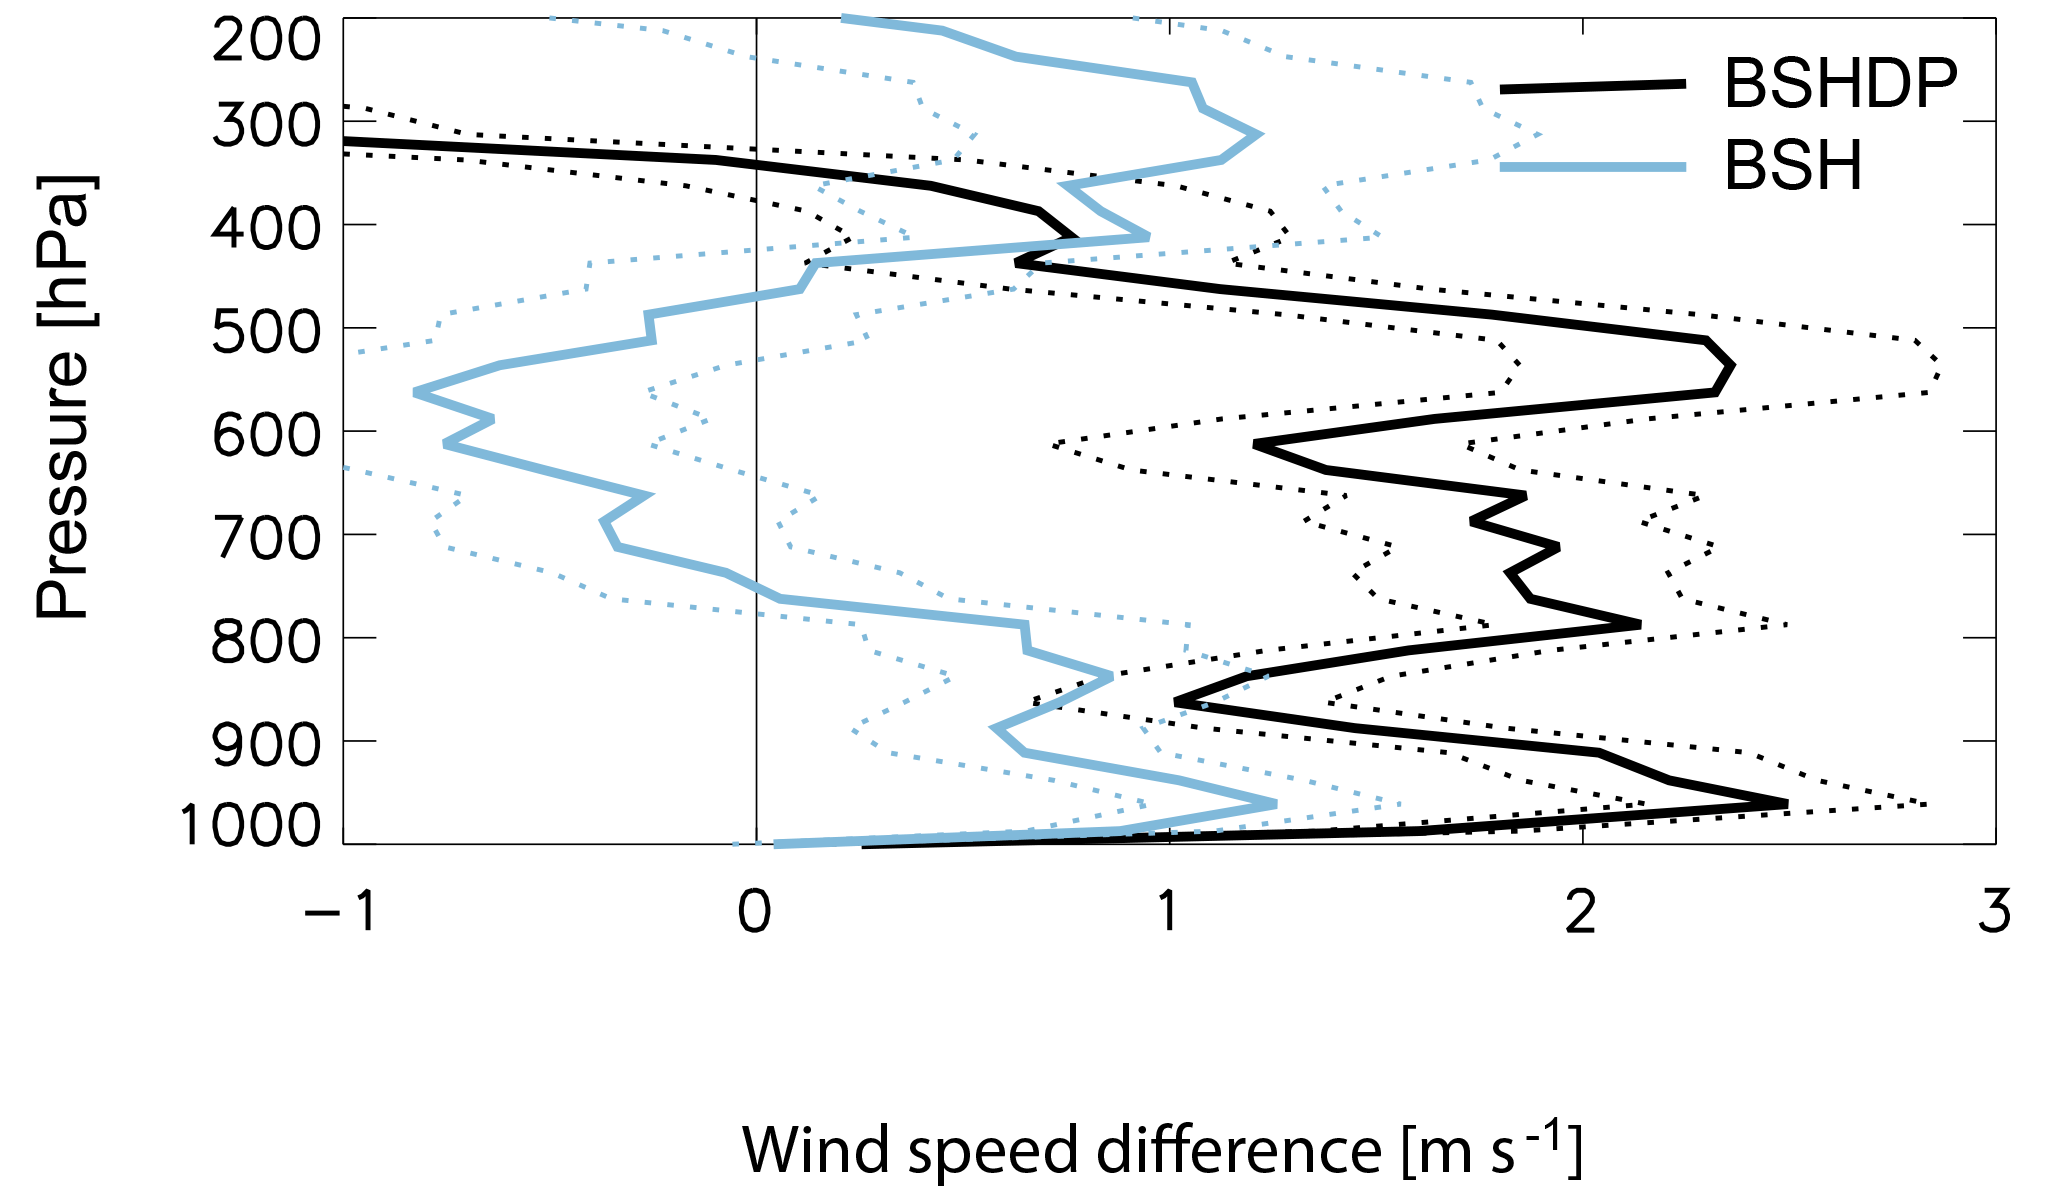
Figure 3Differences in wind speed prior to BSHDP and BSH conditions during the transition period compared to the clear sky conditions. Solid lines represent the mean and the dotted lines represent the standard deviation of 2 for the wind speed for BSHDP and BSH cases.
Figure 4 shows that a higher CCN concentration is associated with BSH cases in comparison to BSHDP cases in the transition season. It is unknown, however, whether such a change of CCN concentration reflects aerosols' impacts on shallow-to-deep convection transitions or merely an outcome of dry environments suppressing development of deep convection and/or the scavenging effect of rainfall in a wet environment. The CCN levels associated with BSH are comparable to those for clear sky or no-cloud (NC) cases, while those associated with BSHDP are lower. For the local region of the data considered in classifying the events, the CCN observation is prior to the convection, so local scavenging effects by wet deposition associated with convection are excluded. However, we cannot exclude that convection-related scavenging may have occurred upstream in the air mass prior to events, and that this could occur more frequently under conditions that tend to lead to BSHDP events. During the dry and wet seasons, there are no clear and significant differences in CCN concentration between the BSHDP and BSH conditions.
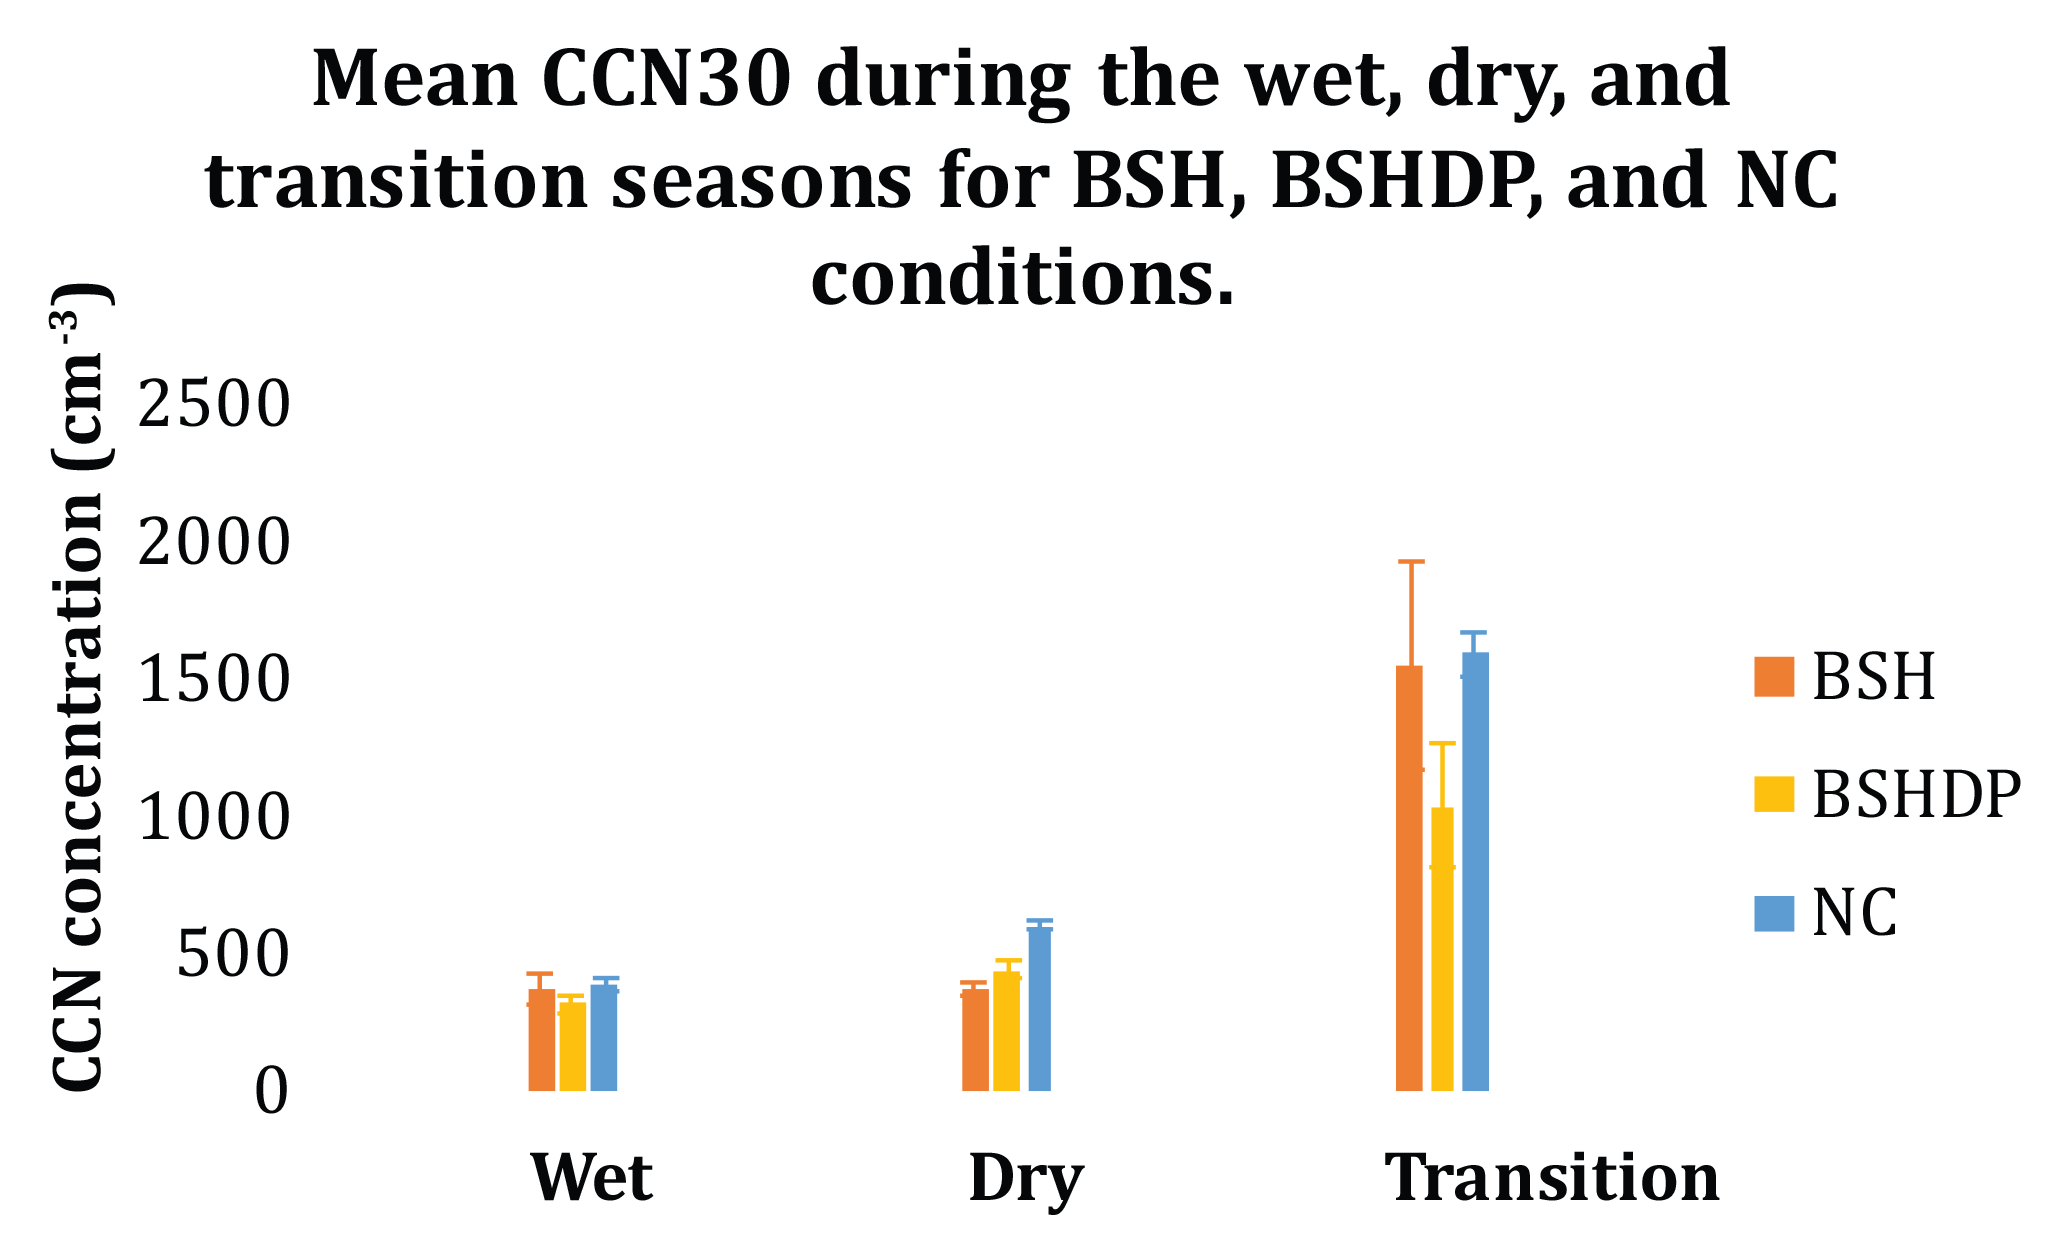
Figure 4Mean CCN concentrations (cm−3) for the BSH, BSHDP, and clear sky (NC) conditions over 30 min during all three seasons. Error bars show standard deviation of 2 for the data.

Figure 5Profiles of delta Tv for BSH and BSHDP conditions under different cases of mixing and entrainment schemes compared to the mean environmental Tv condition obtained from the radiosonde data for different percentiles of free tropospheric RH (850–400 hPa) associated with the convections during the transition seasons. Shaded area represents standard error of 2 for each profile. Values of corresponding FTRH are shown in the table. Total number of samples of BSHDP and BSH cases are 37 and 29, respectively. Solid (light blue shade), dotted (moderate blue shade), and dashed (dark blue shade) lines represent the conditionally averaged delta Tv values (two sigma errors) for the 0–33.33, 33.33–66.67, and 66.67–99.99 ‰ intervals, respectively.
3.2 Examining direct thermodynamic effects from humidity on buoyancy
To examine the connection between humidity, vertical wind shear, and aerosols on the preconditioning of the convective environment and how they impact the conditional instability of the environment, we calculate buoyancies for plumes originating in the boundary layer using simple entraining plume models. We compute differences between a plume's virtual temperature (Tv) and the Tv of the environment () and conditionally average profiles associated with BSH and BSHDP conditions separately based on percentiles of humidity. This allows us to explore how the large free tropospheric moisture anomalies shown in Fig. 1 relate to the conditional instability of the environment and prove to be favorable for the development of deep convection, in contrast to the lower humidity observed for shallow convective cases.
Figure 5 shows that very humid free tropospheric relative humidity (FTRH) conditions in the upper tercile are associated with comparatively larger buoyancies during both BSH and BSHDP conditions. Though we choose to only show results for one mixing assumption (deep inflow A; Holloway and Neelin, 2009), this holds true under a range of mixing assumptions (as shown in Fig. S1 of the Supplement). All BSHDP profiles are buoyant above 800 mb for any amount of free tropospheric humidity, which highlights the success of the deep-inflow scheme (with freezing) in capturing positive buoyancy for observed cases of deep convection. Profiles associated with higher humidity in the upper tercile (> 66.67 ‰; > 70 %) have significantly larger buoyancy than other profiles. For BSH conditions (Fig. 5c), low (< 33.33 ‰; < 43 %) and moderately (33.33–66.67 ‰; < 51 %) humid environments are suitable for shallow convective development only; however, as FTRH increases between 51 % (66.67 ‰) and 71 % (99.99 ‰), such profiles appear consistent with the formation of deep convective clouds – if the plume was able to reach to the freezing level and the release of latent heat were available for additional buoyancy. The buoyancy profiles corresponding to instances of shallow-only convection have a deeper layer of negative buoyancy than BSHDP cases, on average. This may be one factor acting to suppress what may otherwise be an environment favorable for deep convection at high humidity.
An important conclusion is that without some occurrence of freezing, the possibility of a transition from shallow-to-deep convection is significantly reduced in all BSHDP cases (Betts, 1997). Here, all condensate is frozen when the parcel temperature drops below 0 ∘C, a useful limiting case that permits the impacts of freezing to be seen clearly. In practice, the freezing will occur over some layer, and will depend on nucleation processes (Rosenfeld et al., 2008). Though not explicitly tested in our analysis here, this also suggests that the effects of aerosols on freezing microphysics are likely to be impactful to the shallow-to-deep transition. There is some sensitivity to other entrainment schemes chosen; for instance, deep inflow B cases (Supplement Fig. S1) show positive buoyancy profiles up to 200 hPa, yet the total buoyancy is smaller compared to that in the deep inflow A cases. These differences are attributed to the different mixing rates in the lower free troposphere.
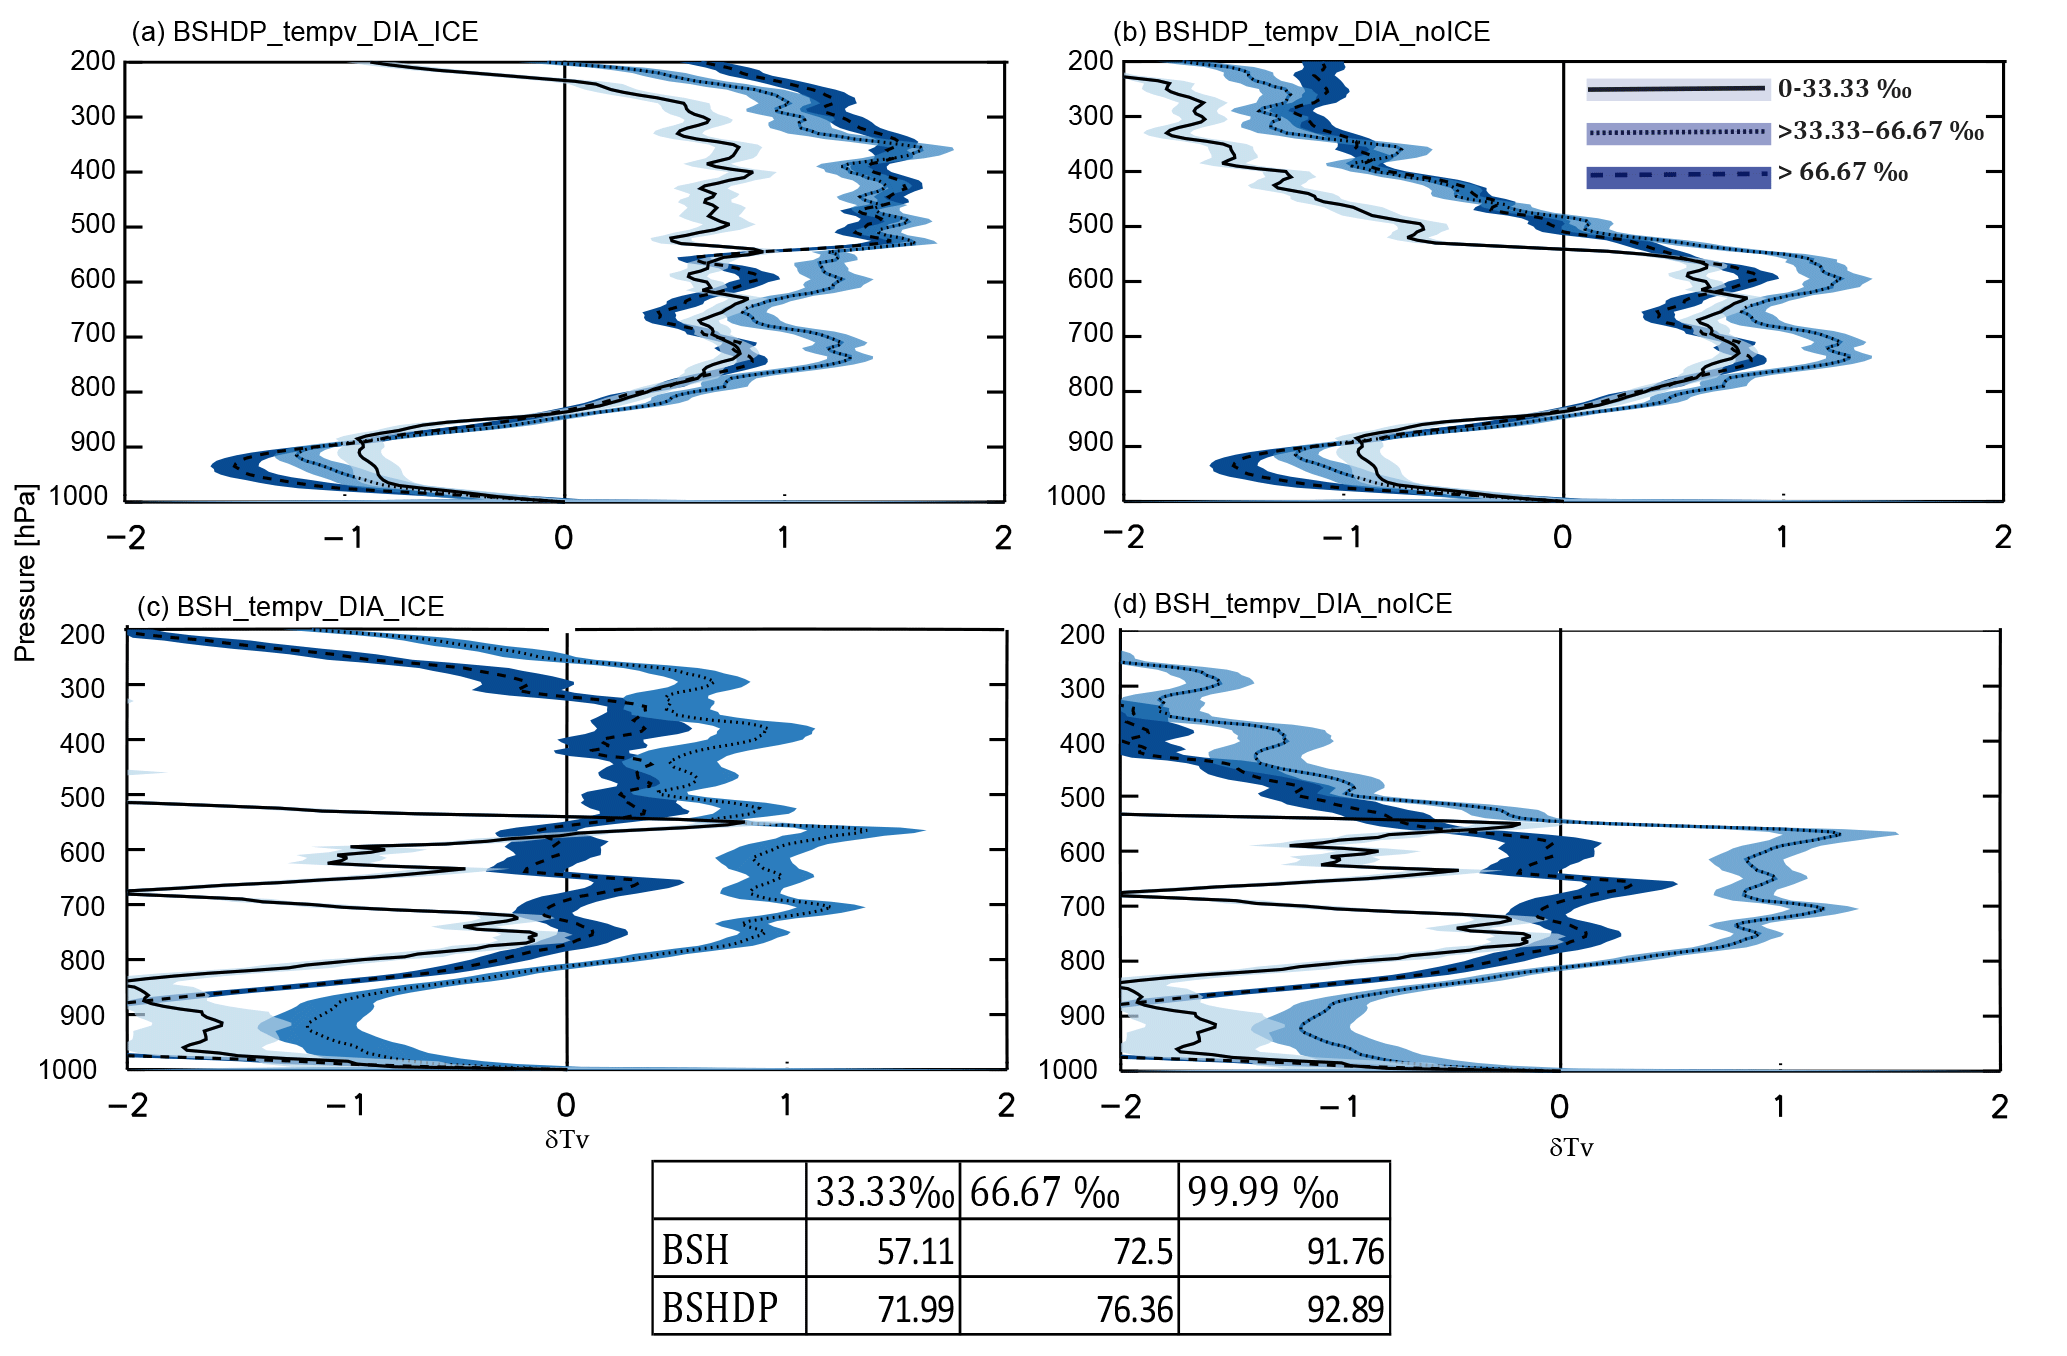
Figure 6Same as in Fig. 5, but for different percentile values of BLRH. Values of corresponding BLRH are shown in the table.
We also conditionally average profiles by boundary layer relative humidity (BLRH) in Fig. 6. BSHDP profiles are buoyant up to 200 hPa for all BLRH values, most probably owing to a higher RH (> 72 %) compared to BSH profiles. This, again, highlights that the buoyancy computations are successful in producing positive buoyancy for observed cases of deep convection. As in the case of FTRH, moderate to high BLRH (> 72 %) is associated with larger buoyancy for BSHDP conditions (Fig. 6a), BSHDP profiles are more buoyant than BSH profiles (Fig. 6c), and consideration of freezing is a must for the deep convective evolution (Fig. 6b). On average, as seen in Figs. 1 and 2, the BL mixing ratio and BLRH (respectively) are higher for BSHDP conditions than BSH conditions, which is also reflected in the range of values defining the terciles in the table of Fig. 6. Though likely not the limiting factor in the transition to deep convection, given the range of values observed for both BSH and BSHDP cases, BLRH and buoyancy are intimately connected.
3.3 Examining indirect thermodynamic effects from shear and CCN on buoyancy
Previous studies have shown that the vertical wind shear and aerosols concentration can influence convective intensity and rainfall. For example, VWS influences the rainfall and total condensation within developing convection (Weisman and Rotunno, 2004), slantwise ascent of the parcel (Moncrieff, 1978), storm rotation, maintenance, vorticity, updraft speed (Weisman and Rotunno, 2000), and lifetime (Chakraborty et al., 2016). Though detailed microphysical properties are not considered in our simple plume calculations, it is worth noting that a recent study by Wu et al. (2017) found that lower tropospheric wind shear promotes the droplet collision and growth inside the shallow clouds by the production of turbulent kinetic energy. However, Weisman and Rotunno (2004) using a two-dimensional vorticity simulation model found that increasing vertical wind shear depth from surface −3 km (low) to surface −10 km (deep) decreases the overall condensation and rainfall output.
However, whether and how vertical wind shear and aerosol concentrations affect the thermodynamic environment and thus buoyancy is not well known, especially during the preconditioning period before the clouds form. Hence, we examine potential indirect effects of VWS and CCN concentration on the thermodynamics of the convective environment and thus plume buoyancy.
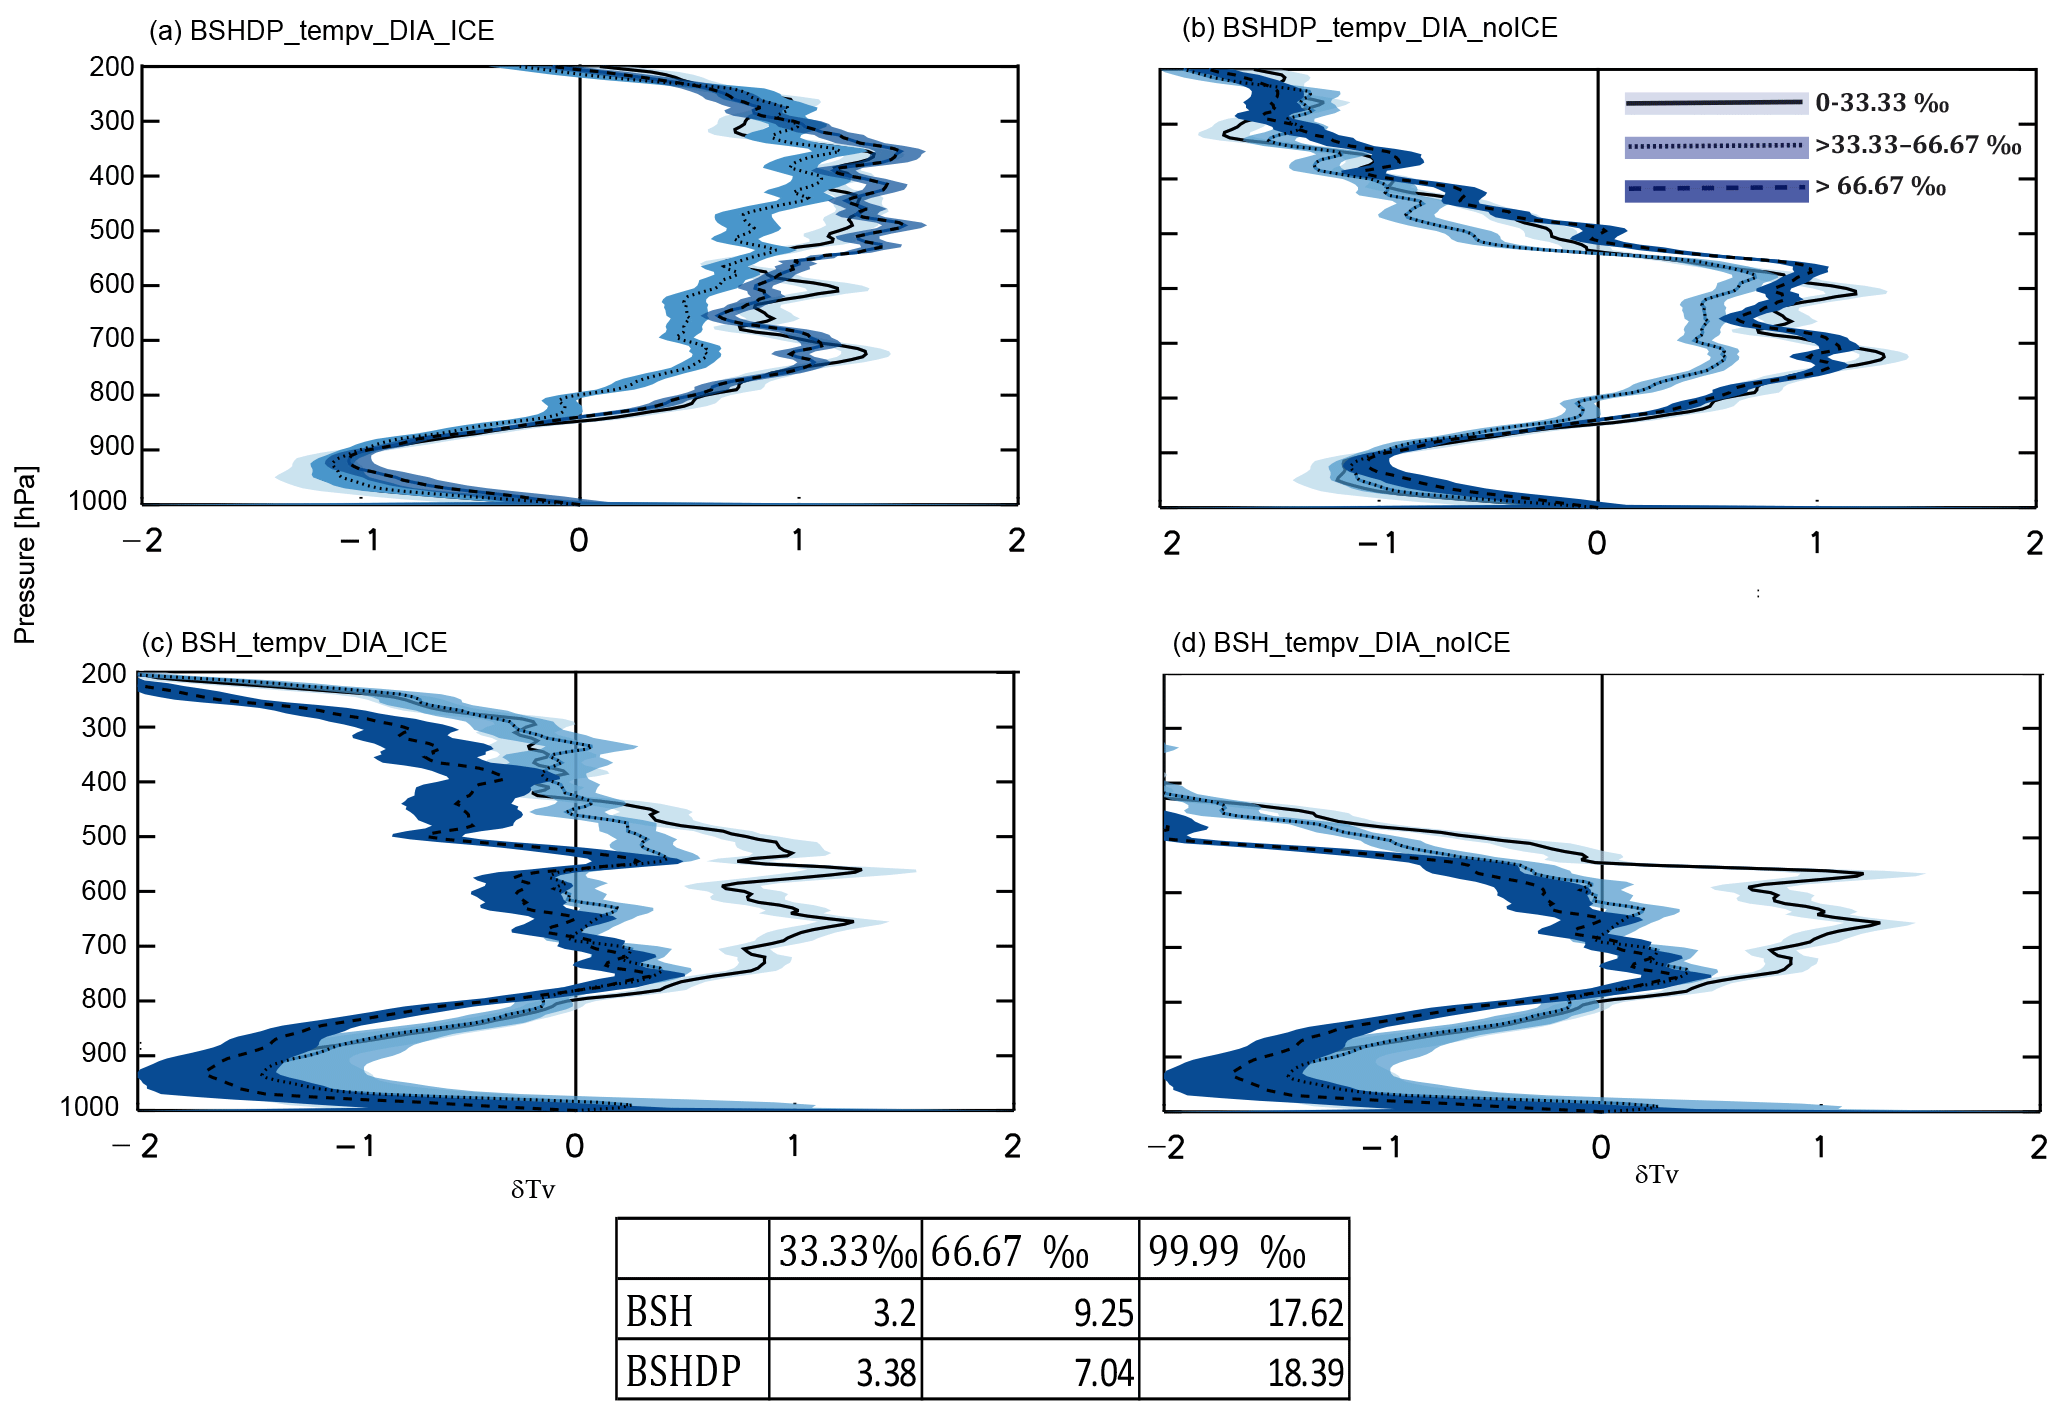
Figure 7Same as in Fig. 5, but for different percentile values of deep tropospheric VWS. Values of corresponding DVWS are shown in the table.
We look at the effect of controlling for DVWS on buoyancy profiles in Fig. 7. The results show that no significant changes in BSHDP buoyancy profiles occur through the range of DVWS from low (3 m s−1) to high (18 m s−1) values (Fig. 7a and b), which is true even for the full range of mixing assumptions tested (not shown). However, DVWS conditions do appear to be related to buoyancy among the shallow convective cases sampled. Figure 7c and d show that for BSH events, buoyancy is largest in a layer between roughly 500–850 mb when DVWS is low (< 33.33 ‰; < 3.2 m s−1); as DVWS increases, buoyancy in the midtroposphere decreases.
Recalling from Fig. 3 that BSH conditions are associated with a change in wind speed up to 750 hPa only, we also analyze the influence of the lower tropospheric VWS (LVWS). As in the case of DVWS, controlling for changes in LVWS appears to have an insignificant influence on the BSHDP profiles (Figs. 8a and b). However, unlike DVWS, strong LVWS (> 66.67 ‰; > 5.64 m s−1) corresponds to increased buoyancy in the lower troposphere, especially in the 500–850 mbar layer (Fig. 8c and d). BSH conditions associated with weak to moderate LVWS (< 5.64 m s−1) are associated with significantly lower buoyancy. As a result, it can be inferred that a high LVWS or a low DVWS has associations with prethermodynamic conditions that might favor shallow convection.
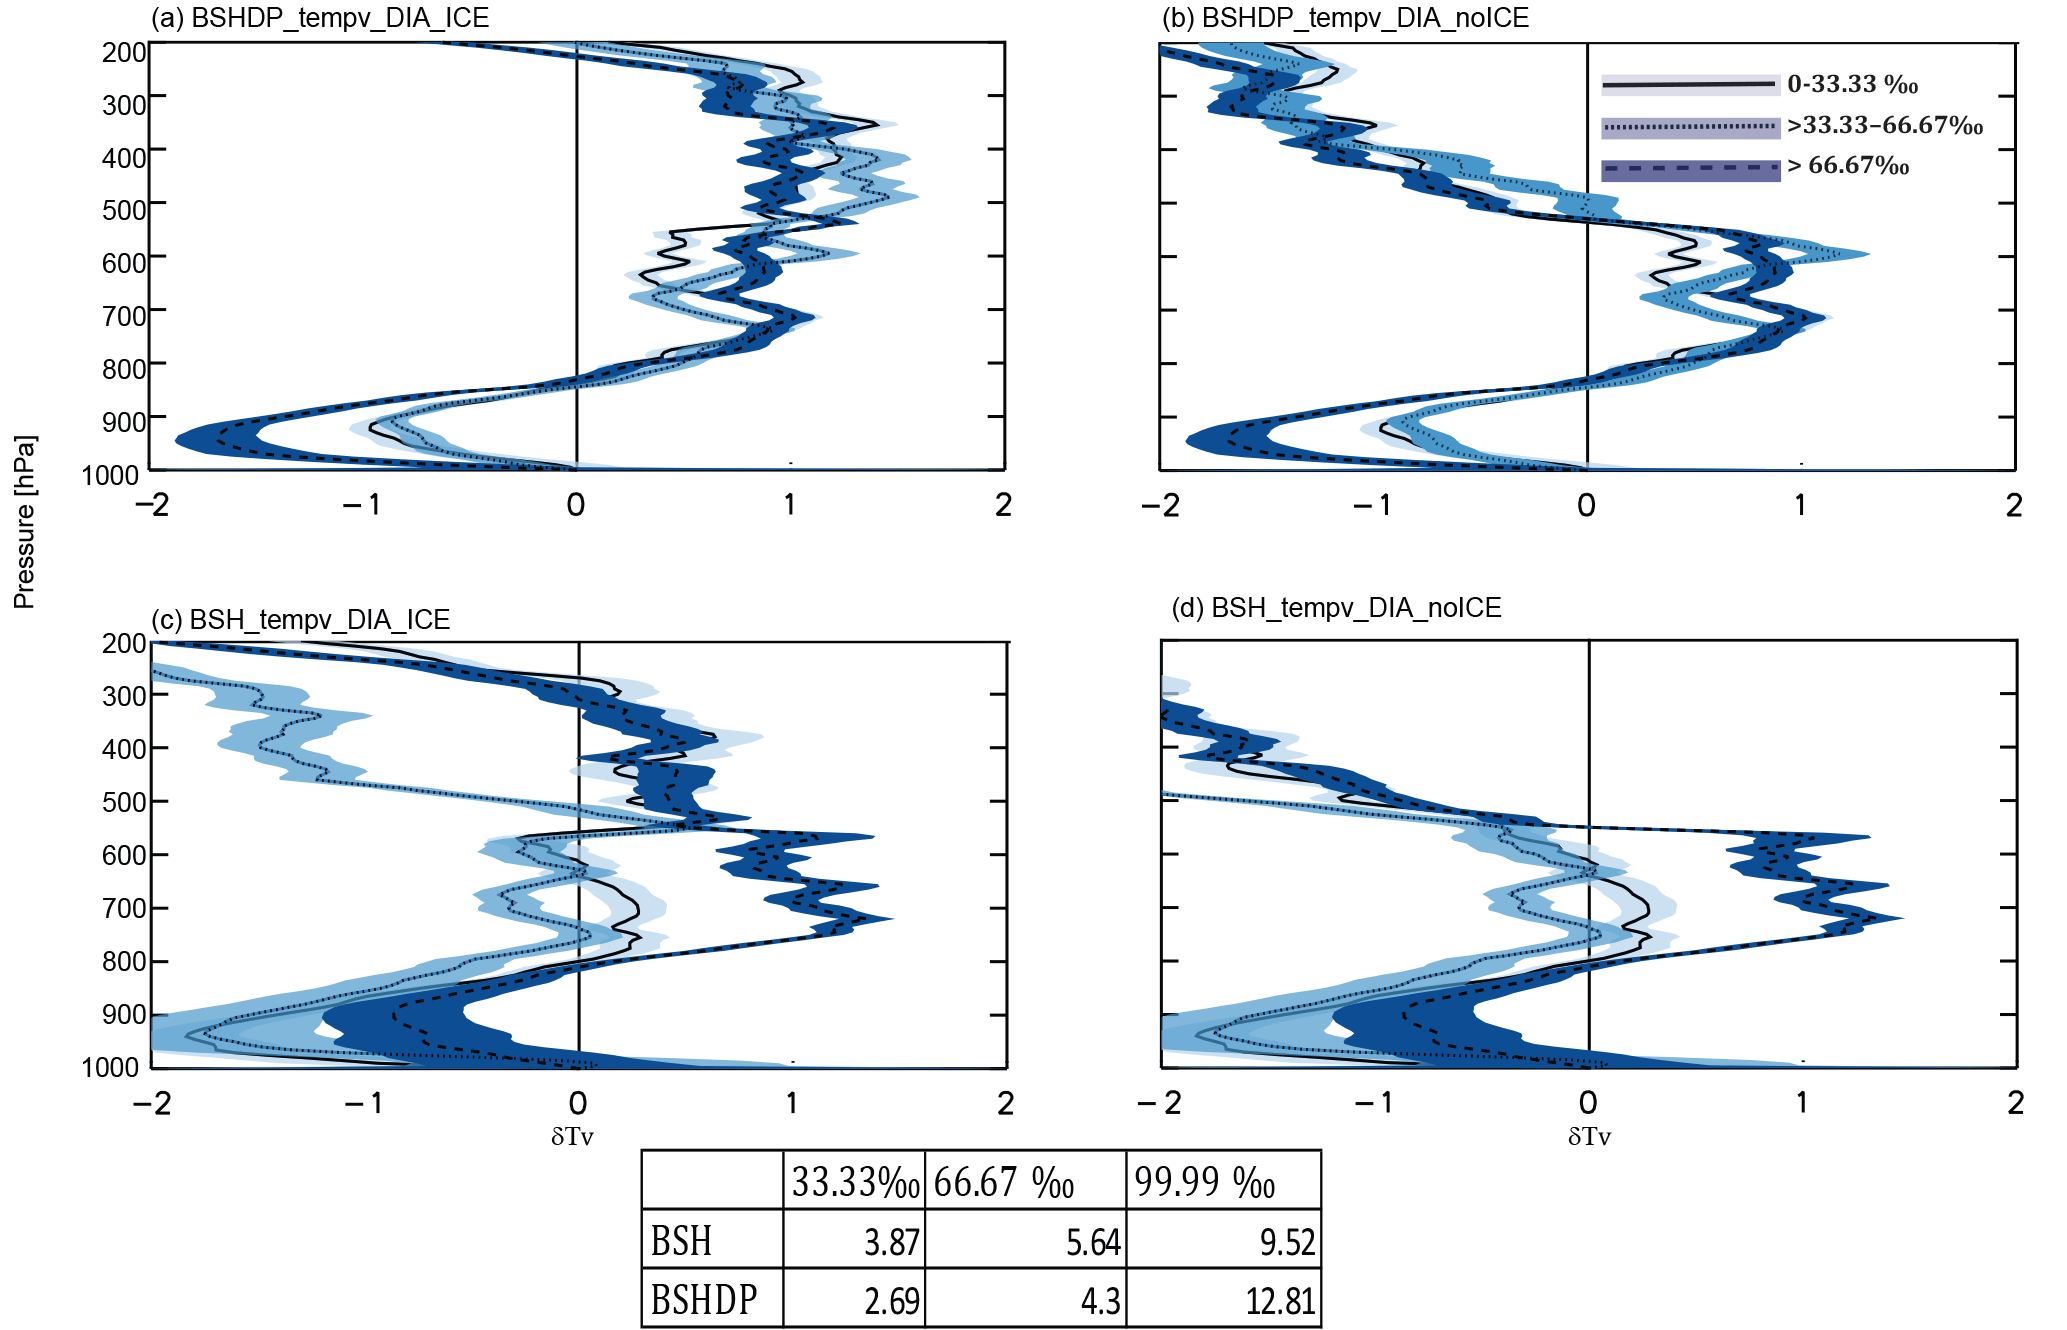
Figure 8Same as in Fig. 5, but for different percentile values of lower tropospheric VWS. Values of corresponding LVWS are shown in the table.
The role of aerosols is interesting to parse, especially because of the higher amount of CCN concentrations associated with the BSH conditions. Figure 9 shows that low (0–33.33 ‰) to moderate (33.33–66.67 ‰) CCN concentrations are associated with increased buoyancy above the freezing level for the BSHDP cases than in conditions of heavy CCN (> 66.67 ‰, Fig. 9a). However, such an influence is not observed at altitudes below the freezing level and for BSH conditions (Fig. 9c) or when we do not consider freezing in our buoyancy computations (Fig. 9b and d). In Fig. 9a, the indirect effects of controlling for CCN on buoyancy above the freezing level are notable, with the thermodynamic conditions becoming less favorable for deep convection with increasing CCN. It is thus possible that higher CCN concentrations modify the thermodynamic environment such that they disfavor deep convective development, even among deep convective cases. The caveat should be noted that the results could instead imply an association of high CCN concentrations with other factors that modify the thermodynamic environment in this way. It is important to note that for roughly the same CCN concentrations in the middle tercile, the buoyancy profiles for BSH and BSHDP cases are starkly different above the freezing level. Therefore, though CCN are associated with modification of the thermodynamic environment, an effect on the buoyancy of convective plumes, this suggests that other more dominant variables provide leading controls on the transition to deep convection (e.g., humidity). It is thus of interest to consider covariability between humidity and the dynamical and microphysical variables analyzed.
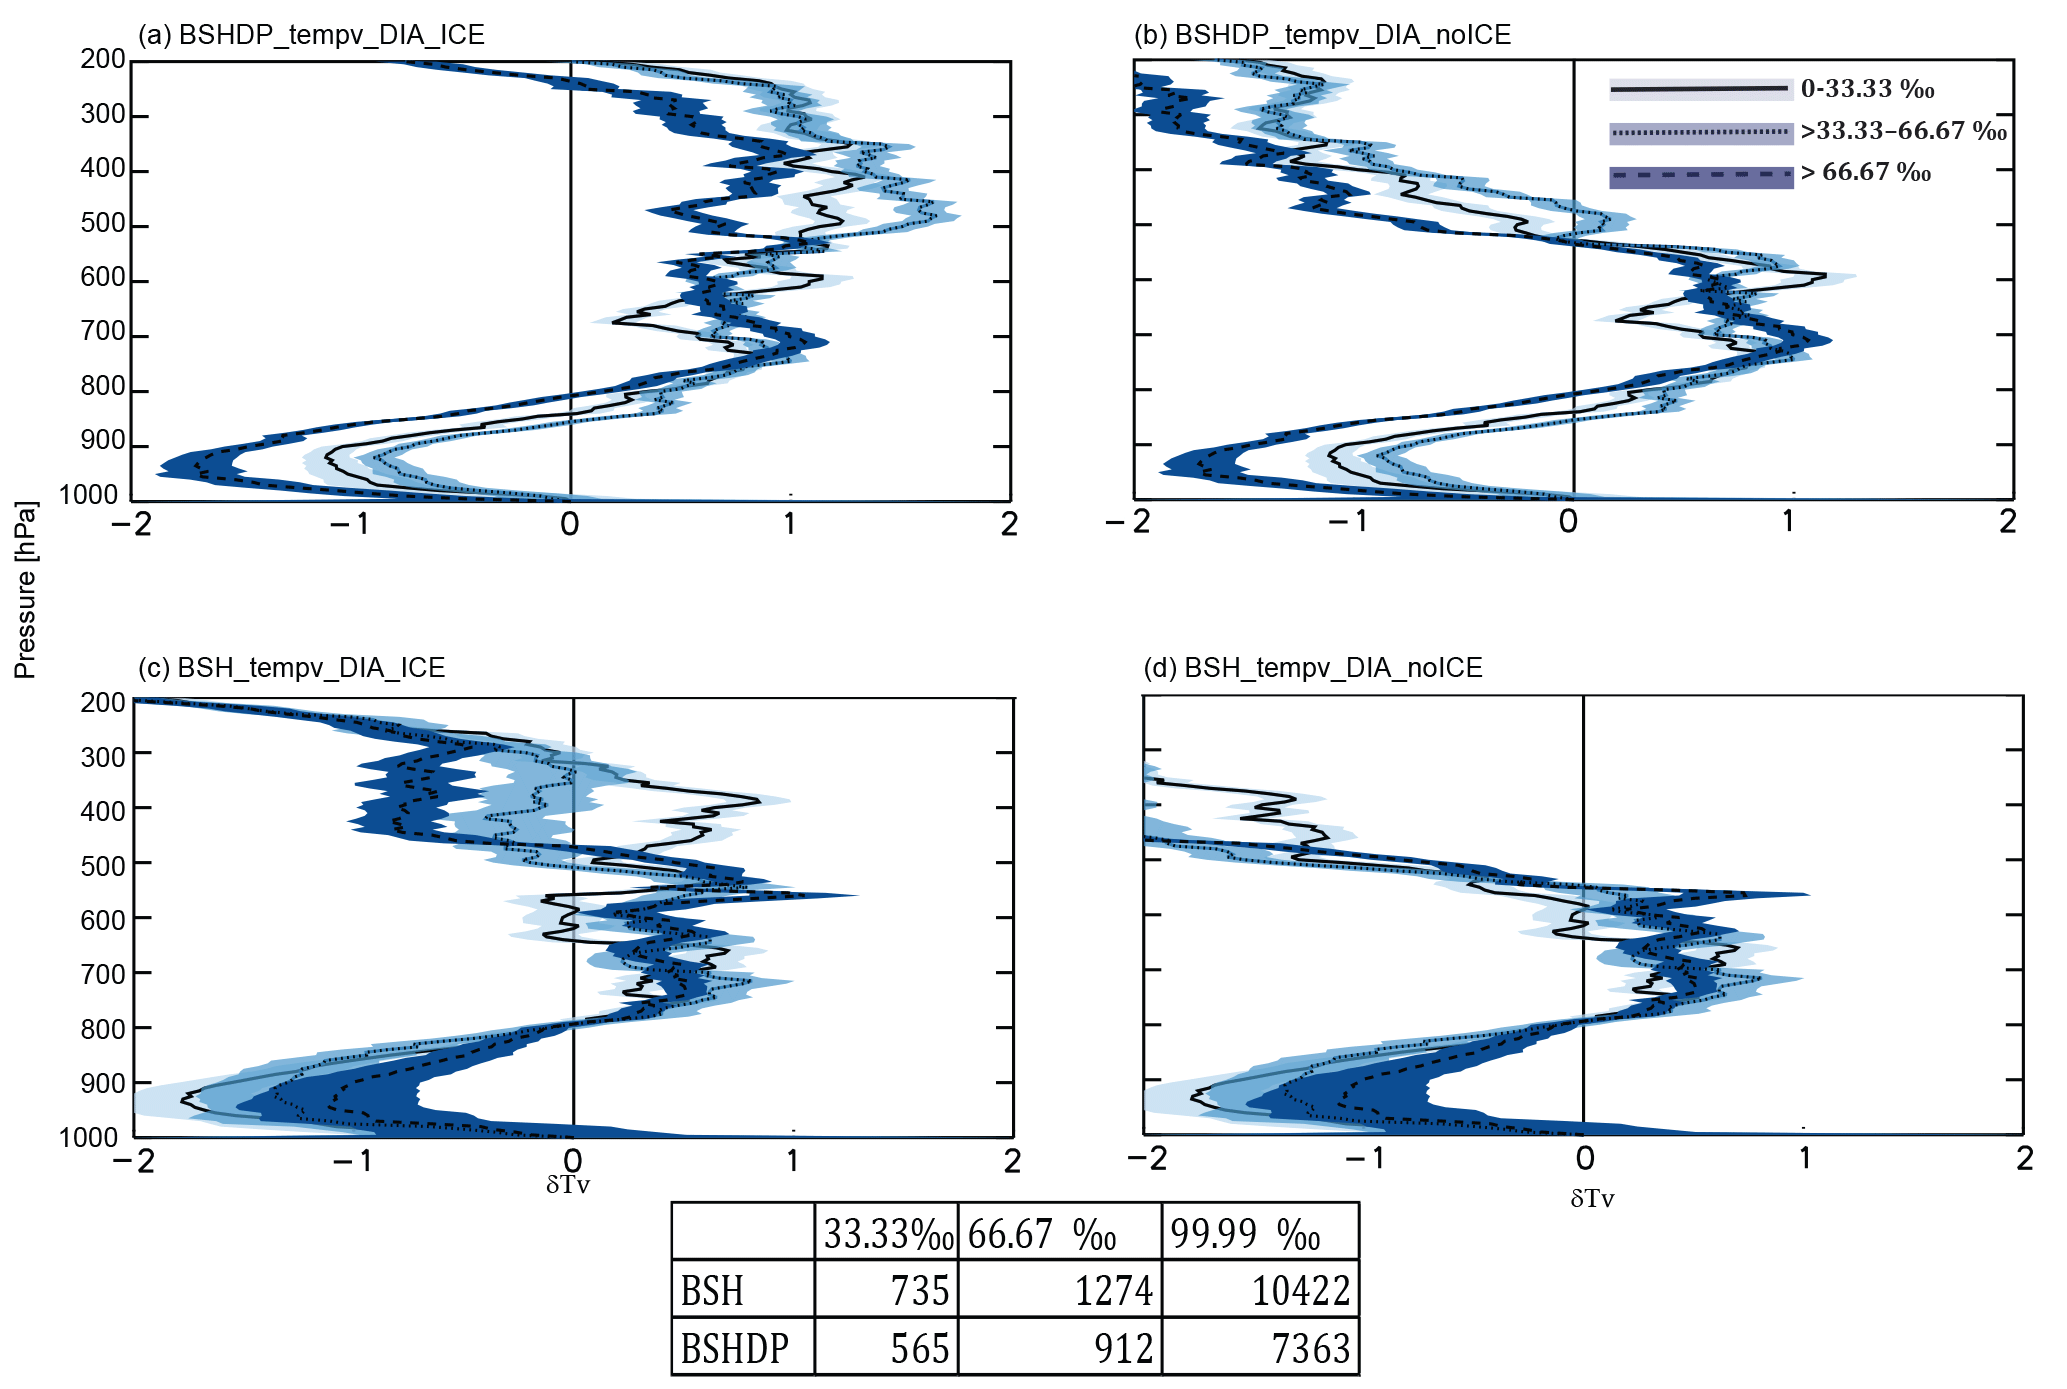
Figure 9Same as in Fig. 5, but for different percentile values of CCN concentration. Values of corresponding CCN concentrations are shown in the table.

Figure 10Contours of conditional probability (%) of (a, c, e) BSHDP as well as SHDP and (b, d, f) BSH as well as SH conditions with respect to (a), (b) FTRH and CCN concentrations, (c, d) FTRH and DVWS, and (e, f) FTRH and LVWS. Conditional probability of these conditions occurring in a given bin are estimated by dividing the number of samples of BSDHP and SHDP (or BSH and SH) conditions by the total number of samples in that bin. Blank areas correspond to bins for which neither shallow-to-deep nor shallow clouds are observed or total number of samples in that bin is less than 5. Total number of samples of BSHDP we well as SHDP, BSH as well as SH, and all the conditions (including clear sky) are 71, 49, and 565, respectively.
In Fig. 10 we calculate the conditional probability of occurrence of these conditions in the given bin (number of samples of BSHDP and SHDP (or BSH and SH) divided by the total number of samples in a bin, in percentage) of both BSHDP and SHDP (during shallow-to-deep transitions) and BSH and SH (during shallow convection) conditions with respect to humidity and CCN concentrations. Values are shown only if the total number of samples in a bin is greater than 5. Figure 10a shows that BSHDP and SHDP conditions occur predominantly above 80 % FTRH. However, BSH and SH conditions (Fig. 10b, d, and f) occur most frequently at lower values of FTRH with a peak probability of occurrences between 40 and 60 % FTRH. Figure 10a shows that BSHDP and SHDP conditions occur at high FTRH and low-to-moderate (below the 67th percentile, i.e., 0–1200 cm−3) values of CCN concentrations. High CCN concentrations (> 1200 cm−3) (Rosenfeld et al., 2008) and low RH (< 60 %) correspond to probabilities below 20 %. For BSH and SH conditions (Fig. 10b), such occurrences are associated with a relatively dry (40–70 % FTRH) environment with optimal CCN concentrations ranging from 400 to 2000 cm−3. This suggests that low-to-moderate concentrations of CCN and high humidity are associated with deep convection. This association is in part qualitatively consistent with the hypothesis that high CCN concentration can reduce the vigor of the convection by reducing the effect of convective available potential energy (Rosenfeld et al., 2008). Quantitatively, it should be noted that the CCN values corresponding to strong precipitation are lower than the 1200 cm−3 optimum for convective available potential energy release illustrated in their buoyancy estimates. Figure 10 also has the strongest association of BSHDP and SHDP conditions with the lowest CCN concentrations; i.e., we do not detect a reduction at very low values with the data here. Low-to-moderate RH is not suitable for deep convective buoyancy, instead favoring shallow convective development (Figs. 1–2, 10b, d, f). These results also suggest that CCN tend to have higher concentrations during BSH conditions. This is potentially due to the drier environment: high aerosol concentrations owing to drier conditions can form large numbers of small CCN (Rosenfeld and Woodley, 2000) due to slower coagulation and coalescence; less wet deposition would also occur due to the smaller probability of precipitation.
Consistent with the buoyancy profiles in Figs. 7 and 8, the conditional probability of occurrence of BSHDP and SHDP also shows that VWS does not have strong impact on the shallow-to-deep convective evolution (Fig. 10c, e). Again, our results suggest that higher FTRH is a primary control in the shallow-to-deep transition. However, shallow convection can occur for intermediate values of FTRH (40–70 %). In such conditions, low values of DVWS (< 8 m s−1) and appreciable LVWS (4–12 m s−1) are associated with conditions favorable to the development of shallow clouds. This is consistent with increases in buoyancy observed in Figs. 7–8, though a range of conditions is depicted in Fig. 10d and f.
We have also calculated the conditional probability of occurrences of the BSHDP as well as SHDP as well as BSHD(SH) conditions during the wet season to provide information on shallow-to-deep convective evolution during the wet season (Supplement Fig. S2). In comparison, CCN concentrations are smaller during the wet season than the transition season, and it appears that humidity exerts the dominant control over CCN concentrations in the evolution from shallow-to-deep convection (Figs. S2a and b). We do not observe any increase in conditional probability of BSHDP events as CCN concentration increases during the wet season. BSHDP as well as SHDP events occur at higher relative humidity during the wet season (80–100 %, Fig. S3a, c, and e) than during the transition season (∼ 80 %, Fig. 10a, c, and e). Per the definitions of seasons adopted here, the sample size from the dry season (May–July) is too small to draw conclusions about the respective roles of CCN and VWS on the transition from shallow-to-deep convection.
This study employs a suite of ground-based measurements from the DOE ARM mobile facility in Manacapuru, Brazil, as part of the GOAmazon campaign to investigate associations between meteorological parameters and CCN concentrations on an entraining plume's buoyancy before the formation of shallow or deep convective clouds during the transition season. We use cloud radar and micropulse lidar datasets to identify shallow convection and shallow-to-deep convection transitions. Radiosonde profiles measure wind speed and thermodynamic conditions up to 2 h before shallow convection develops, and the aerosol observing system measures CCN number concentrations. Composites of CCN concentration, centered at the time of radiosonde launch, give some indication of the association between aerosols and other thermodynamic variables, and how these variables precondition the environment differently for shallow and deep convection.
Our results show that BSHDP conditions are associated with significantly higher mixing ratio perturbations and relative humidity above 800 hPa during the transition season compared to clear sky conditions. Such a humid free troposphere before the development of shallow-only clouds is not observed. Buoyancy increases as FTRH and BLRH increase for BSHDP conditions. BSH plumes are less buoyant than BSHDP parcels owing to the fact that they occur in less humid environments. Differences in the preconvective humidity between the BSHDP and BSH conditions are largest during the transition season compared to the dry and the wet seasons. These results suggest that moistening of the free troposphere is a necessary prerequisite for the development of deep convection.
Excluding the buoyancy effects of freezing above the 0 ∘C isotherm, the buoyancy is insufficient for deep convective development, emphasizing the importance of freezing microphysics on the shallow-to-deep convective transition. This confirms and quantifies the potential for impacts on buoyancy by aerosol pathways operating via the freezing microphysics (Rosenfeld et al., 2008) in the presence of an important modification – the inclusion of sufficient entrainment to give a realistic dependence on free tropospheric water vapor. Furthermore, it confirms this potential in the range of thermodynamic environments relevant to the onset of deep convection in the Amazon.
It is difficult to tease out a relation between dynamical and microphysical properties and the conditional instability of the environment using plume buoyancies alone, but associations can provide some indication of the favored environments for both shallow and deep convection. Vertical wind shear does not appear to play a significant role in determining prethermodynamic conditions for the shallow-to-deep convective transition. However, a strong (weak) LVWS (DVWS) appears to be related to the development of shallow convection that does not evolve to deep convection. It is possible that this could be a causal influence of VWS, for example through the entrainment process: if increased entrainment of dry air occurred due to a strong LVWS, it would tend to limit the development of deep convection. However, it could simply be a noncausal association of conditions leading to shallow convection with those leading to strong low-level shear. Moreover, CCN might play a different role during the transition from congestus to deep convective evolution as shown by Sheffield et al. (2015) using the Regional Atmospheric Modeling System. Their study shows that congestus clouds in polluted conditions are associated with greater ice mass and strong updraft speed, unlike the shallow-to-deep transition cases when CCN concentrations in the upper tercile reduce the convective buoyancy. It appears that condensate reaching the freezing level is more important for congestus-to-deep convective evolution than the association of the condensate loading effect for shallow-to-deep evolution. Congestus clouds moisten the atmosphere, reach higher altitudes than shallow clouds, and often reach beyond the freezing level to develop into deep convection. Thus, analyses of congestus-to-deep convective transitions using observational datasets are needed to understand how such evolution differs from the shallow-to-deep convective evolution discussed here.
CCN are thought to have complex interactions with deep convection, including through their effects on delayed rainout of small drops, latent heating associated with freezing microphysics, and droplet evaporation. In our analysis, the probability of deep convection is greatest in association with low-to-moderate CCN concentrations (as defined through percentiles for the observed conditions) and high relative humidity. This is qualitatively consistent with previous findings that suggest that aerosol microphysical effects tending to invigorate deep convective clouds saturate and reverse as CCN concentration increases beyond ∼1200 cm−3 (Rosenfeld et al., 2008). Corresponding effects on cloud fraction have been suggested over the Amazon (Koren et al., 2008) for aerosol optical depth about 0.25. Higher CCN concentrations have been proposed to slow down the autoconversion process, on the one hand potentially permitting more condensate to reach the freezing level, but on the other adding to condensate loading with the maximum set by competing effects on the buoyancy for deep convection (Rosenfeld et al., 2008). The condensate loading effect of higher concentrations of CCN might inhibit the evolution of the shallow convections into deeper convection, reducing the possibility of deep convective transition. Our analysis shows that a higher concentration of CCN in a dry environment is associated with BSH conditions (Fig. 4).
By these mechanisms, VWS and aerosols can potentially contribute to favorable (or unfavorable) conditions for deep convective evolutions. However, conditional instability for such developments primarily depends on humidity and the role of aerosols and VWS warrants further investigations. A caveat quantified here that does not seem to have been taken into account in other studies is that data stratified by conditions on aerosol or VWS concentrations can have substantial relationships with buoyancy that arise entirely from the thermodynamic environment. When making inferences about aerosol impacts using techniques that seek relationships between cloud or precipitation properties, we recommend controlling for, or at least quantifying, such covariability.
This study advances our capability to understand how some shallow convection evolves to deep convection and under what meteorological parameters and CCN concentrations such evolutions are favorable during the transition season over the Amazon. High FTRH and BLRH are required for a shallow-to-deep convective evolution during the transition season, which is associated with low-to-moderate concentrations of CCN. Deep convection appears unrelated to vertical wind shear in the transition season, whereas shallow convection has a weak association to strong LVWS and weak DVWS. It is worth noting that the results of this study may differ across different regions. Use of different ACRIDICON-CHUVA datasets to test consistency with the southern Amazon, which is more prone to drought conditions, could prove to be a useful comparison.
All the data sets and the code for entrainment scheme calculation are available upon request.
The supplement related to this article is available online at: https://doi.org/10.5194/acp-18-11135-2018-supplement.
SC, KAS, RF, and JDF designed the research. KAS and SC performed the analysis. SC, KAS, RF, and JDF wrote the paper.
The authors declare that they have no conflict of interest.
This article is part of the special issue “Observations and Modeling of the Green Ocean Amazon (GoAmazon2014/5) (ACP/AMT/GI/GMD inter-journal SI)”. It is not associated with a conference.
This research was supported by the Office of Biological & Environmental
Research within the Department of Energy (DOE), Office of Science,
(DE-SC0011117 and DE-SC0011074). J. David Neelin and Kathleen A. Schiro
were also supported under National Science Foundation grant AGS-1505198 and
National Oceanic and Atmospheric Administration grant NA14OAR4310274. We
acknowledge the providers of the DOE ARM datasets.
Edited by: Maria Assuncao Silva Dias
Reviewed
by: two anonymous referees
Andreae, M. O., Rosenfeld, D., Artaxo, P., Costa, A. A., Frank, G. P., Longo, K. M., and Silva-Dias, M. A. F.: Smoking rain clouds over the Amazon, Science, 303, 1337–1342, https://doi.org/10.1126/science.1092779, 2004.
Atmospheric Radiation Measurement (ARM) Climate Research Facility: updated hourly, W-Band (95 GHz) ARM Cloud Radar (WACR), 2014-03-02 to 2015-11-30, ARM Mobile Facility (MAO) Manacapuru, Amazonas, Brazil; AMF1 (M1), compiled by: Matthews, A., Isom, B., Nelson, D., Lindenmaier, I., Hardin, J., Johnson, K., and Bharadwaj, N., Atmospheric Radiation Measurement (ARM) Climate Research Facility Data Archive, Oak Ridge, Tennessee, USA, Data set accessed on 8 August 2017 at: https://doi.org/10.5439/1025317, 2014.
Atmospheric Radiation Measurement (ARM) Climate Research Facility: updated hourly, Cloud mask from Micropulse Lidar (30SMPLCMASK1ZWANG), 2013-03-02 to 2015-11-30, ARM Mobile Facility (MAO) Manacapuru, Amazonas, Brazil; AMF1 (M1), compiled by: Sivaraman, C. and Riihimaki, L., Atmospheric Radiation Measurement (ARM) Climate Research Facility Data Archive, Oak Ridge, Tennessee, USA, Data set accessed on 8 August 2017 at: https://doi.org/10.5439/1027736, 2015a.
Atmospheric Radiation Measurement (ARM) Climate Research Facility: updated hourly, Balloon-Borne Sounding System (SONDEWNPN), 2014-03-02 to 2015-11-30, ARM Mobile Facility (MAO) Manacapuru, Amazonas, Brazil; AMF1 (M1), compiled by: Holdridge, D., Kyrouac, J., and Coulter, R., Atmospheric Radiation Measurement (ARM) Climate Research Facility Data Archive, Oak Ridge, Tennessee, USA, Data set accessed at: https://doi.org/10.5439/1021460, 2015b.
Atmospheric Radiation Measurement (ARM) Climate Research Facility: updated hourly, Meteorological Measurements associated with the Aerosol Observing System (AOSMET), 2014-03-02 to 2015-11-30, ARM Mobile Facility (MAO) Manacapuru, Amazonas, Brazil; MAOS (S1), compiled by: Koontz, A., Kyrouac, J., and Springston, S.: Atmospheric Radiation Measurement (ARM) Climate Research Facility Data Archive, Oak Ridge, Tennessee, USA, Data set accessed at: https://doi.org/10.5439/1025153, 2015c.
Betts, A. K.: The parameterization of deep convection, Nato Adv. Sci. I. C-Mat., 505, 255–279, 1997.
Chakraborty, S., Fu, R., Massie, S. T., and Stephens, G.: Relative influence of meteorological conditions and aerosols on the lifetime of mesoscale convective systems, P. Natl. Acad. Sci. USA, 113, 7426–7431, https://doi.org/10.1073/pnas.1601935113, 2016.
Collow, A. B. M., Miller, M. A., and Trabachino, L. C.: Cloudiness over the Amazon rainforest: Meteorology and thermodynamics, J. Geophys. Res.-Atmos., 121, 7990–8005, https://doi.org/10.1002/2016JD024848, 2016.
Del Genio, A. D. and Wu, J. B.: The Role of Entrainment in the Diurnal Cycle of Continental Convection, J. Climate, 23, 2722–2738, https://doi.org/10.1175/2009JCLI3340.1, 2010.
Harrison, S. J.: Fundamentals of Weather and Climate – Mcilveen, R, Scot. Geogr. Mag., 108, 133–133, 1992.
Holloway, C. E. and Neelin, J. D.: Moisture Vertical Structure, Column Water Vapor, and Tropical Deep Convection, J. Atmos. Sci., 66, 1665–1683, https://doi.org/10.1175/2008JAS2806.1, 2009.
Houze, R. A.: Mesoscale convective systems, Rev. Geophys., 42, Rg4003, https://doi.org/10.1029/2004rg000150, 2004.
Houze, R. A., Rasmussen, K. L., Zuluaga, M. D., and Brodzik, S. R.: The variable nature of convection in the tropics and subtropics: A legacy of 16years of the Tropical Rainfall Measuring Mission satellite, Rev. Geophys., 53, 994–1021, https://doi.org/10.1002/2015rg000488, 2015.
Jensen, M. P. and Del Genio, A. D.: Factors limiting convective cloud-top height at the ARM Nauru Island climate research facility, J. Climate, 19, 2105–2117, https://doi.org/10.1175/Jcli3722.1, 2006.
Kilroy, G., Smith, R. K., and Wissmeier, U.: Tropical convection: the effects of ambient vertical and horizontal vorticity, Q. J. Roy. Meteor. Soc., 140, 1756–1770, https://doi.org/10.1002/qj.2261, 2014.
Koren, I., Martins, J. V., Remer, L. A., and Afargan, H.: Smoke Invigoration Versus Inhibition of Clouds over the Amazon, Science, 321, 946–949, https://doi.org/10.1126/science.1159185, 2008.
Koren, I., Remer, L. A., Altaratz, O., Martins, J. V., and Davidi, A.: Aerosol-induced changes of convective cloud anvils produce strong climate warming, Atmos. Chem. Phys., 10, 5001–5010, https://doi.org/10.5194/acp-10-5001-2010, 2010.
Kumar, V. V., Jakob, C., Protat, A., May, P. T., and Davies, L.: The four cumulus cloud modes and their progression during rainfall events: A C-band polarimetric radar perspective, J. Geophys. Res.-Atmos., 118, 8375–8389, https://doi.org/10.1002/jgrd.50640, 2013.
Li, W. H., Fu, R., and Dickinson, R. E.: Rainfall and its seasonality over the Amazon in the 21st century as assessed by the coupled models for the IPCC AR4, J. Geophys. Res.-Atmos., 111, D02111, https://doi.org/10.1029/2005jd006355, 2006.
Lin, B., Wielicki, B. A., Minnis, P., Chambers, L., Xu, K.-M., Hu, Y., and Fan, A.: The Effect of Environmental Conditions on Tropical Deep Convective Systems Observed from the TRMM Satellite, J. Climate, 19, 5745–5761, https://doi.org/10.1175/jcli3940.1, 2006.
Moncrieff, M. W.: Dynamical Structure of 2-Dimensional Steady Convection in Constant Vertical Shear, Q. J. Roy. Meteor. Soc., 104, 543–567, 1978.
Petersen, W. A., Fu, R., Chen, M. X., and Blakeslee, R.: Intraseasonal forcing of convection and lightning activity in the southern Amazon as a function of cross-equatorial flow, J. Climate, 19, 3180–3196, https://doi.org/10.1175/Jcli3788.1, 2006.
Rosenfeld, D. and Woodley, W. L.: Deep convective clouds with sustained supercooled liquid water down to-37.5 degrees C, Nature, 405, 440–442, https://doi.org/10.1038/35013030, 2000.
Rosenfeld, D., Lohmann, U., Raga, G. B., O'Dowd, C. D., Kulmala, M., Fuzzi, S., Reissell, A., and Andreae, M. O.: Flood or drought: How do aerosols affect precipitation?, Science, 321, 1309–1313, https://doi.org/10.1126/science.1160606, 2008.
Schiro, K. A., Neelin, J. D., Adams, D. K., and Lintner, B. R.: Deep Convection and Column Water Vapor over Tropical Land versus Tropical Ocean: A Comparison between the Amazon and the Tropical Western Pacific, J. Atmos. Sci., 73, 4043–4063, https://doi.org/10.1175/Jas-D-16-0119.1, 2016.
Schumacher, C., Houze, R. A., and Kraucunas, I.: The tropical dynamical response to latent heating estimates derived from the TRMM precipitation radar, J. Atmos. Sci., 61, 1341–1358, https://doi.org/10.1175/1520-0469(2004)061<1341:Ttdrtl>2.0.Co;2, 2004.
Sheffield, A. M., Saleeby, S. M., and van den Heever, S. C.: Aerosol-induced mechanisms for cumulus congestus growth, J. Geophys. Res.-Atmos., 120, 8941–8952, https://doi.org/10.1002/2015jd023743, 2015.
Sherwood, S. C., Minnis, P., and McGill, M.: Deep convective cloud-top heights and their thermodynamic control during CRYSTAL-FACE, J. Geophys. Res.-Atmos., 109, D20119, https://doi.org/10.1029/2004jd004811, 2004.
Siebesma, A. P., Soares, P. M. M., and Teixeira, J.: A combined eddy-diffusivity mass-flux approach for the convective boundary layer, J. Atmos. Sci., 64, 1230–1248, https://doi.org/10.1175/Jas3888.1, 2007.
Vera, C., Silvestri, G., Liebmann, B., and Gonzalez, P.: Climate change scenarios for seasonal precipitation in South America from IPCC-AR4 models, Geophys. Res. Lett., 33, L13707, https://doi.org/10.1029/2006gl025759, 2006.
Waite, M. L. and Khouider, B.: The Deepening of Tropical Convection by Congestus Preconditioning, J. Atmos. Sci., 67, 2601–2615, https://doi.org/10.1175/2010JAS3357.1, 2010.
Wang, Z. and Sassen, K.: Cloud Type and Macrophysical Property Retrieval Using Multiple Remote Sensors, J. Appl. Meteorol., 40, 1665–1682, 2001.
Wang, Z. and Sassen, K.: Level 2 Cloud Scenario Classification Product Process Description and Interface Control Document, Cloudsat Project, 5, 50, 2007.
Weisman, M. L. and Rotunno, R.: The use of vertical wind shear versus helicity in interpreting supercell dynamics, J. Atmos. Sci., 57, 1452–1472, https://doi.org/10.1175/1520-0469(2000)057<1452:Tuovws>2.0.Co;2, 2000.
Weisman, M. L. and Rotunno, R.: “A theory for strong long-lived squall lines” revisited, J. Atmos. Sci., 61, 361–382, https://doi.org/10.1175/1520-0469(2004)061<0361:Atfsls>2.0.Co;2, 2004.
Wright, J. S., Fu, R., Worden, J. R., Chakraborty, S., Clinton, N. E., Risi, C., Sun, Y., and Yin, L.: Rainforest-initiated wet season onset over the southern Amazon, P. Natl. Acad. Sci. USA, 114, 8481–8486, https://doi.org/10.1073/pnas.1621516114, 2017.
Wu, P., Dong, X. Q., Xi, B. K., Liu, Y. G., Thieman, M., and Minnis, P.: Effects of environment forcing on marine boundary layer cloud-drizzle processes, J. Geophys. Res.-Atmos., 122, 4463–4478, https://doi.org/10.1002/2016jd026326, 2017.
Yin, L., Fu, R., Zhang, Y. F., Arias, P. A., Fernando, D. N., Li, W. H., Fernandes, K., and Bowerman, A. R.: What controls the interannual variation of the wet season onsets over the Amazon?, J. Geophys. Res.-Atmos., 119, 2314–2328, https://doi.org/10.1002/2013jd021349, 2014.
Yu, H., Kaufman, Y. J., Chin, M., Feingold, G., Remer, L. A., Anderson, T. L., Balkanski, Y., Bellouin, N., Boucher, O., Christopher, S., DeCola, P., Kahn, R., Koch, D., Loeb, N., Reddy, M. S., Schulz, M., Takemura, T., and Zhou, M.: A review of measurement-based assessments of the aerosol direct radiative effect and forcing, Atmos. Chem. Phys., 6, 613–666, https://doi.org/10.5194/acp-6-613-2006, 2006.
Zhang, Y. Y. and Klein, S. A.: Mechanisms Affecting the Transition from Shallow to Deep Convection over Land: Inferences from Observations of the Diurnal Cycle Collected at the ARM Southern Great Plains Site, J. Atmos. Sci., 67, 2943–2959, https://doi.org/10.1175/2010JAS3366.1, 2010.
Zhuang, Y. Z., Fu, R., Marengo, J. A., and Wang, H. Q.: Seasonal variation of shallow-to-deep convection transition and its link to the environmental conditions over the Central Amazon, J. Geophys. Res.-Atmos., 122, 2649–2666, https://doi.org/10.1002/2016jd025993, 2017.