the Creative Commons Attribution 4.0 License.
the Creative Commons Attribution 4.0 License.
 | 23 Jul 2018
HTAP2 multi-model estimates of premature human mortality due to intercontinental transport of air pollution and emission sectors
Ciao-Kai Liang
Raquel A. Silva
Huisheng Bian
Mian Chin
Yanko Davila
Frank J. Dentener
Louisa Emmons
Johannes Flemming
Gerd Folberth
Daven Henze
Jan Eiof Jonson
Terry J. Keating
Tom Kucsera
Allen Lenzen
Meiyun Lin
Marianne Tronstad Lund
Xiaohua Pan
Rokjin J. Park
R. Bradley Pierce
Takashi Sekiya
Kengo Sudo
Toshihiko Takemura
Ambient air pollution from ozone and fine particulate matter is associated with premature mortality. As emissions from one continent influence air quality over others, changes in emissions can also influence human health on other continents. We estimate global air-pollution-related premature mortality from exposure to PM2.5 and ozone and the avoided deaths due to 20 % anthropogenic emission reductions from six source regions, North America (NAM), Europe (EUR), South Asia (SAS), East Asia (EAS), Russia–Belarus–Ukraine (RBU), and the Middle East (MDE), three global emission sectors, power and industry (PIN), ground transportation (TRN), and residential (RES), and one global domain (GLO), using an ensemble of global chemical transport model simulations coordinated by the second phase of the Task Force on Hemispheric Transport of Air Pollutants (TF HTAP2), and epidemiologically derived concentration response functions. We build on results from previous studies of TF HTAP by using improved atmospheric models driven by new estimates of 2010 anthropogenic emissions (excluding methane), with more source and receptor regions, new consideration of source sector impacts, and new epidemiological mortality functions. We estimate 290 000 (95 % confidence interval (CI): 30 000, 600 000) premature O3-related deaths and 2.8 million (0.5 million, 4.6 million) PM2.5-related premature deaths globally for the baseline year 2010. While 20 % emission reductions from one region generally lead to more avoided deaths within the source region than outside, reducing emissions from MDE and RBU can avoid more O3-related deaths outside of these regions than within, and reducing MDE emissions also avoids more PM2.5-related deaths outside of MDE than within. Our findings that most avoided O3-related deaths from emission reductions in NAM and EUR occur outside of those regions contrast with those of previous studies, while estimates of PM2.5-related deaths from NAM, EUR, SAS, and EAS emission reductions agree well. In addition, EUR, MDE, and RBU have more avoided O3-related deaths from reducing foreign emissions than from domestic reductions. For six regional emission reductions, the total avoided extra-regional mortality is estimated as 6000 (−3400, 15 500) deaths per year and 25 100 (8200, 35 800) deaths per year through changes in O3 and PM2.5, respectively. Interregional transport of air pollutants leads to more deaths through changes in PM2.5 than in O3, even though O3 is transported more on interregional scales, since PM2.5 has a stronger influence on mortality. For NAM and EUR, our estimates of avoided mortality from regional and extra-regional emission reductions are comparable to those estimated by regional models for these same experiments. In sectoral emission reductions, TRN emissions account for the greatest fraction (26–53 % of global emission reduction) of O3-related premature deaths in most regions, in agreement with previous studies, except for EAS (58 %) and RBU (38 %) where PIN emissions dominate. In contrast, PIN emission reductions have the greatest fraction (38–78 % of global emission reduction) of PM2.5-related deaths in most regions, except for SAS (45 %) where RES emission dominates, which differs with previous studies in which RES emissions dominate global health impacts. The spread of air pollutant concentration changes across models contributes most to the overall uncertainty in estimated avoided deaths, highlighting the uncertainty in results based on a single model. Despite uncertainties, the health benefits of reduced intercontinental air pollution transport suggest that international cooperation may be desirable to mitigate pollution transported over long distances.
Please read the corrigendum first before continuing.
-
Notice on corrigendum
The requested paper has a corresponding corrigendum published. Please read the corrigendum first before downloading the article.
-
Article
(14155 KB)
- Corrigendum
-
Supplement
(6975 KB)
-
The requested paper has a corresponding corrigendum published. Please read the corrigendum first before downloading the article.
- Article
(14155 KB) - Corrigendum
-
Supplement
(6975 KB) - BibTeX
- EndNote


Ozone (O3) and fine particulate matter with an aerodynamic diameter of less than 2.5 µm (PM2.5) are two common air pollutants with known adverse health effects. Epidemiological studies have shown that both short-term and long-term exposures to O3 and PM2.5 are associated with elevated rates of premature mortality. Short-term exposure to O3 is associated with respiratory morbidity and mortality (Bell et al., 2005, 2014; Gryparis et al., 2004; Ito et al., 2005; Levy et al., 2005; Stieb et al., 2009) while long-term exposure to O3 has been associated with premature respiratory mortality (Jerrett et al., 2009; Turner et al., 2016). Short-term exposure to PM2.5 has been associated with increases in daily mortality rates from all natural causes, and specifically from respiratory and cardiovascular causes (Bell et al., 2014; Du et al., 2016; Powell et al., 2015; Pope et al., 2011), while long-term exposure to PM2.5 can have detrimental chronic health effects, including premature mortality due to cardiopulmonary diseases and lung cancer (Brook et al., 2010; Burnett et al., 2014; Hamra et al., 2014; Krewski et al., 2009; Lepeule et al., 2012; Lim et al., 2012). The Global Burden of Disease Study 2015 (GBD 2015) estimated 254 000 deaths per year associated with ambient O3 and 4.2 million associated with ambient PM2.5 (Cohen et al., 2017). A comparable study using output from an ensemble of global chemistry–climate models estimated 470 000 deaths per year associated with O3 and 2.1 million premature deaths per year associated with anthropogenic PM2.5 (Silva et al., 2013). These differences in GBD estimates result mainly from differences in concentration response functions and estimates of pollutant concentrations.
Numerous observational and modeling studies have shown that anthropogenic emissions can affect O3 and PM2.5 concentrations across continents (Dentener et al., 2010; Heald et al., 2006; Leibensperger et al., 2011; Lin et al., 2012, 2017; Liu et al., 2009a; West et al., 2009a; Wild and Akimoto, 2001; Yu et al., 2008). As changes in emissions from one continent influence air quality over others, several studies have estimated the premature mortality from intercontinental transport (Anenberg et al., 2009, 2014; Bhalla et al., 2014; Duncan et al., 2008; Im et al., 2018; Liu et al., 2009b; West et al., 2009b; Zhang et al., 2017). In 2005, the Task Force on Hemispheric Transport of Air Pollutants (TF HTAP) was launched under the United Nations Economic Commission for Europe (UNECE) Convention on Long-Range Transboundary Air Pollution (LRTAP). One of its tasks is to investigate the impacts of emission reductions on the intercontinental transport of air pollution, air quality, health, ecosystem, and climate effects using a multi-model ensemble to quantify uncertainties due to differences among models (Anenberg et al., 2009, 2014; Fiore et al., 2009; Fry et al., 2012; Huang et al., 2017; Stjern et al., 2016; Yu et al., 2013).
In TF HTAP Phase 1 (TF HTAP1), human premature mortality due to 20 % anthropogenic emission reductions in four large source regions was investigated by Anenberg et al. (2009, 2014). They found that 20 % foreign O3 precursor emission reductions contribute approximately 30 to > 50 % of the deaths avoided by reducing precursor emissions in all four regions together (Anenberg et al., 2009). Similarly, reducing emissions in North America (NAM) and Europe (EUR) was found to avoid more O3-related premature deaths outside the source region than within (Anenberg et al., 2009), which agrees with other studies that together show for the first time that emission reductions in NAM and EUR have greater impacts on mortality outside the source region than within (Duncan et al., 2008; West et al., 2009b). In contrast, Anenberg et al. (2014) estimate that 93–97 % of PM2.5-related avoided deaths from reducing emissions in all four regions occur within the source region while 3–7 % occur outside the source region from transport among continents. Despite the longer atmospheric lifetime of O3 and its relatively larger scale of influence, PM2.5 was found to cause more deaths from intercontinental transport (Anenberg et al., 2009, 2014). These prior studies have consistently concluded that most avoided O3-related deaths from emission reductions in NAM and EUR occur outside of those regions, while most avoided PM2.5-related deaths occur within the regions. Similarly, an ensemble of regional models in the third phase of the Air Quality Model Evaluation International Initiative (AQMEII3) found that a 20 % decrease in emissions within the source region avoids 54 000 and 27 500 premature deaths in Europe and the US (from both O3 and PM2.5), while the reduction of foreign emissions alone avoids ∼ 1000 and 2000 premature deaths in Europe and the US (Im et al., 2018). Crippa et al. (2017) used the TM5-FASST reduced-form model with HTAP2 emissions to estimate a global sensitivity to 20 % emission reductions of PM2.5-related premature deaths of 401 000 globally, and 42 000 and 20 000 for Europe and the US, respectively.
In addition, several studies have evaluated the relative importance of individual emission sectors (Barrett et al., 2010; Bhalla et al., 2014; Chafe et al., 2014; Chambliss et al., 2014; Corbett et al., 2007) or multiple sectors (Lelieveld et al., 2015; Silva et al., 2016a) to ambient air-pollution-related premature mortality. Lelieveld et al. (2015) estimated that residential energy use such as for heating and cooking has the largest mortality impact globally (for PM2.5 and O3 mortality combined), particularly in South Asia (SAS) and East Asia (EAS). Silva et al. (2016) likewise found that residential and commercial emissions are most important for ambient PM2.5-related mortality, but they also found that land transportation had the greatest impact on O3-related mortality, particularly in NAM, South America, EUR, former Soviet Union (FSU), and the Middle East (MDE). Understanding the impact of different sectors on the global burden and the relative importance of each sector among regions can help stimulate international efforts and region-specific air pollution control strategies. Nevertheless, those studies were limited by using a single atmospheric model, reflecting a need to understand whether results differ among models and apportionment approaches.
In this study, we estimate the impacts of interregional transport and of source sector emissions on human premature mortality from O3 and PM2.5, using an ensemble of global chemical transport models coordinated by the Task Force on Hemispheric Transport of Air Pollutants Phase 2 (TF HTAP2) (Galmarini et al., 2017; Huang et al., 2017; Janssens-Maenhout et al., 2015; Stjern et al., 2016). Anthropogenic emissions were reduced by 20 % in six source regions, North America (NAM), Europe (EUR), South Asia (SAS), East Asia (EAS), Russia–Belarus–Ukraine (RBU), and the Middle East (MDE), three emission sectors, power and industry (PIN), ground transportation (TRN), and residential (RES), and one worldwide region (GLO). Human premature mortality due to these reductions is calculated using a health impact function based on a log-linear model for O3 (Jerrett et al., 2009) and an integrated exposure–response (IER) model for PM2.5 (Burnett et al., 2014), within the six source regions and elsewhere in the world. We conduct a Monte Carlo simulation to estimate the overall uncertainty due to uncertainties in relative risk, air pollutant concentrations (given by the spread of results among different models), and baseline mortality rates.
2.1 Modeled O3 and PM2.5 surface concentration
Global numerical modeling experiments initiated by TF HTAP2, the regional experiments by the Air Quality Model Evaluation International Initiative (AQMEII) over EUR and NAM, and the Model Intercomparison Study-Asia (MICS-Asia) were coordinated to perform consistent emission perturbation modeling experiments across the global, hemispheric, and continental/regional scales (Galmarini et al., 2017). Simulation periods, meteorology, emission inventories, boundary conditions, and model output are also consistent. The Joint Research Centre's (JRC) EDGAR (Emission Data Base for Global Research) team in collaboration with regional emission experts from the U.S. Environmental Protection Agency (US EPA), European Monitoring and Evaluation Programme (EMEP), Centre on Emission Inventories and Projections (CEIP), Netherlands Organization for Applied Scientific Research (TNO), and the MICS-Asia Scientific Community and Regional Emission Activity Asia (REAS) provide a global emission inventory at 0.1∘ × 0.1∘ resolution for TF HTAP2 modeling experiments (Janssens-Maenhout et al., 2015). The emission dataset was constructed for SO2, NOx, CO, non-methane volatile organic compounds, NH3, PM10, PM2.5, black carbon (BC), and organic carbon (OC) and seven emission sectors (shipping, aircraft, land transportation, agriculture, residential, industry, and energy) for the year 2010 (Fig. S1 in the Supplement).
This study uses outputs from 14 global models/model versions (Table S1) participating in TF HTAP2. Overall, TF HTAP2 model resolutions are finer than in TF HTAP1. In TF HTAP2, each model performed a baseline simulation and sensitivity simulations in which the anthropogenic emissions in a defined source region or sector were perturbed (reduced by 20 % in most cases). Based on the number of models that simulated different experiments, we choose to focus on emission reductions from six source regions, three emission sectors, and one global domain. More specifically, all anthropogenic emissions are reduced by 20 % in the NAM, EUR, SAS, EAS, RBU, and MDE continental regions, in the PIN, TRN, and RES emission sectors globally, and in GLO (Fig. S2). Unlike TF HTAP1 (Dentener et al., 2010), which defined rectangular regions that included ocean or some sparsely inhabited regions, TF HTAP2 regions are defined by geopolitical boundaries.
We selected output from the models that provided temporally resolved volume mixing ratios of O3 and mass mixing ratios of PM2.5 (“mmrpm2p5”) for the baseline and at least one regional or sectoral emission reduction scenario. Among the 14 models, 11 models reported O3 and eight reported PM2.5 for regional emission perturbation scenarios. Four models reported O3 and four reported PM2.5 for sectoral emission perturbation scenarios, and 10 models reported O3 and eight reported PM2.5 for the global emission perturbation. All models used prescribed meteorology for the year 2010, although this meteorology was derived from different (re)analysis products and was not uniform across models. Modeled concentrations are processed by calculating metrics consistent with the underlying epidemiological studies to estimate premature mortality. For O3, we calculate the average of daily 1 h maximum O3 concentration for the 6 consecutive months with the highest concentrations in each grid cell (Jerrett et al., 2009), for the baseline and each 20 % emission reduction scenario. While some models reported hourly O3 metrics, others only reported daily or monthly O3. We include these models by first calculating the ratio of the 6-month average of daily 1 h maximum O3 to the annual average of O3 in individual grid cells, for models reporting hourly O3, and then applying that ratio to the annual average of ozone for those models that only report daily or monthly O3, following Silva et al. (2013, 2016b). For PM2.5, we calculate the annual average PM2.5 concentration in each cell using the monthly total PM2.5 concentrations reported by each model (“mmrpm2p5”). Model results for these two metrics are then regridded from each model's native grid resolution (varying from 0.5∘ × 0.5∘ to 2.8∘ × 2.8∘) to a consistent 0.5∘ × 0.5∘ resolution used in mortality estimation. We estimate regional and sectoral multi-model averages for each 20 % emission reduction scenario in the year 2010, but for each perturbation case, we only include models that report both the baseline and perturbation cases.
2.2 Model evaluation
Measurements from multiple observation networks are employed in this study to evaluate the model performance around the world. We evaluate model performance for the 2010 baseline simulation for 11 TF HTAP2 models for O3 and eight models for PM2.5 (Table S1). For O3, we use ground level measurements from 2010 at 4655 sites globally, collected by the Tropospheric Ozone Assessment Report (TOAR) (Schultz et al., 2017; Young et al., 2018). The TOAR dataset identifies stations as urban, rural, and unclassified sites (Schultz et al., 2017). Model performance is evaluated for the average of daily 1 h maximum O3 concentrations for the 3 consecutive months (3m1hmaxO3) with the highest concentrations in each grid cell, including models that only report daily or monthly O3 as described above. This metric for O3 differs slightly from the 6-month average of daily 1 h maximum metric used for health impact assessment and is chosen because TOAR reports the 3-month metric but not the 6-month metric. For PM2.5, we compare the annual average PM2.5, using PM2.5 observations from 2010 at 3157 sites globally selected for analysis by the Global Burden of Disease 2013 (GBD2013) (Forouzanfar et al., 2016; Brauer et al., 2016). Statistical parameters including the normalized mean bias (NMB), normalized mean error (NME), and correlation coefficient (R) are selected to evaluate model performance.
Tables S2 and S3 present statistical parameters of model evaluation for O3 and PM2.5, and Figs. S3–S10 show the spatial O3 and PM2.5 evaluation as NMB around the world and in NAM, EUR, and EAS. For 3m1hmaxO3, the model ensemble mean shows good agreement with measurements globally with a NMB of 7.3 % and NME of 13.2 % but moderate correlation with R of 0.53 (Table S2). For individual models, eight models (CAM-Chem, CHASER_T42, CHASER_T106, EMEPrv48, GEOS-Chem Adjoint, GEOS-Chem, GFDL_AM3, and HadGEM2-ES) overestimate 3m1hmaxO3 with NMB of 9.2 to 23 % while three models (C-IFS, OsloCTM3.v2, and RAQMS) underestimate 3m1hmaxO3 by −10.8 to −19.4 % globally (Fig. S3). In the six perturbation regions, the model ensemble mean is also in good agreement with the measurements, with −11.2 to 25.3 % for NMB, 9.8 to 25.3 % for NME, and −0.09 to 0.98 for R. The ranges of NMB for individual models are −18.1 to 32.3 %, −24.1 to 21.3 %, −24.5 to 45.0 %, −26.4 to 24.5 %, −30.5 to 20.3 %, and −35.3 to 5.4 % in NAM, EUR, SAS, EAS, MDE, and RBU, respectively (Figs. S4–S6). Note that some regions (SAS, MDE, and RBU) have very few observations for model evaluation, making the comparison less robust. The underestimated O3 in the western US and overestimated O3 in the eastern US in most models are very close to the model performance results of Huang et al. (2017), who compare eight TF HTAP2 models with CASTNET observations (Fig. S4) , as well as earlier studies under HTAP1 (Fiore et al., 2009). Similarly, Dong et al. (2018) find that O3 is overestimated in EUR and EAS by six TF HTAP2 models, consistent with our ensemble mean result in these two regions (Figs. S5–S6).
For PM2.5, the model ensemble mean agrees well with measurements globally, with a NMB of −23.1 %, NME of 35.4 %, and R of 0.77 (Table S3). For individual models, only one model (GEOS-Chem Adjoint) overpredicts PM2.5 by 20.3 %, while the other seven models underpredict PM2.5 by −60.9 to −7.4 % around the world (Fig. S7). In six perturbation regions, the model ensemble mean is also in good agreement with measurements, with ranges of NMB of −49.7 to 19.4 %, 21.2 to 49.7 % for NME, and 0.50 to 1.00 for R. The ranges of NMB for individual models are −46.6 to 13.9 %, −76.0 to 31.9 %, −35.0 to 49.7 %, −50.4 to 29.5 %, −52.6 to 31.5 %, and −74.1 to −19.8 % in NAM, EUR, SAS, EAS, MDE, and RBU, respectively (Figs. S8–S10). Dong et al. (2018) show that PM2.5 is underestimated in EUR and EAS by six TF HTAP2 models, consistent with our ensemble mean result in these two regions (Figs. S9–S10). Note that many observations used are located in urban areas, and models with coarse resolution may not be expected to have good model performance. Several models also neglect some PM2.5 species, which may explain the tendency of models to underestimate.
2.3 Health impact assessment
We use output from the TF THAP2 model ensemble to estimate annual global O3- and PM2.5-related cause-specific premature mortality and avoided mortality from the 20 % regional and sectoral emission reductions, following the same methods used by Silva et al. (2016a, b). The annual O3- and PM2.5-related premature mortality is calculated using a health impact function based on epidemiological relationships between ambient air pollution concentration and mortality in each grid cell: , where ΔM is premature mortality, y0 is the baseline mortality rate (for the exposed population), AF = is the attributable fraction, where RR is relative risk of death attributable to the change in air pollutant concentration (RR = 1 when there is no increased risk of death associated with a change in pollutant concentration), and Pop is the exposed population (adults aged 25 and older).
For O3 mortality, we use a log-linear model for chronic respiratory mortality (RESP) from an American Cancer Society (ACS) study (Jerrett et al. 2009), following recent studies including the GBD (Cohen et al., 2017), but Turner et al. (2016) recently published new results for chronic ozone mortality, and adoption of these results would lead to more ozone-related deaths overall (Malley et al., 2017). RR is calculated as
where β is the concentration response factor, and Δx corresponds to the change in pollutant concentrations among simulations with perturbed emissions and the baseline simulation. For O3, RR = 1.040 (95 % CI: 1.013–1.067 ) for a 10 ppb increase in O3 concentrations (Jerrett et al., 2009), which from Eq. (1) gives values for β of 0.00392 (0.00129–0.00649). We estimate O3-related premature deaths due to respiratory disease (RESP) based on decreases or increases in O3 concentration (i.e., Δx) due to 20 % regional and sectoral emission reduction scenarios relative to the baseline. For regional and sectoral reductions, we do not assume a low-concentration threshold below which changes in O3 have no mortality effects as there is no clear evidence for such a threshold, following Anenberg et al. (2009, 2010) and Silva et al. (2013, 2016a, b). However, we evaluate global O3 premature mortality for the baseline 2010 simulation, relative to a counterfactual concentration of 37.6 ppb (Lim et al. 2012), for consistency with GBD estimates (Cohen et al., 2017).
For PM2.5 mortality, we apply the IER model, which is intended to better represent the risk of exposure to PM2.5 at locations with high ambient concentrations (Burnett et al., 2014). RR is calculated as
where z is the PM2.5 concentration in micrograms per cubic meter and zcf is the counterfactual concentration below which no additional risk is assumed, and the parameters α, γ, and δ are used to fit the function for cause-specific RR (Burnett et al., 2014). The overall PM2.5-related cause-specific premature deaths related to ischemic heart disease (IHD), cerebrovascular disease (STROKE), chronic obstructive pulmonary disease (COPD), and lung cancer (LC) are estimated using RRs per age group for IHD and STROKE and RRs for all ages for COPD and LC. A uniform distribution from 5.8 to 8.8 µg m−3 is used for zcf as suggested by Burnett et al. (2014), which does not vary in space nor time. For uncertainty analysis, we use results from 1000 Monte Carlo simulations of Burnett et al. (2014) to calculate RR in each grid cell using Eq. (2) or (3). We estimate avoided premature mortality in 20 % emission perturbation experiments by taking the difference in premature mortality estimates with the 2010 baseline. However, in the IER model, the concentration response function flattens off at higher PM2.5 concentrations, yielding different estimates of avoided premature mortality for identical changes in air pollutant concentrations from less-polluted vs. highly polluted regions. That is, one unit reduction of air pollution may have a stronger effect on avoided mortality in regions where pollution levels are lower (e.g., EUR, NAM) compared with highly polluted regions (e.g., EAS, India), which would not be the case for a log-linear function (Jerrett et al., 2009; Krewski et al., 2009). Therefore, using the IER model in this study may result in smaller changes in avoided mortality in highly polluted areas than using the linear model.
For the exposed population, we use the Oak Ridge National Laboratory's LandScan 2011 Global Population Database at approximately 1 km resolution (30 × 30) (Bright et al., 2012). For the population of adults aged 25 and older, we use ArcGIS 10.2 geoprocessing tools to estimate the population per 5-year age group in each cell by multiplying the country level percentage in each age group by the population in each cell. We obtained cause-specific baseline mortality rates for 187 countries from the GBD 2010 mortality dataset (IHME, 2013). The population and baseline mortality per age group were regridded to the 0.5∘ × 0.5∘ grid (Table S4 and Fig. S11). Cause-specific baseline mortality rates vary geographically, e.g., RESP and COPD are relatively more dominant in SAS, IHD in EUR, STROKE in Russia, and LC in NAM.
Finally, we conduct 1000 Monte Carlo simulations to propagate uncertainty from baseline mortality rates, modeled air pollutant concentrations, and the RRs in health impact functions. We use the reported 95 % CIs for cause-specific baseline mortality rates, assuming lognormal distributions. For modeled O3 and PM2.5 concentrations we use the absolute value of the coefficient of variation among models in each grid cell, for each 20 % emission perturbation case minus the baseline, assuming a normal distribution. For O3 RRs, we use the reported 95 % confidence intervals (CIs), assuming a normal distribution. For PM2.5 RRs, we use the parameter values (i.e., α, γ, δ, and zcf) of Burnett et al. (2014) for 1000 simulations. One should acknowledge that the range of modeled air pollution concentrations in an ensemble is not a true reflection of the uncertainty in emissions or concentrations. The mean health outcome of the 1000 Monte Carlo simulations (the empirical mean) may differ from the mean when using the mean RR.
We also quantify the uncertainties in mortality due to the spread of air pollutant concentrations across models, RRs, and baseline mortality rates, as contributors to the overall uncertainty, expressed as a coefficient, of variation and compare the result with the Monte Carlo analysis estimate. To do so, we hold two variables at their mean values and change the variable of interest within its uncertainty range; for example, using mean RRs and baseline mortality rates, we analyze the spread of the model ensemble to calculate the coefficient of variation caused by model uncertainty. Given that our 0.5∘ × 0.5∘ grid cell resolution can capture most of the population well in a given region, uncertainty associated with population was assumed to be negligible. We estimate the impacts of extra-regional emission reductions on mortality by using the response to extra-regional emission reduction (RERER) metric defined by TF HTAP (Galmarini et al., 2017):
where for a given region i, Rglobal is the change in mortality in the GLO 20 % reduction simulation relative to the base simulation, and Rregion, i is the change in mortality in response to the 20 % emission reduction from that same region i. A RERER value near 1 indicates a strong relative influence of foreign emissions on mortality within a region, while a value near 0 indicates a weak foreign influence. We also estimate the total avoided extra-regional mortality from a source perspective as the sum of avoided deaths outside of each of the six source regions, and from a receptor perspective by summing for all six regions.
3.1 Response of O3 and PM2.5 concentrations to 20 % regional and sectoral emission reductions
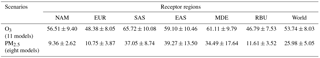
Previous TF HTAP studies reported area-averaged concentrations to quantify source–receptor relationships, averaging concentrations over a region (Doherty et al., 2013; Fiore et al., 2009; Fry et al., 2012; Huang et al., 2017; Stjern et al., 2016; Yu et al., 2013). Here, we present the population-weighted concentration over a region, which is more relevant for health. Among six receptor regions, the population-weighted multi-model mean O3 concentrations range from 48.38 ± 8.05 ppb in EUR to 65.72 ± 10.08 ppb in SAS with a global average of 53.74 ± 8.03 ppb, while the annual population-weighted multi-model mean PM2.5 concentrations range from 9.36 ± 2.62 µg m−3 in NAM to 39.27 ± 13.50 µg m−3 in EAS with a global average of 25.98 ± 5.05 µg m−3 (Tables 1 and S5–S6 and Figs. S12–S13).
Table 1Population-weighted multi-model mean O3 (ppb) and PM2.5 concentration (µg m−3) for the 2010 baseline, for the 6-month O3 season average of 1 h daily maximum O3 and annual average PM2.5, shown with the standard deviation among models.
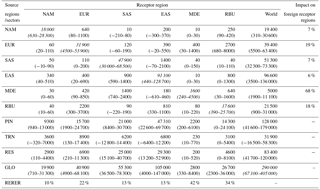
For 20 % perturbation scenarios, in general the impact on the multi-model mean change in surface O3 and PM2.5 concentration is greater within the source region (i.e., domestic region) than outside of it (i.e., foreign region) (Figs. 1–2). This is also true for individual model results (Figs. S14–S16). Among six source regions, the emission reduction from SAS has the greatest impact on global population-weighted O3 concentration (Tables 2 and S5), while that from EAS has the greatest impact on PM2.5 (Tables 3 and S6). The source–receptor pairs with the greatest changes in O3 and PM2.5 concentration reflect the geographical proximity among regions and the magnitude of emissions (Tables 2–3) – e.g., EUR → MDE (0.34 ± 0.08 ppb), EUR → RBU (0.34 ppb ± 0.09), EAS → NAM (0.29 ± 0.14 ppb), EAS → RBU (0.27 ± 0.12 ppb), and NAM → EUR (0.26 ± 0.55 ppb) for O3, and EUR → RBU (0.26 ± 0.19 µg m−3), EUR → MDE (0.18 ± 0.08 µg m−3), MDE → SAS (0.12 ± 0.06 µg m−3), SAS → EAS (0.08 ± 0.08 µg m−3), and EAS → SAS (0.08 ± 0.07 µg m−3) for PM2.5. Our ensemble shows ozone responses in the western US to emission reductions from EAS (Fig. 1c) similar to those modeled by Lin et al. (2012, 2017), who show that a model can capture the measured western US ozone increases due to rising Asian emissions.
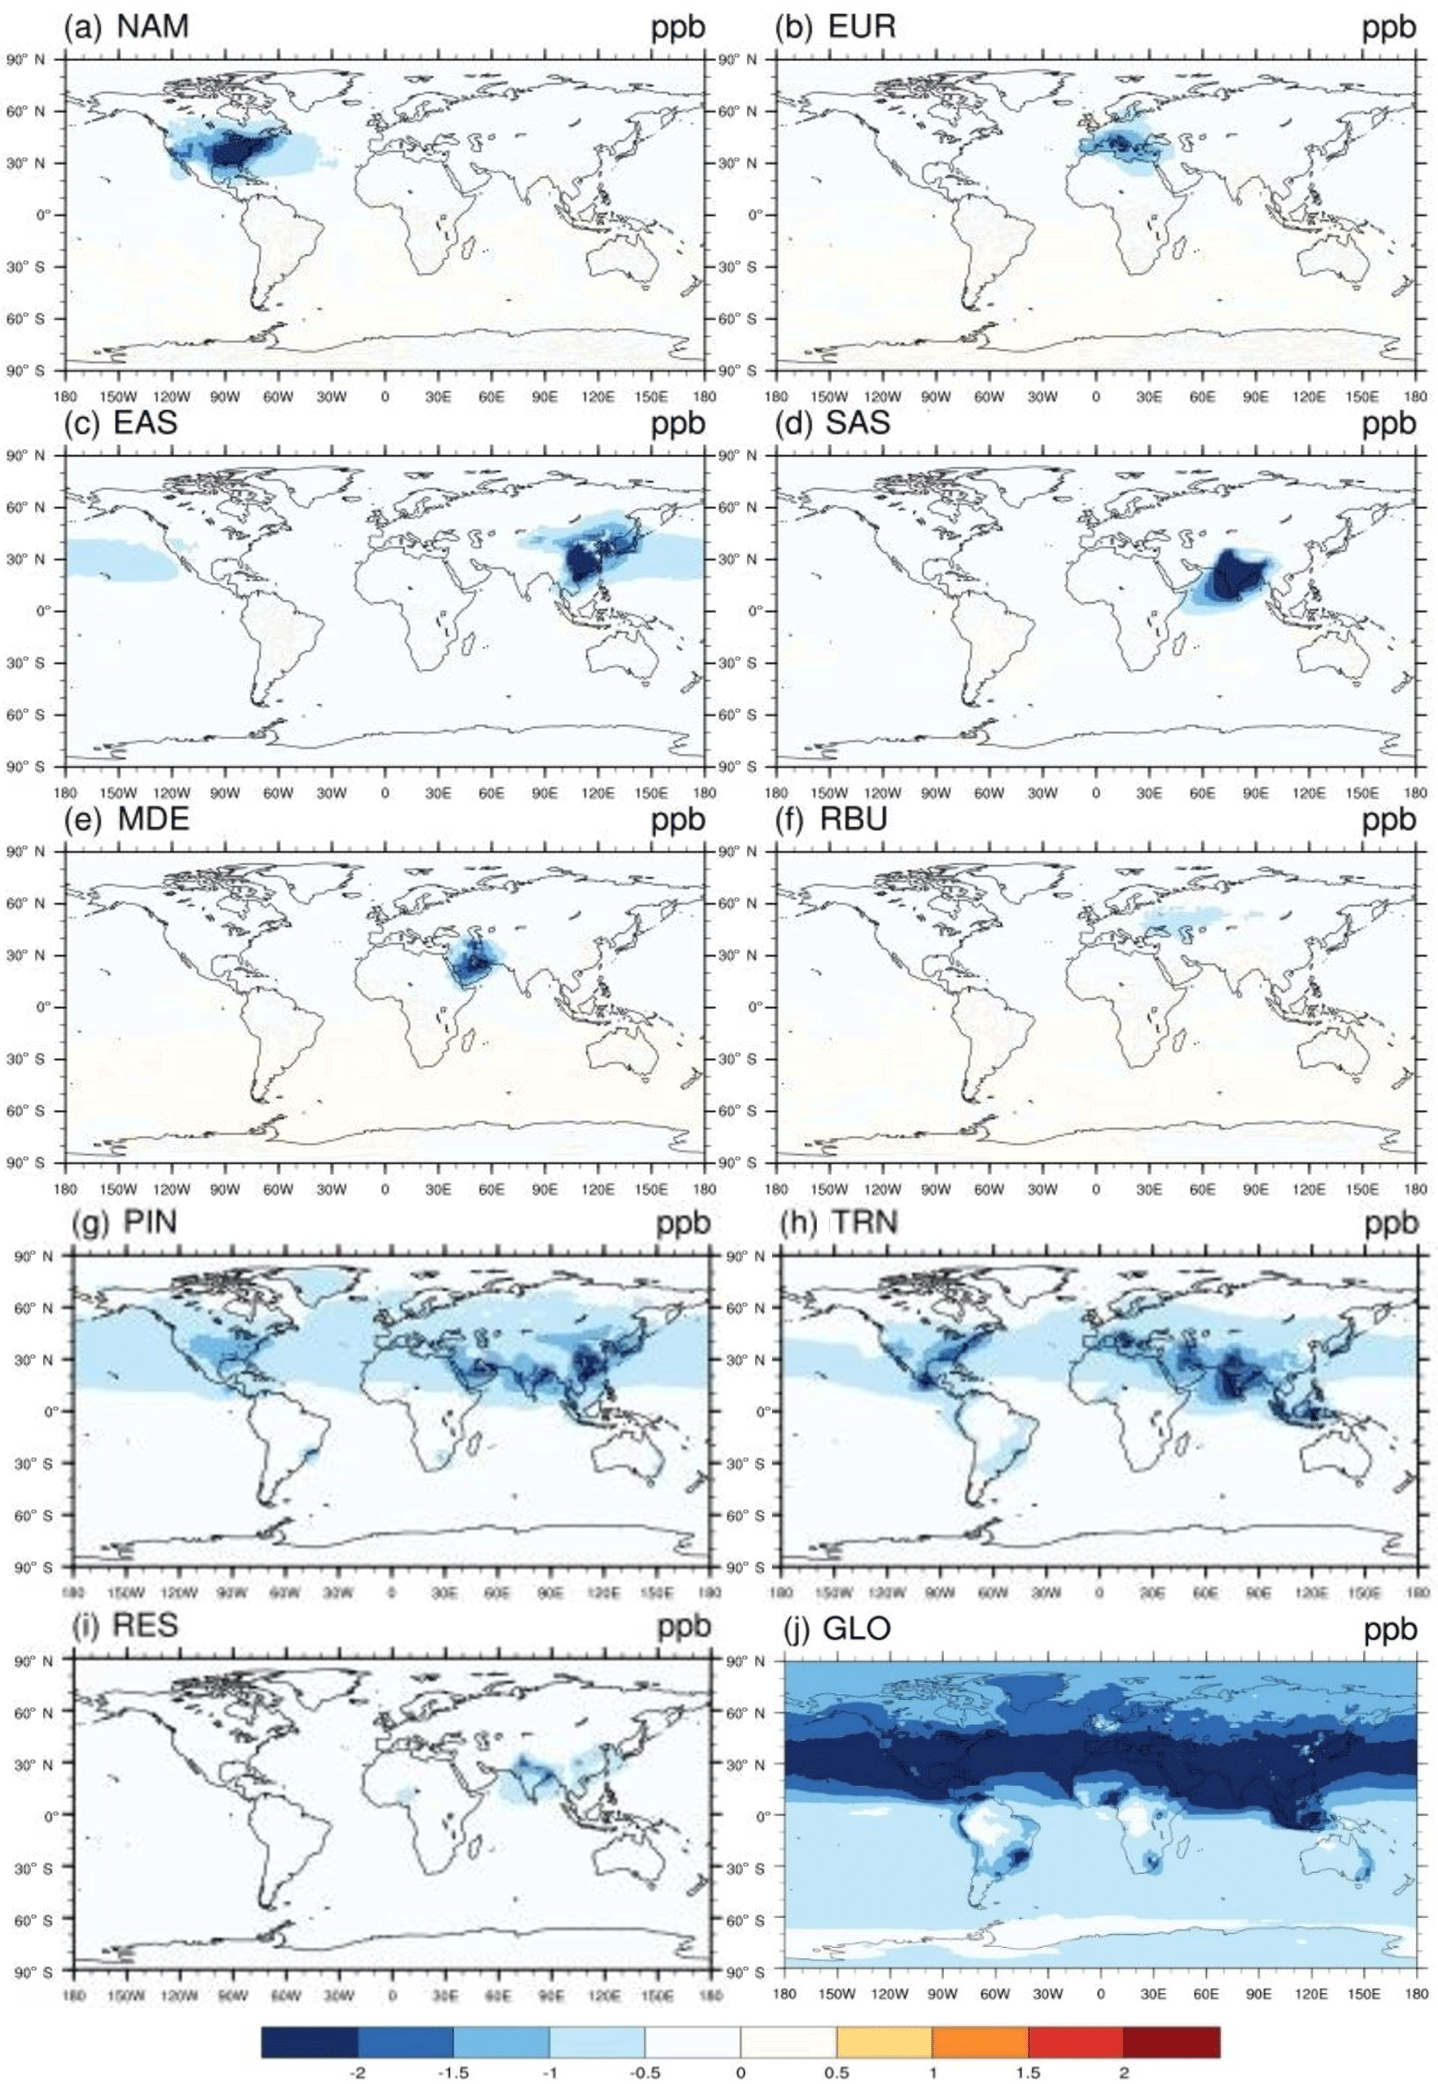
Figure 1Global difference in multi-model mean O3 concentrations (ppb) in 20 % emission reduction scenarios relative to the baseline for the year 2010 in (a) North America (NAM), (b) Europe (EUR), (c) East Asia (EAS), (d) South Asia (SAS), (e) the Middle East (MDE), and (f) Russia–Belarus–Ukraine (RBU), the (g) power and industry (PIN), (h) transportation (TRN), and (i) residential (RES) sectors, and (j) globally (GLO), shown for the 6-month O3 season average of 1 h daily maximum health-relevant metric.
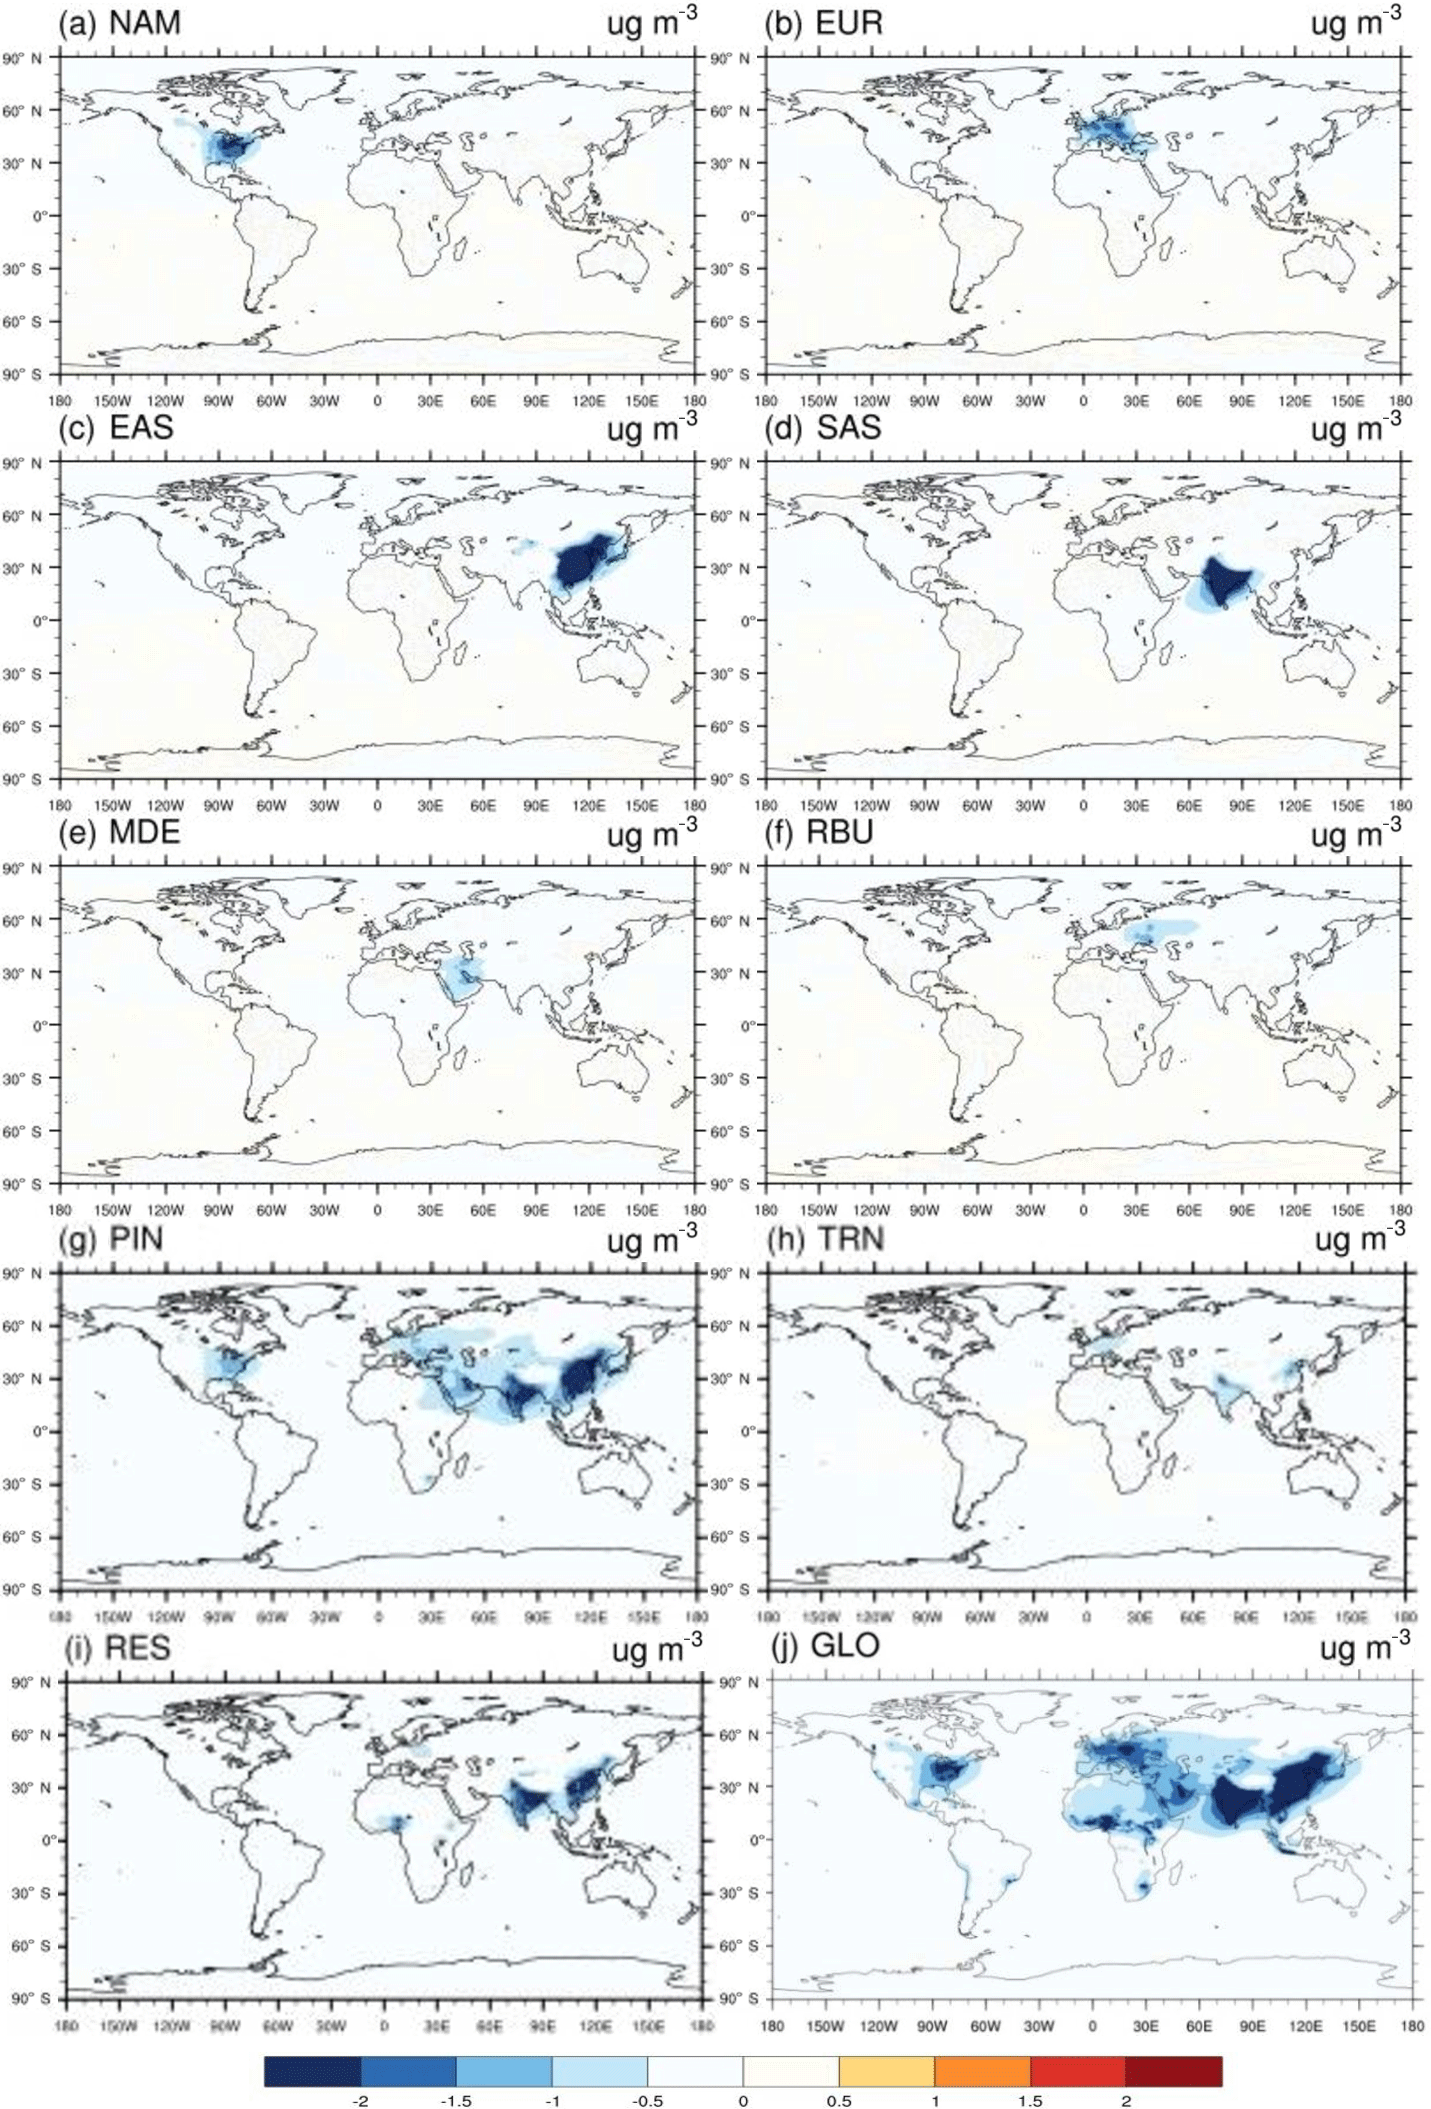
Figure 2Global difference in multi-model annual mean PM2.5 concentrations (µg m−3) in 20 % emission reduction scenarios relative to the baseline for the year 2010 in (a) North America (NAM), (b) Europe (EUR), (c) East Asia (EAS), (d) South Asia (SAS), (e) the Middle East (MDE), and (f) Russia–Belarus–Ukraine (RBU), the (g) power and industry (PIN), (h) transportation (TRN), and (i) residential (RES) sectors, and (j) globally (GLO).
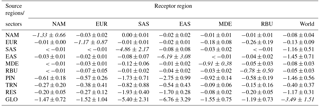
Table 2Population-weighted multi-model mean change in O3 (ppb) in receptor regions due to 20 % regional (NAM, EUR, SAS, MDE, and RBU), sectoral (PIN, TRN, and RES), and global (GLO) anthropogenic emission reductions, for the 6-month O3 season average of 1 h daily maximum. The diagonal, showing the effect of each region on itself, is shown in italics. All numbers are rounded to the nearest hundredth, and are shown with standard deviations among models.
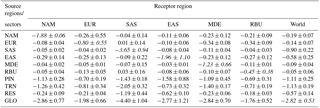
Table 3Population-weighted multi-model annual average change in PM2.5 concentrations (µg m−3) in receptor regions due to 20 % regional (NAM, EUR, SAS, MDE, and RBU), sectoral (PIN, TRN, and RES), and global (GLO) anthropogenic emission reductions. The diagonal, showing the effect of each region on itself, is shown in italics. All numbers are rounded to the nearest hundredth, and are shown with standard deviations among models.
For each receptor region, reducing foreign anthropogenic emissions by 20 % (estimated by global minus within-region reductions) can decrease population-weighted O3 concentrations by 29–74 % of the change in O3 concentration and 8–41 % of the change in PM2.5 concentration (Tables 2–3). In some cases, regional emission reductions cause small O3 concentration increases within the source region or in foreign receptors, reflecting O3 nonlinear responses (Fig. S14). For instance, C-IFS_v2 predicts O3 concentration increases in EUR by 0.04 ppb from domestic emission reductions, which is in agreement with results from TF HTAP1 (Anenberg et al., 2009). Similarly, CAM-Chem shows more local O3 increases, particularly in SAS, than other models (Fig. S14). The change in O3 concentration in foreign receptors is broader than for PM2.5, reflecting that O3 has a longer atmospheric lifetime than PM2.5.
For sectors, TRN emission reductions cause the greatest decrease in global population-weighted O3 by 1.13 ± 0.19 ppb, while PIN emission reductions cause the greatest decrease in surface PM2.5 by 1.46 ± 0.56 µg m−3 globally (Tables 2–3 and Figs. 1–2). The 20 % emission reductions from individual sectors also have different effects in different regions. Of the three sectors, emission reductions from TRN have the greatest effect on population-weighted O3 in NAM, EUR, SAS, MDE, and MDE (40–50 % of the global emission reduction) while PIN emission reductions dominate in EAS (57 %). Emission reductions from PIN have the greatest effect on population-weighted PM2.5 in NAM, EUR, EAS, MDE, and MDE (41–84 %) while RES emission reductions dominate in SAS (43 %). The response of PM2.5 concentration to sectoral emission reductions differs significantly across models, which reflects in part the PM2.5 species simulated by each model (Table S1 and Figs. S15–S17). For instance, we found that models that simulate PM2.5 nitrate (i.e., CHASER_t42 and GEOS-Chem Adjoint) predict a greater impact on PM2.5 concentration from TRN emission reduction than those without nitrate (i.e., GOCARTv5 and SPRINTARS) (Fig. S17).
3.2 Global mortality burden associated with anthropogenic air pollution
Table 4 shows the annual multi-model mean O3- and PM2.5-related premature deaths in six regions and globally for the year 2010 baseline with 95 % CIs based on Monte Carlo sampling. Tables S7–S8 show estimates of premature deaths due to anthropogenic O3 and PM2.5 from individual models. For the ensemble model mean, we estimate 290 000 (30 000, 600 000) premature O3-related deaths globally using a 37.6 ppb counterfactual concentration, and 2.8 million (0.5 million, 4.6 million) PM2.5-related premature deaths using a uniform distribution of counterfactual concentration from 5.8 to 8.8 µg m−3. Highly populated areas of India and EAS have the highest number of O3- and PM2.5-related deaths, and those regions together account for 82 and 66 % of the global total O3- and PM2.5-related deaths. Compared with the GBD 2015 (Cohen et al., 2017), our global burden estimates are greater than the 254 000 (97 000, 422 000) premature deaths per year for O3 from GBD, while there are less than 4.2 million (3.7 million, 4.8 million) premature deaths for PM2.5. Lelieveld et al. (2015) estimate 142 000 (CI: 90 000, 208 000) O3-related deaths and 3.2 million (1.5 million, 4.6 million) PM2.5-related premature deaths for 2015. These differences can be explained mainly by exposure estimates. Here we used a multi-model ensemble, whereas Lelieveld et al. (2015) used a single model, and Cohen et al. (2017) used a single model for O3 and a single model combined with surface and satellite observations for PM2.5. In addition, Cohen et al. (2017) use RRs for particulate matter for IHD and stroke mortality that are modified from those used by Burnett et al. (2014) and applied age modification to the RRs, fitting the IER model for each age group separately. The updated IER with estimated higher relative risks, together with greater global pollution and baseline mortality rates in the low-income and middle-income countries in EAS and SAS, leads to the higher absolute numbers of attributable deaths and disability-adjusted life-years (DALYs) in GBD 2015 than estimated in GBD 2013 (Forouzanfar et al., 2016). Also, GBD 2015 includes lower child respiratory infection estimates whereas we do not. Our wider range of uncertainty for the global mortality reflects the uncertainty in baseline rates, RRs, and spread of air pollutant concentration across models whereas Cohen et al. (2017) consider national-level population-weighted mean concentrations and uncertainty of IER function predictions at each concentration, and Lelieveld et al. (2015) only account for the statistical uncertainty of the parameters used in the IER functions.
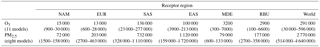
Table 4Annual multi-model empirical mean O3- and PM2.5-related premature deaths with 95 % CI from Monte Carlo simulations in parentheses (including uncertainty in baseline mortality rates, RRs, and air pollutant concentration across models) in the year 2010 baseline. All numbers are rounded to three significant figures or the nearest 100 deaths. Empirical mean is the mean of 1000 Monte Carlo simulations.
3.3 Effect of regional reductions on mortality
Reducing global anthropogenic emissions of air pollutant by 20 % avoids 47 400 (11 300, 99 000) O3-related deaths and 290 000 (67 100, 405 000) PM2.5-related premature deaths (Tables 5–6 and S9–S10). Most avoided air-pollution-related deaths were found within or close to the source region (Figs. 3–6). Reducing anthropogenic emissions by 20 % from NAM, EUR, SAS, EAS, MDE, and RBU can avoid 54, 54, 95, 85, 21, and 22 % of the global change in O3-related deaths within the source region (the number of avoided deaths within the source region is divided by the number of avoided deaths globally), and 93, 81, 93, 94, 32, and 82 % of the global change in PM2.5-related deaths, respectively (Tables 5–6). Whereas the most O3-related premature deaths can be avoided by reducing SAS emissions (20 000 (3600, 42 200) deaths per year), reducing EAS emissions avoids more O3-related premature deaths (1700 (−1300, 5400)) outside of the source region than for any other region (500 (180, 870) deaths per year to 1300 (−1200, 4400) deaths per year (Table 5). Similarly, while reducing EAS emissions avoids the most PM2.5-related premature deaths (96 600 (3500, 136 000) deaths per year), reducing EUR emissions avoids more PM2.5-related premature deaths (7400 (930, 9500) deaths per year) outside of the source region than for any other region (1400 (−320, 2300) deaths per year to 5500 (3 000, 7800) deaths per year) (Table 6). While emission reductions from one region generally lead to more avoided deaths within the source region than outside of it, 20 % anthropogenic emission reductions from MDE (i.e., 79 and 68 % of global avoided deaths outside the source region for O3 and PM2.5, respectively) and RBU (78 % for O3) can avoid more premature deaths outside of the source region than within (Tables 5–6). This result for RBU is in agreement with West et al. (2009b). However, the results for NAM and EUR do not agree with previous studies that found that emission reductions in these regions cause more O3-related avoided premature deaths outside of the source region than within (Anenberg et al., 2009; Duncan et al., 2008; West et al., 2009b). For PM2.5, our results are comparable with Anenberg et al. (2014) and Crippa et al. (2017), who found that for most regions, PM2.5-related avoided premature deaths are higher within the source region than outside. The above difference in results with TF HTAP1 may be in part because of the definition of regions. Whereas the TF HTAP2 regions are defined by geopolitical boundaries, the TF HTAP1 regions are defined by square domains which are larger and include more ocean areas (Anenberg et al., 2009). In addition, updated atmospheric models and emission inputs, as well as different atmospheric dynamics in the single years chosen in TF HTAP1 vs. TF HTAP2 may contribute to the differences.
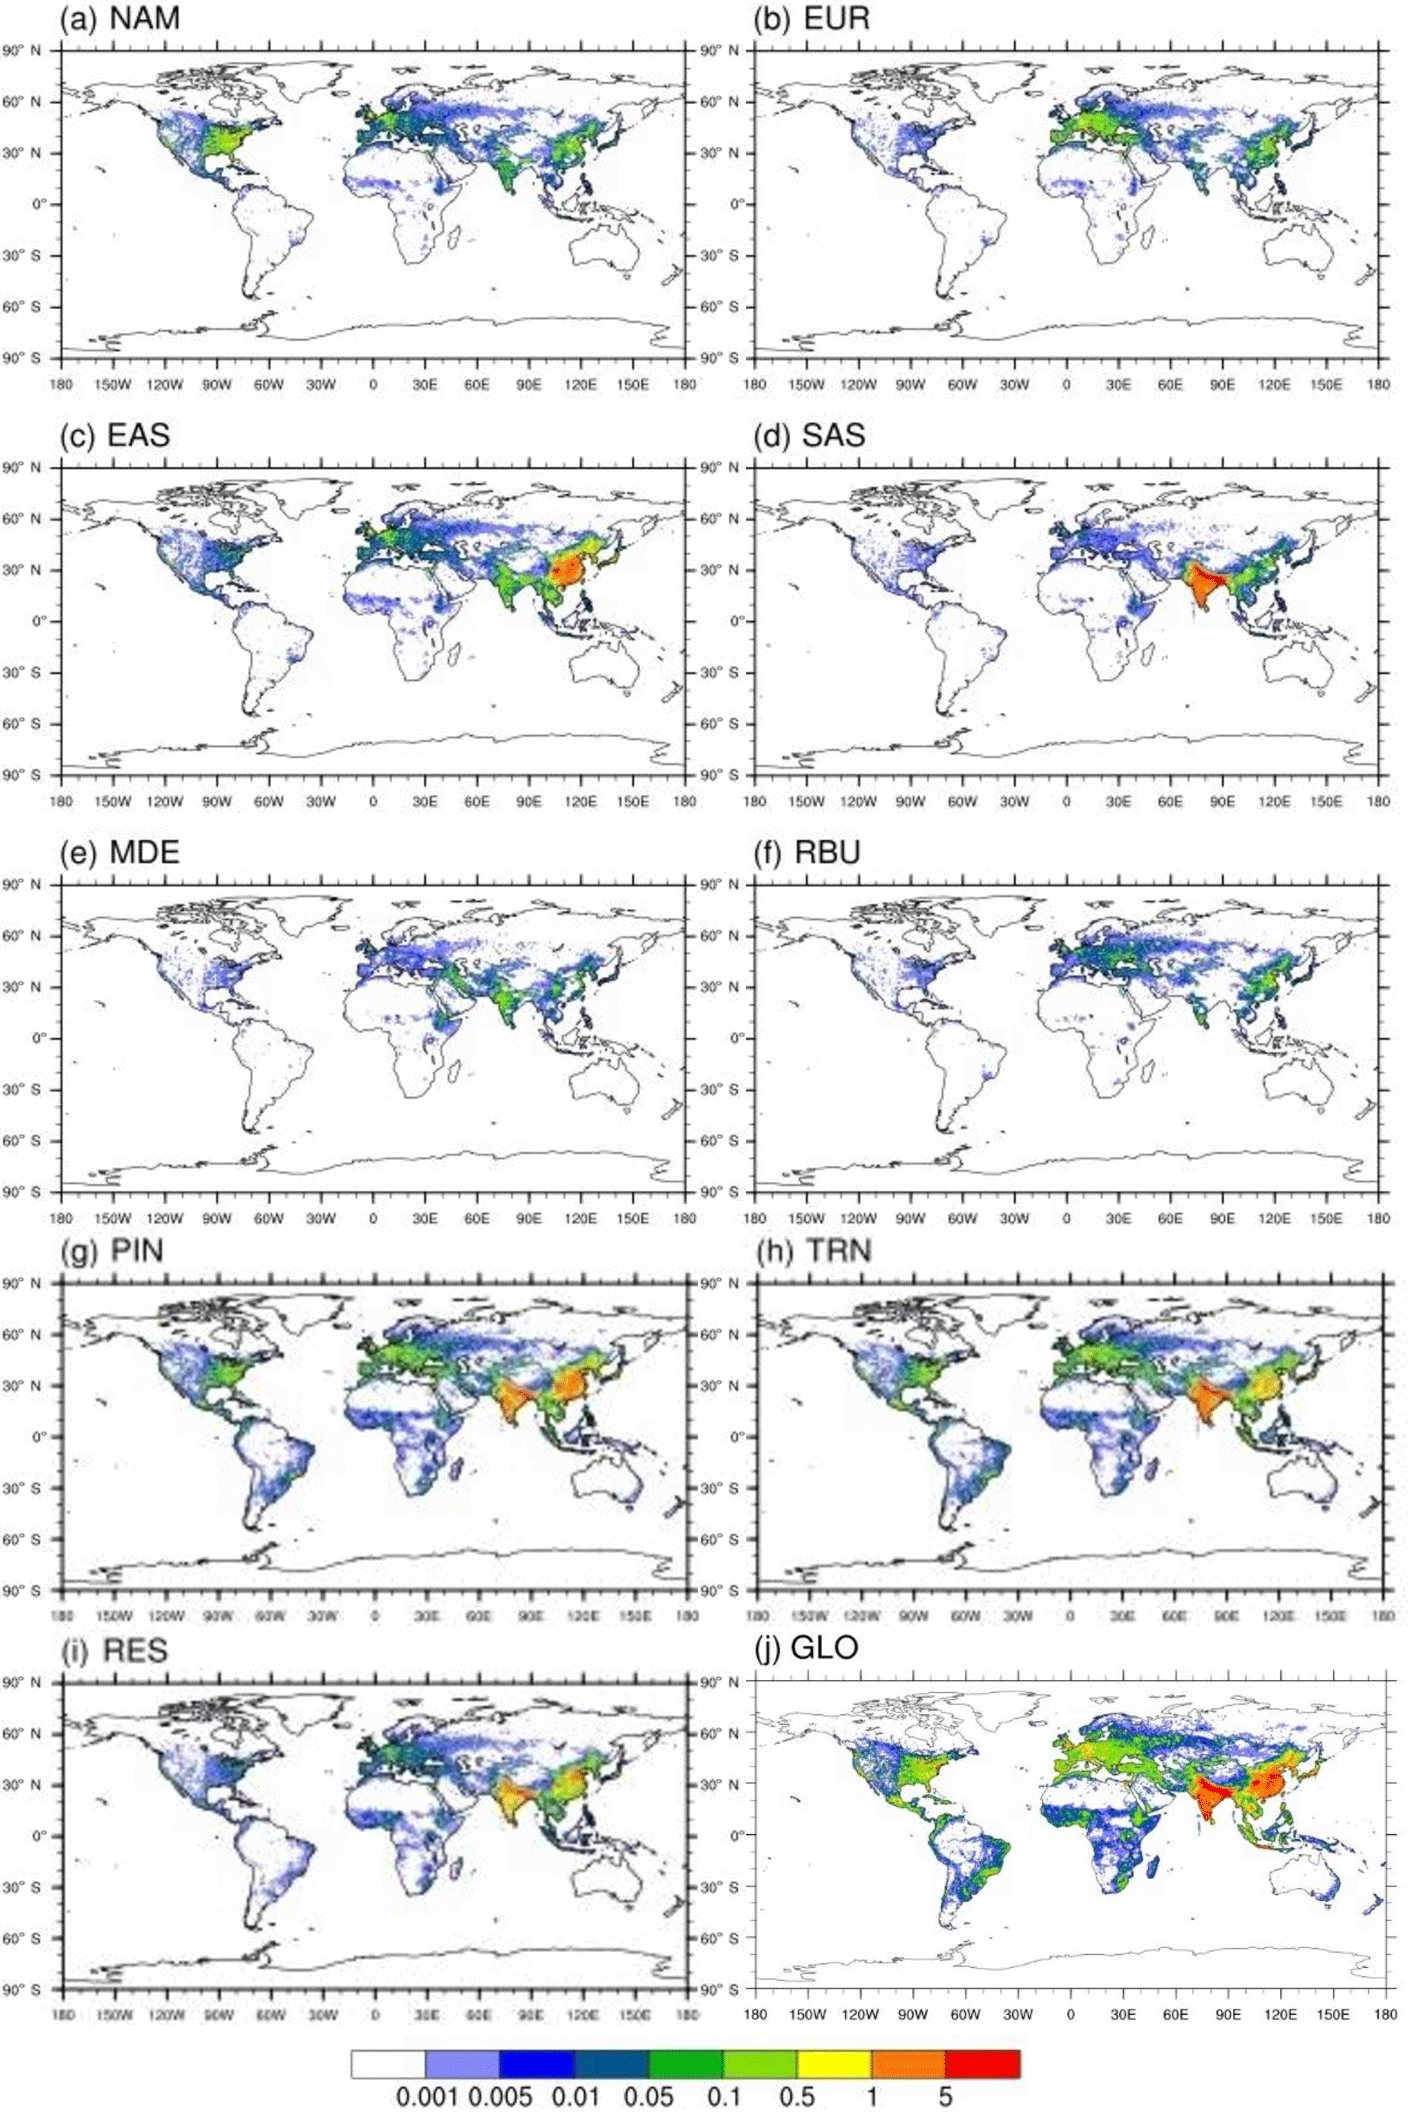
Figure 3Annual avoided O3-related premature deaths in 2010 per 1000 km2 due to 20 % emission reduction scenarios relative to the base case in (a) North America (NAM), (b) Europe (EUR), (c) East Asia (EAS), (d) South Asia (SAS), (e) the Middle East (MDE), and (f) Russia–Belarus–Ukraine (RBU), the (g) power and industry (PIN), (h) transportation (TRN), and (i) residential (RES) sectors, and (j) globally (GLO).
Table 5Annual avoided multi-model empirical mean O3-related premature respiratory deaths with 95 % CI from Monte Carlo simulations in parentheses due to 20 % regional (NAM, EUR, SAS, MDE, and RBU), sectoral (PIN, TRN, and RES), and global (GLO) anthropogenic emission reductions in each region and worldwide. The diagonal, showing the effect of each region on itself, is shown in italics. For regional reductions, we also use the RERER (Eq. 4) as the percent of total avoided deaths in each receptor region that result from foreign emission reductions, as well as the percent of global avoided deaths from emission reductions in each source region. All numbers are rounded to three significant figures or the nearest 10 deaths.
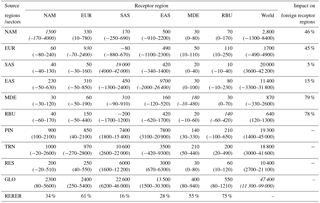
Table 6Annual avoided multi-model empirical mean PM2.5-related premature deaths (IHD + STROKE + COPD + LC) with 95 % CI from Monte Carlo simulations in parentheses due to 20 % regional (NAM, EUR, SAS, MDE, and RBU), sectoral (PIN, TRN, and RES), and global (GLO) anthropogenic emission reductions in each region and worldwide. The diagonal, showing the effect of each region on itself, is shown in italics. For regional reductions, we also use the RERER (Eq. 4) as the percent of total avoided deaths in each receptor region that result from foreign emission reductions, as well as the percent of global avoided deaths from emission reductions in each source region. All numbers are rounded to three significant figures or the nearest 10 deaths.
Using individual models, different conclusions may result for the relative importance of interregional transport. For example, for O3, eight models predict that NAM emission reductions cause more O3-related premature deaths within NAM (i.e CAM-Chem, CHASER_T42, CHASER_T106, C-IFS, GEOS-Chem Adjoint, GEOS-Chem, GFDL_AM3, and HadGEM2-ES), whereas two models predict more deaths outside NAM (i.e., EMEPrv48 and OsloCTM3.v2). Five models suggest that EUR emission reductions cause more O3-related premature deaths within EUR (i.e., CAM-Chem, CHASER_T42, CHASER_T106, GFDL_AM3, and HadGEM2-ES), whereas four show more deaths outside (i.e., C-IFS, GEOS-Chem Adjoint, EMEPrv48, and OsloCTM3.v2). Each individual model shows that emission reductions from SAS and EAS avoid more O3-related premature deaths within than outside, and that those from MDE and RBU avoid more O3-related premature deaths outside than within (Fig. S18). For PM2.5, each individual model shows that emission reductions from NAM, EUR, SAS, EAS, and RBU avoid more PM2.5-related premature deaths within than outside, while for emission reductions from MDE, three models (EMEPrv48, GEOS-Chem Adjoint, and SPRINTARS) show more PM2.5-related premature deaths within, while three (CHASER_T42, GEOS5, and GOCART) show more PM2.5-related premature deaths outside (Fig. S19). The variation in health effect reflects the differences in processing of natural emissions, atmospheric physical and chemical mechanisms, numerics, etc., across models.
For each receptor region, reducing domestic anthropogenic emissions by 20 % contributes about 66, 39, 84, 72, 45, and 25 % of the total O3-related avoided premature mortality (from the global reduction) and 90, 78, 87, 87, 58, and 66 % of the total PM2.5-related avoided premature mortality (from the global reduction) in NAM, EUR, SAS, EAS, MDE, and RBU, respectively (Tables 5–6). Therefore, reducing emissions from foreign regions avoids more O3 premature deaths in EUR (foreign emissions account for 61 % of total avoided deaths from the global reduction), MDE (55 %), and RBU (75 %) than reducing domestic emissions (Tables 5–6), in agreement with the results for EUR from Anenberg et al. (2009). Whereas EAS has the greatest number of avoided O3-related premature deaths due to foreign emission reduction (3800 (3600, 3900) deaths per year), RBU has the greatest fraction of O3 mortality from foreign emission reductions (75 %) (Table 5). Similarly, for PM2.5, while EAS has the greatest number of avoided PM2.5-related premature deaths due to foreign emission reductions (13 600 (3500, 18 800) deaths per year), MDE has the greatest fraction of PM2.5 mortality from foreign emission reduction (42 %) (Table 6).
Overall, adding results from all six regional reductions, interregional transport of air pollution from extra-regional contributions is estimated to lead to more avoided deaths through changes in PM2.5 (25 100 (8200, 35 800) deaths per year) than in O3 (6000 (−3400, 15 500) deaths per year), consistent with Anenberg et al. (2009, 2014). This result is due to the greater influence of PM2.5 on mortality, despite the shorter atmospheric lifetime of PM2.5 relative to O3.
The contributions of different factors to the overall uncertainties in mortality are shown in Tables S11–S12, considering uncertainties due to the spread of air pollutant concentrations across models, RRs, and baseline mortality rates, expressed as coefficients of variation. For both O3 and PM2.5 mortality, the spread of model results generally contributes most to the overall uncertainty, followed by uncertainty in RRs and in baseline mortality rates, for most source–receptor pairs. The spread of model results is generally wider for PM2.5 (14 to 3974 % among source–receptor pairs) than for O3 (13 to 1065 %). The uncertainty in RRs for O3 mortality has a constant value (33 to 34 %) due to the fixed uncertainty range of RRs from Jerrett et al. (2009), whereas PM2.5 mortality leads to a wider range of uncertainty (1 to 247 %) in RRs because the uncertainty differs at different PM2.5 concentrations (Burnett et al., 2014). Low uncertainty in baseline mortality rate was found for most source–receptor pairs (< 20 %) except for the response of PM2.5 mortality in SAS to 20 % reduction from RBU (66 %).
3.4 Effect of sectoral reductions on mortality
Reducing global anthropogenic emissions by 20 % in three sectors (i.e., PIN, TRN, and RES) together avoids 48 500 (7100, 108 000) O3-related premature deaths and 243 000 (66 800, 357 000) PM2.5-related premature deaths globally (Tables 5–6), with the greatest number of avoided air-pollution-related premature deaths in highly populated areas (e.g., NAM, EUR, India, China) (Figs. 3–6). For instance, reducing anthropogenic emissions by 20 % in three sectors together avoids the highest number of O3-related deaths in SAS (24 000 (6000, 49 600) deaths per year) and PM2.5-related deaths in EAS (83 400 (29 400, 135 000) deaths per year). We compare our estimates of O3- and PM2.5-related premature deaths attributable to PIN, TRN, and RES emissions with previous studies by multiplying our results for 20 % emission reductions by 5 and by combining their sectors to nearly match each of the three sectors in this study (Table 7). Compared with Silva et al. (2016a), our estimate of O3- and PM2.5-related premature deaths attributable to PIN and TRN are very comparable, but that attributable to RES is lower here. In comparison with Lelieveld et al. (2015), we estimate greater O3- and PM2.5-related premature deaths attributable to PIN and TRN, but fewer for RES.
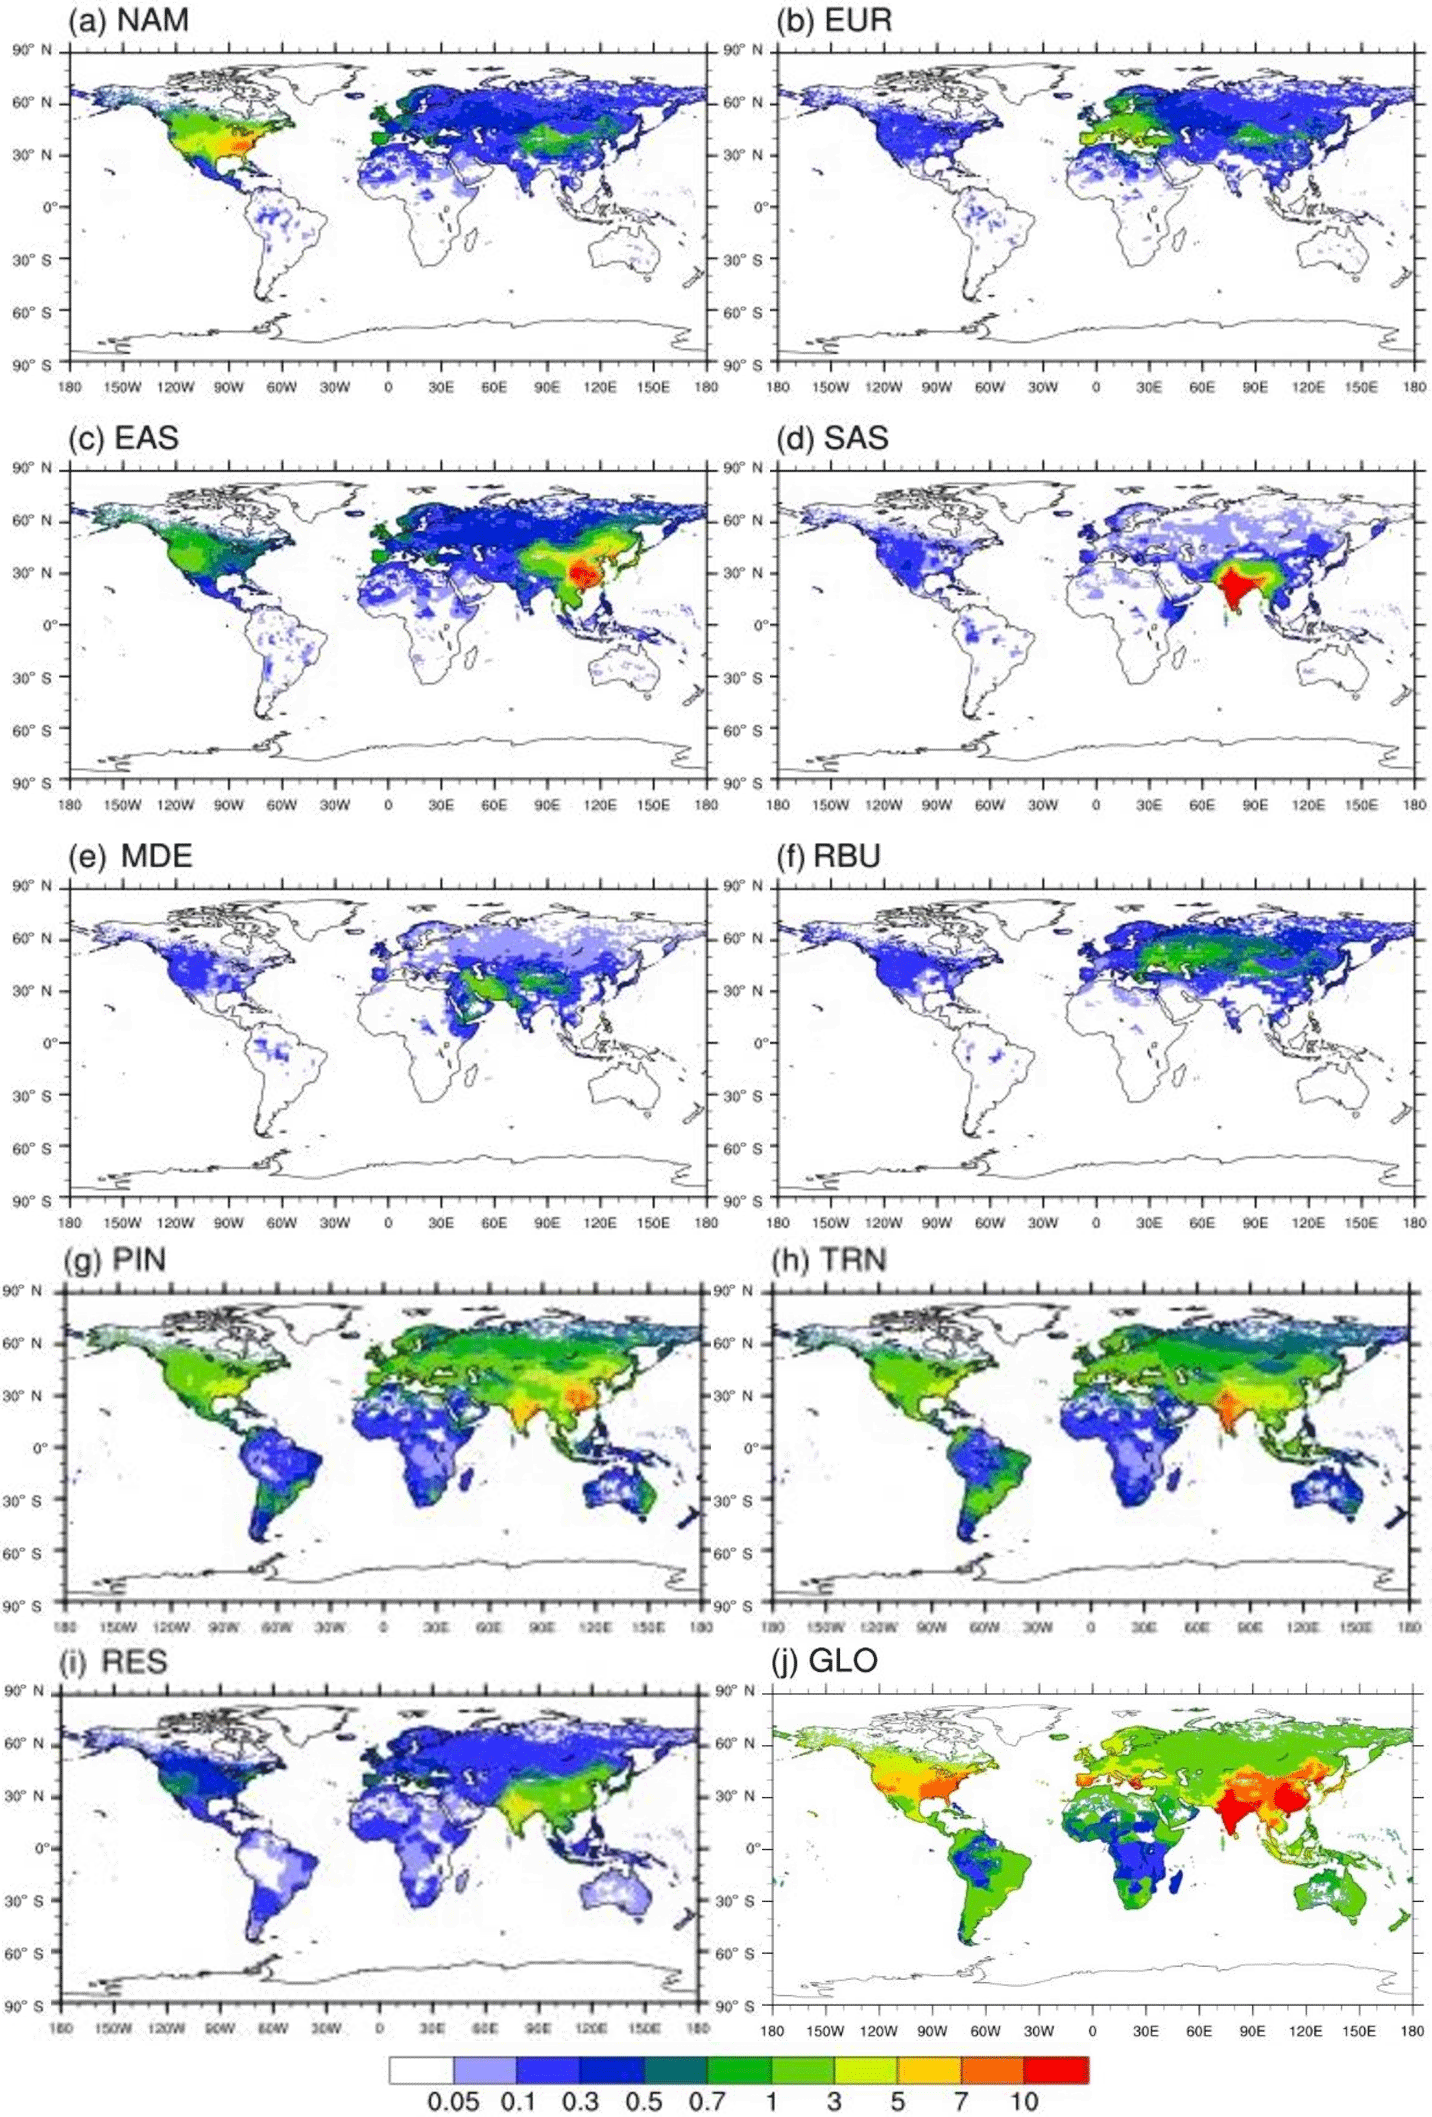
Figure 4Annual avoided O3-related premature deaths in 2010 per million people due to 20 % emission reduction scenarios relative to the base case in (a) North America (NAM), (b) Europe (EUR), (c) East Asia (EAS), (d) South Asia (SAS), (e) the Middle East (MDE), and (f) Russia–Belarus–Ukraine (RBU), the (g) power and industry (PIN), (h) transportation (TRN), and (i) residential (RES) sectors, and (j) globally (GLO).
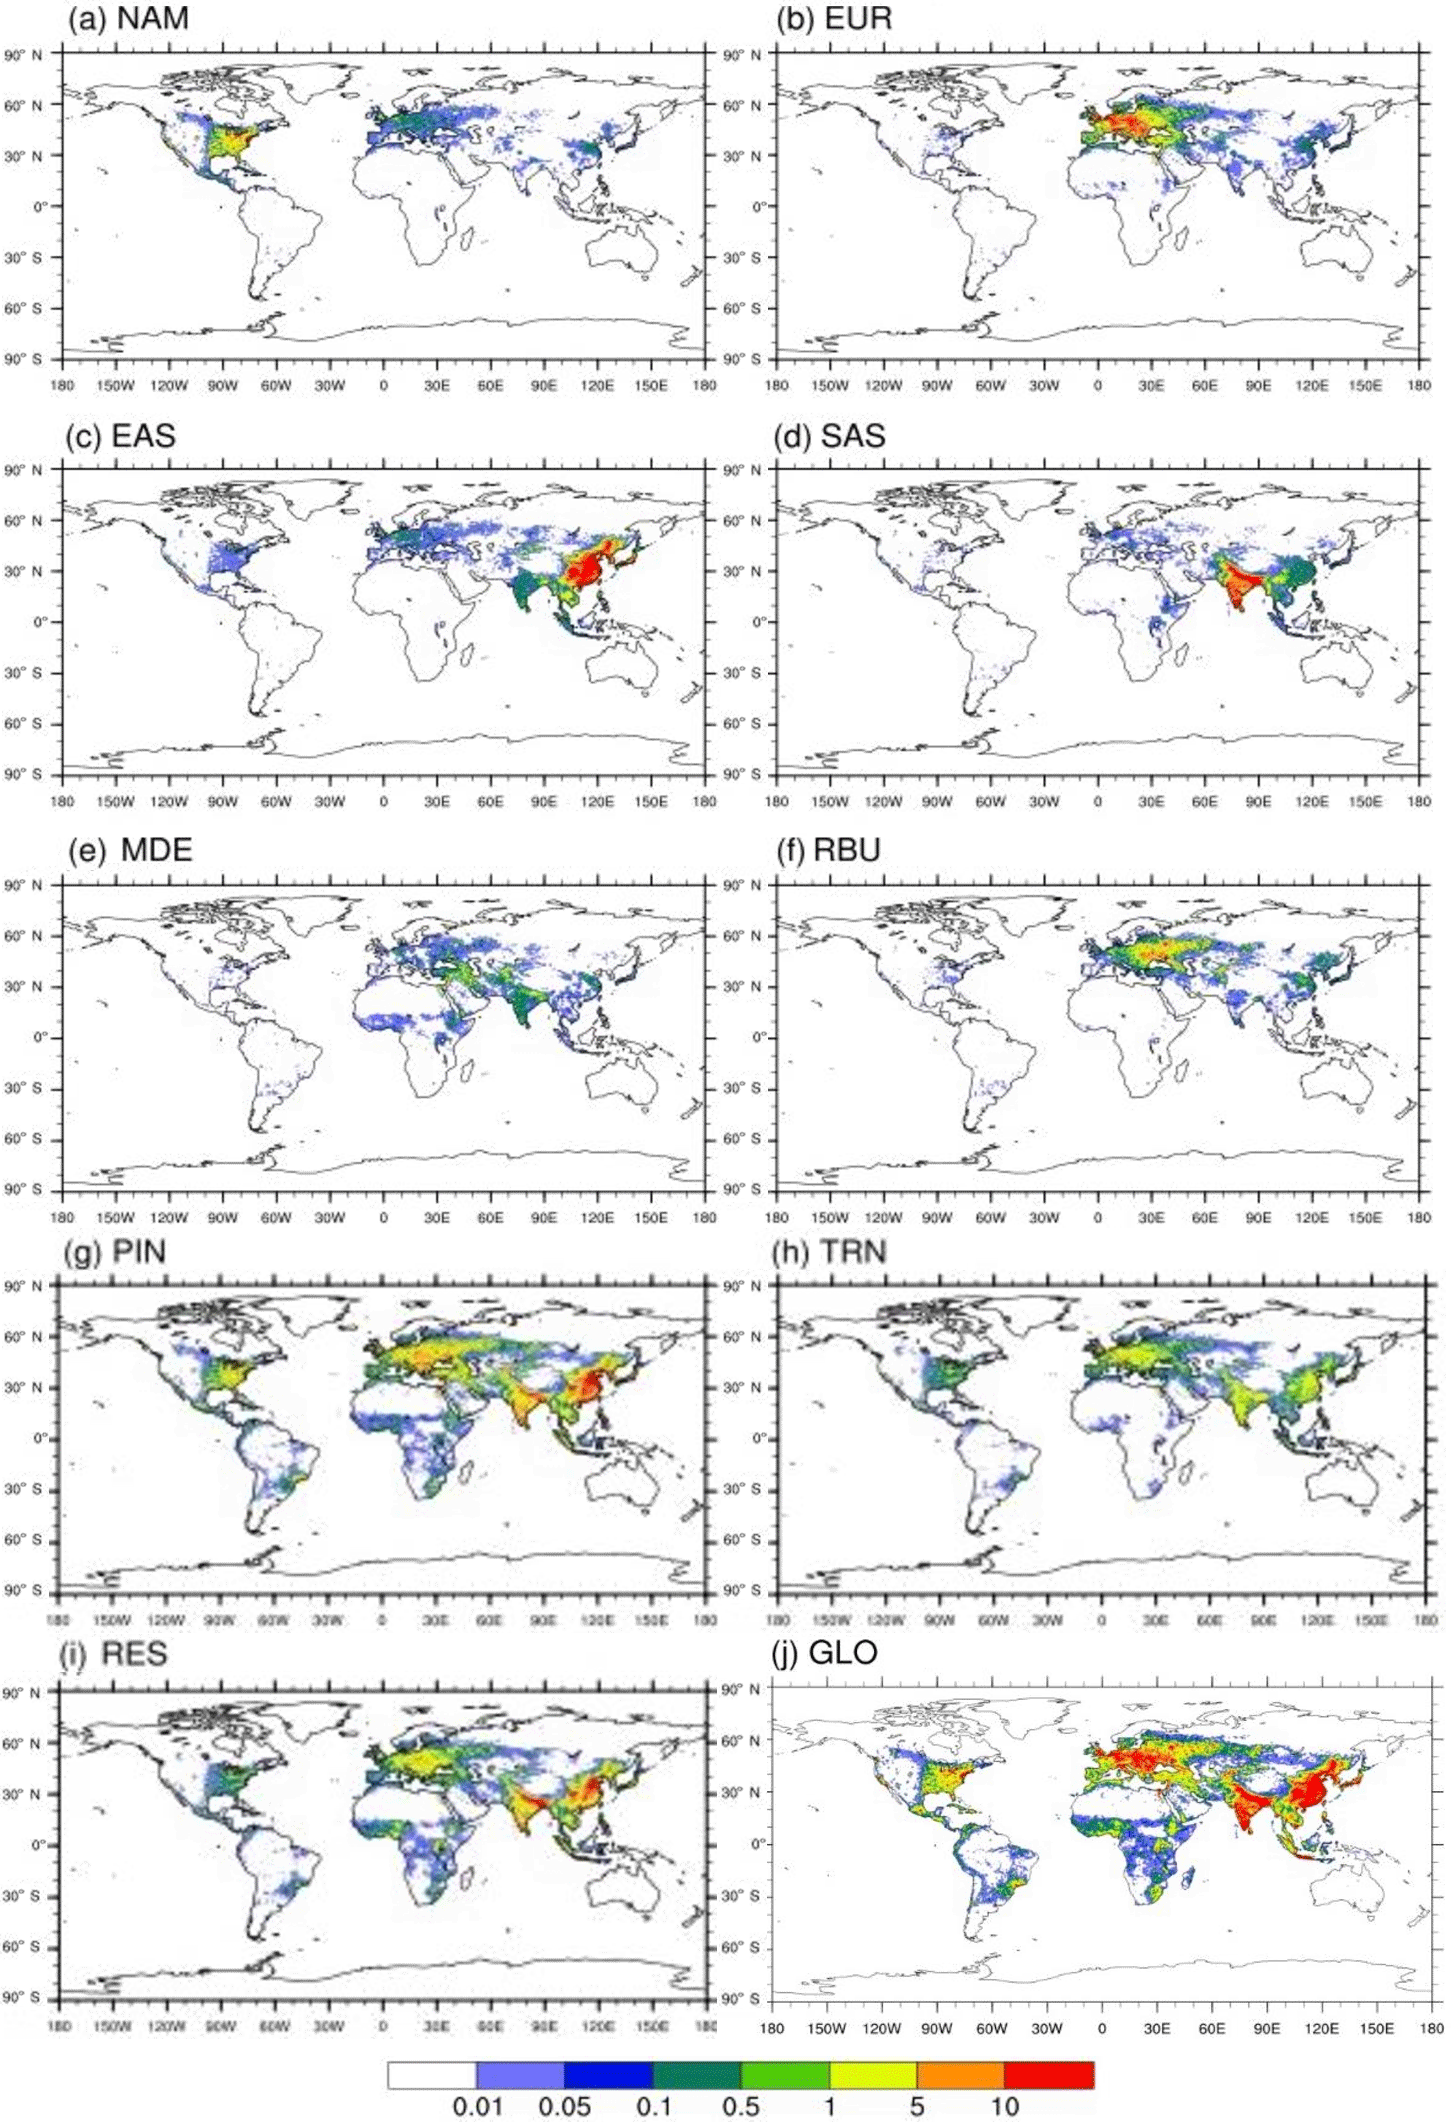
Figure 5Annual avoided PM2.5-related premature deaths in 2010 per 1000 km2 due to 20 % emission reduction scenarios relative to the base case in (a) North America (NAM), (b) Europe (EUR), (c) East Asia (EAS), (d) South Asia (SAS), (e) the Middle East (MDE), and (f) Russia–Belarus–Ukraine (RBU), the (g) power and industry (PIN), (h) transportation (TRN), and (i) residential (RES) sectors, and (j) globally (GLO).
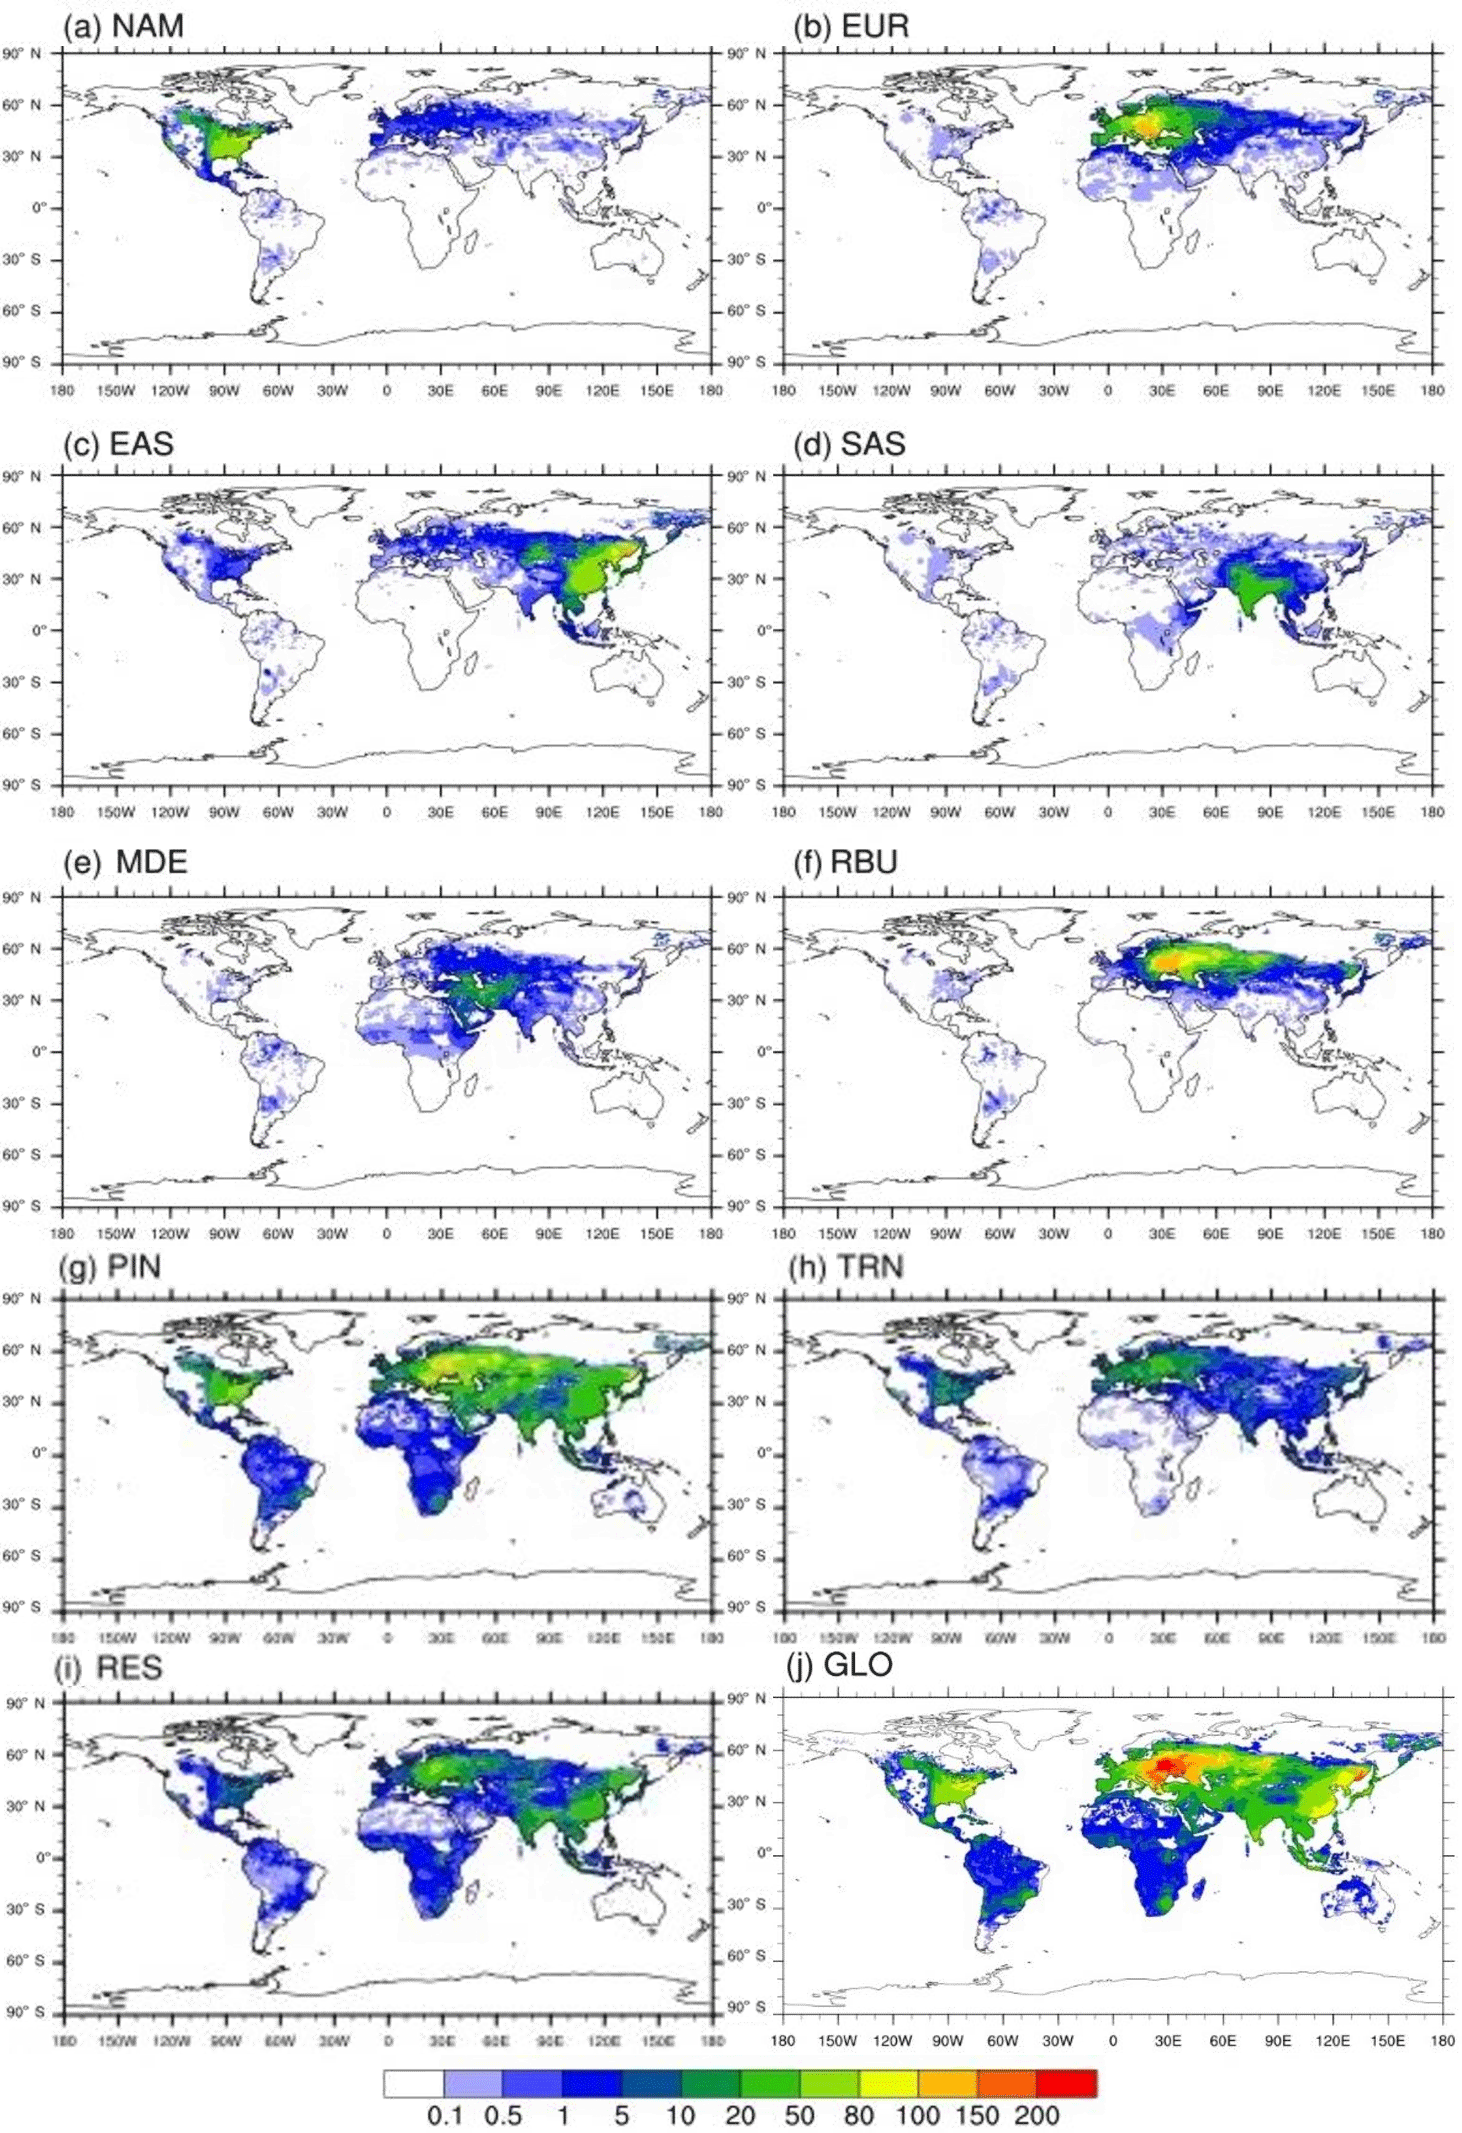
Figure 6Annual avoided PM2.5-related premature deaths in 2010 per million people due to 20 % emission reduction scenarios relative to the base case in (a) North America (NAM), (b) Europe (EUR), (c) East Asia (EAS), (d) South Asia (SAS), (e) the Middle East (MDE), and (f) Russia–Belarus–Ukraine (RBU), the (g) power and industry (PIN), (h) transportation (TRN), and (i) residential (RES) sectors, and (j) globally (GLO).
Table 7Comparison of O3- and PM2.5-related premature deaths attributable to PIN, TRN, and RES emissions with previous studies. Results from this study (for 20 % reductions) are multiplied by 5. For Silva et al. (2016), we combine results for “energy” and “industry” to represent PIN, and use “land transportation” to represent TRN and “residential & commercial” to represent RES. For Lelieveld et al. (2015), we combine the “power generation” and “industry” sectors to represent PIN, and use “land traffic” to represent TRN and “residential energy” to represent RES.
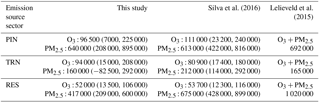
Like Silva et al. (2016a) and Lelieveld et al. (2015), different locations show relatively different mortality responses to changes in sectoral emissions. Whereas PIN emission reductions cause the greatest number of avoided O3-related premature deaths globally (19 300 (1400, 45 000) deaths per year), TRN emission reductions cause the greatest fraction of avoided deaths in most of the six regions (26–53 % of the global emission reduction), except for EAS (58 %) and RBU (38 %), where the effect of reducing PIN emissions dominates. In comparison with other studies (Table 7), our conclusion that PIN emissions cause the most O3-related deaths and TRN emissions cause the greatest fraction of avoided deaths in most regions agrees well with Silva et al. (2016a). For PM2.5, reducing PIN emissions avoids the most PM2.5-related premature deaths globally (128 000 (41 600, 179 000) deaths per year) and in most regions (38–78 % of the global emission reduction), except for SAS (45 %), where the RES emissions dominate. Although these findings differ from those of Lelieveld et al. (2015) and Silva et al. (2016), who find that RES emissions have the greatest impact on PM2.5 mortality globally and in most regions, all studies agree that PIN emissions have the greatest impact in NAM. Our result is also comparable with Crippa et al. (2017), who find that PIN emissions have the greatest health impact in most countries. Although comparable emission inventories are used (i.e., Lelieveld et al. (2015) and this study use EDGAR emissions while Silva et al. (2016) use RCP8.5 emissions), our lower mortality estimate for RES emissions may be explained by our 20 % reductions relative to the zero-out method and the different years simulated.
Considering results from individual models, we found that mortality from TRN emission reductions shows greater relative uncertainty than from PIN or RES (Tables 5–6 and S9–S10), reflecting a greater spread of results across models. Regional impacts from individual models also differ from the ensemble mean result – e.g., for O3, GEOS-Chem Adjoint and OsloCTM3.v2 show that reducing PIN emissions causes the greatest fraction of avoided O3-related deaths in EUR, while GEOS-Chem Adjoint, HadGM2-ES, and OsloCTM3.v2 show that TRN emissions have the greatest fraction of avoided O3-related deaths in RBU (Fig. S20). For PM2.5, CHASER_t42 and GEOS-Chem Adjoint show that reducing PIN emissions causes the greatest fraction of avoided PM2.5-related deaths in SAS (Fig. S21).
We aggregate the avoided deaths attributable to 20 % reductions from four corresponding source regions (i.e., NAM, EUR, SAS, and EAS) and compare with the findings from TF HTAP1. We estimate that these regional emission reductions are associated with 36 000 (−1500, 90 300) avoided deaths globally through the change in O3 and 207 000 (41 500, 304 000) avoided deaths through the change in PM2.5, more than those estimated by Anenberg et al. (2009, 2014) – 21 800 (10 600, 33 400) deaths for O3 and 192 000 (146 000, 230 000) deaths for PM2.5. This discrepancy might be attributed to different health impact functions, emission datasets, region definitions, updated population, or baseline mortality rates. In particular, for O3 respiratory mortality, we use a log-linear model for chronic mortality (Jerrett et al., 2009), instead of the short-term O3 mortality estimate based on a daily time series study (Bell et al., 2004) used by Anenberg et al. (2009). For PM2.5 mortality, Anenberg et al. (2014) only included the simulated changes in BC, particulate organic matter (POM = primary organic aerosol + secondary organic aerosol), and sulfate for PM2.5 concentration, while we use the total model-reported PM2.5 concentration, which includes more species for some models. We also apply the IER model (Burnett et al., 2014) for PM2.5, as opposed to the log-linear model of Krewski et al. (2009) used by Anenberg et al. (2014).
For regional reductions, our multi-model average results suggest that NAM and EUR emissions cause more deaths inside of those regions than outside, which disagrees with previous studies (Anenberg et al., 2009; Duncan et al., 2008; West et al., 2009b), whereas similar regional impacts are found for EAS and SAS. Also, total avoided deaths through interregional air pollution transport are estimated as 6000 (−3400, 15 500) deaths per year for O3 and 25 100 (8200, 35 800) deaths per year for PM2.5 in this study, in contrast with 7300 (3600, 11 200) deaths per year for O3 and 11 500 (8800, 14 200) deaths per year for PM2.5 in Anenberg et al. (2009, 2014). These differences likely result from different concentration response functions and the use of six regions here vs. four by Anenberg et al. (2009, 2014). In addition, updated atmospheric models and emission inputs, as well as different atmospheric dynamics in the single years chosen in TF HTAP1 vs. TF HTAP2 may contribute to the differences. In addition, updated atmospheric models and emission inputs, as well as different atmospheric dynamics in the single years chosen in HTAP vs. HTAP2 may contribute to the differences. Overall, whereas O3 accounts for a higher percentage of the total deaths in foreign regions than PM2.5, PM2.5 leads to more deaths in general, which agrees well with the results of Anenberg et al. (2009, 2014).
Using regional models in AQMEII3, driven by a single global model (C-IFS_v2), Im et al. (2018) estimated that 20 % domestic emission reductions would avoid 54 000 and 27 500 premature deaths (for O3 and PM2.5 combined) in Europe and the US, respectively, as opposed to ∼ 1000 and 2000 premature deaths due to foreign emission reductions. These results are comparable to our estimates that 32 900 and 19 500 premature deaths result from 20 % domestic emission reductions in Europe and the US, while 670 and 570 premature deaths result from foreign emission reductions. Although our defined US region is slightly bigger than Im et al. (2018), the majority of US emission sources and population are located within the region defined by Im et al. (2018). This comparison shows that regional and global models show similar impacts on mortality from air pollution transport.
Differences in our estimates of premature mortality attributable to air pollution from three emission sectors (multiplied by 5) may be explained by methodological differences relative to previous studies (Silva et al., 2016; Lelieveld et al., 2015), including our use of 20 % emission reductions versus the zero-out method in those studies, different emission inventories, a multi-model ensemble versus single models, and differences in baseline mortality rates, population, and concentration response functions. Our finding that TRN emissions contribute the most avoided deaths for O3 in most regions agrees well with the result by Silva et al. (2016a), but differs for PM2.5 mortality for which we find that PIN emissions cause the most deaths, while both Silva et al. (2016a) and Lelieveld et al. (2015) find that RES emissions are responsible for the most deaths. This discrepancy may be explained by different PM2.5 species included in individual models, as we showed that changes in PM2.5 concentration to TRN emission differ across models.
By using an ensemble of multi-model results here, we highlight the relative importance of different source–receptor pairs for mortality in a way that is more robust than using a single model, particularly since some individual models yielded different conclusions than the ensemble mean. The air pollutant concentration changes reported by the HTAP2 models may be different among models; it may result from a variety of processes, e.g., atmospheric physical and chemical mechanisms, processing of natural emissions, and transport time step (Table S1), but not anthropogenic emissions since those were nearly identical among models. In addition, the coarse model resolution used by global models may underestimate health effects by misaligning peak concentration and population, particularly in urban areas and for PM2.5 (Punger and West, 2013), but it is not known how model resolution would affect the relative contributions of extra-regional and intraregional health benefits. Future research should explore the possible bias from using coarse global models for extra-regional and intraregional mortality estimates in metropolitan regions by comparing with finer-resolution chemical transport models.
Another uncertainty in this paper (and other global studies) lies in applying the same RRs worldwide because of lack of long-term records of the chronic influences of ambient air pollution on mortality outside of NAM and EUR. We consider only the population of adults ≥ 25 years old, ignoring possible mortality effects on the younger population, and consequently we may underestimate premature mortality overall. Likewise, the effects of air pollution on several morbidity end points are omitted. We assume that all PM2.5 is equally toxic, for lack of clear evidence for greater toxicity of some species. Interregional transport may also change the toxicity of PM2.5 by changing the size distribution or chemical composition, where transport likely causes particles to become more oxidized (West et al., 2016). Future research on PM2.5-related mortality should include estimating health effects for different PM2.5 chemical components.
We estimate O3- and PM2.5-related premature mortality from simulations with 14 global chemistry transport models participating in the TF HTAP2 multi-model exercise for the year 2010. An estimate of 290 000 (30 000, 600 000) global premature O3-related deaths and 2.8 million (0.5 million, 4.6 million) global PM2.5-related premature deaths is obtained from the ensemble for the year 2010 in the baseline case. We focus on model experiments simulating 20 % regional air pollutant emission reductions (excluding methane) in six regions, three sectors, and one global domain. For regional scenarios, six source emission reductions altogether can cause 84 % of the global avoided O3-related premature deaths within the source region, ranging from 21 to 95 % among six regions, and 16 % (5 to 79 %) outside of the source region. For PM2.5, 89 % of global avoided PM2.5-related premature deaths are within the source region, ranging from 32 to 94 % among six regions, and 11 % (6 to 68 %) outside of the source region. While most avoided mortality generally occurs within the source region, we find that emission reductions from RBU (only for O3) and MDE (for both O3 and PM2.5) can avoid more premature deaths outside of these regions than within. Considering the effects of foreign emissions on receptor regions, 20 % foreign emission reductions lead to more avoided O3-related premature deaths in EUR, MDE, and RBU than domestic reductions. Reductions from all six regions in the transport of air pollution among regions are estimated to lead to more avoided deaths through changes in PM2.5 (25 100 (8200, 35 800) deaths per year) than for O3 (6000 (−3400, 15 500) deaths per year). For NAM and EUR, our estimates of avoided mortality from regional and extra-regional emission reductions are comparable to those estimated by regional models in AQMEII3 (Im et al., 2018) for these same emission reduction experiments. Overall, the spread of modeled air pollutant concentrations contributes most to the uncertainty in mortality estimates, highlighting that using a single model may lead to erroneous conclusions and may underestimate uncertainty in mortality estimates.
For sectoral emission reductions, reducing anthropogenic emissions by 20 % in three sectors together avoids 48 500 (7100, 108 000) O3-related premature deaths and 243 000 (66 800, 357 000) PM2.5-related premature deaths globally. Of the three sectors, TRN had the greatest fraction (26–53 %) of O3-related premature deaths globally and in most regions, except for EAS (58 %) and RBU (38 %) where PIN emissions dominate. For PM2.5 mortality, PIN emissions cause the most deaths in most regions (38–78 %), except for SAS (45 %) where RES emissions dominate.
In this study, we have gone beyond previous TF HTAP1 studies that quantified premature mortality from interregional air pollution transport by using more source regions, analyzing source emission sectors, and using updated atmospheric models and health impact functions. The estimate of air transport premature mortality could vary due to differences in exposure estimate (single model vs. ensemble model), health impact function, regional definitions, and grid resolutions. These discrepancies highlight uncertainty estimated by different methods in previous studies. Despite uncertainties, our results suggest that reducing pollution transported over a long distance would be beneficial for health, with impacts from all foreign emission reductions combined that may be comparable to or even exceed the impacts of emission reductions within a region. Additionally, actions to reduce emissions should target specific sectors within world regions, as different sectors dominate the health effects in different regions. This work highlights the importance of long-range air pollution transport and suggests that estimates of the health benefits of emission reductions on local, national, or continental scales may underestimate the overall health benefits globally, when interregional transport is accounted for. International cooperation to reduce air pollution transported over long distances may therefore be desirable.
Output from the TF-HTAP2 model experiments are available through the AeroCom servers (http://aerocom.met.no/data.html, Labonne et al., 2017).
Ozone ground level measurements can be accessed from the Tropospheric Ozone Assessment Report (TOAR) database at https://doi.pangaea.de/10.1594/PANGAEA.876108 (Schultz et al., 2018).
A full listing of PM2.5 ground measurement data sources can be accessed at https://pubs.acs.org/doi/suppl/10.1021/acs.est.5b03709/suppl_file/es5b03709_si_001.pdf (Brauer et al., 2016, accessible upon request).
Baseline mortality data are available from the Institute for Health Metrics and Evaluation (IHME) Global Burden of Disease Study 2010: (GBD 2010) – Ambient Air Pollution Risk Model 1990–2010 at http://ghdx.healthdata.org/record/global-burden-disease-study-2010-gbd-2010-ambient-air-pollution-risk-model-1990-2010 (Global Burden of Disease Study, 2010).
Population data are available from the Oak Ridge National Laboratory (ONRL) LandScan 2011 Global Population Dataset at https://landscan.ornl.gov/download (Oak Ridge National Laboratory (ONRL), 2011).
A detailed description of the models participating in the ensemble, a map of six priority regions used in this analysis, and additional results can be found in the Supplement.
The supplement related to this article is available online at: https://doi.org/10.5194/acp-18-10497-2018-supplement.
CKL collected all model output used in this study, performed health impact calculations, and wrote the paper. JJW conceived of the study and supervised CKL. RAS developed the health assessment code and preprocessed the required health input data. CAM-Chem model experiments were prepared by LE. CHASER_T42 and CHASER_T106 model experiments were prepared by KS and TS. C-IFS model experiments were prepared by JF. EMEPrv48 model experiments were prepared by JEJ. GEOS5 model experiments were prepared by HB, MC, and XP. GEOSCHEMADJOINT model experiments were prepared by DH and YD. GEOS-Chem model experiments were prepared by RJP. GFDL_AM3 model experiments were prepared by ML. GOCART model experiments were prepared by TK. HadGEM2-ES model experiments were prepared by GF. OsloCTM3.v2 model experiments were prepared by MTL. RAQMS model experiments were prepared by RBP and AL. SPRINTARS model experiments were prepared by TT. UI provided AQMEII3 regional ensemble model output for comparison. FJD and TJK coordinated HTAP2. All authors commented on drafts of the paper.
The authors declare that they have no conflict of interest.
This article is part of the special issue “Global and regional assessment of intercontinental transport of air pollution: results from HTAP, AQMEII and MICS”. It is not associated with a conference.
We sincerely acknowledge the contribution of modeling groups from the second
phase of Task Force on Hemispheric Transport of Air Pollutants (TF HTAP2).
This work was supported by a scholarship from the Taiwan Ministry of
Education, grants from NIEHS (1 R21 ES022600-01) and NASA (NNX16AQ30G and
NNX16AQ26G), funding from BEIS under the Hadley Centre Climate Programme
contract (GA01101) and from the European Union's Horizon 2020 research and
innovation program under grant agreement no. 641816 (CRESCENDO). The
National Center for Atmospheric Research is sponsored by the National Science
Foundation. We thank all scientists who made the ground-level observations available in the Tropospheric
Ozone Assessment Report (TOAR) database and the ground-level PM2.5 observation dataset for GBD2013, particularly
Owen Cooper and Michael Brauer, who gave us access to these data.
Edited
by: Gregory Carmichael
Reviewed by: two anonymous referees
Anenberg, S. C., West, J. J., Fiore, A. M., Jaffe, D. A., Prather, M. J., Bergmann, D., Cuvelier, K., Dentener, F. J., Duncan, B. N., Gauss, M., Hess, P., Jonson, J. E., Lupu, A., MacKenzie, I. A., Marmer, E., Park, R. J., Sanderson, M. G., Schultz, M., Shindell, D. T., Szopa, S., Vivanco, M. G., Wild, O., and Zeng, G.: Intercontinental Impacts of Ozone Pollution on Human Mortality, Environ. Sci. Technol., 43, 6482–6487, https://doi.org/10.1021/es900518z, 2009.
Anenberg, S. C., West, J. J., Yu, H., Chin, M., Schulz, M., Bergmann, D., Bey, I., Bian, H., Diehl, T., Fiore, A., Hess, P., Marmer, E., Montanaro, V., Park, R., Shindell, D., Takemura, T., and Dentener, F.: Impacts of intercontinental transport of anthropogenic fine particulate matter on human mortality, Air. Qual. Atmos. Hlth., 7, 369–379, https://doi.org/10.1007/s11869-014-0248-9, 2014.
Barrett, S. R., Britter, R. E., and Waitz, I. A.: Global mortality attributable to aircraft cruise emissions, Environ. Sci. Technol., 44, 7736–7742, https://doi.org/10.1021/es101325, 2010.
Bell, M. L., Ebisu, K., Leaderer, B. P., Gent, J. F., Lee, H. J., Koutrakis, P., Wang Y, Dominici F, and Peng, R. D: Associations of PM2.5 constituents and sources with hospital admissions: analysis of four counties in Connecticut and Massachusetts (USA) for persons ≥ 65 years of age, Environ. Health Persp., 122, 138, https://doi.org/10.1289/ehp.1306656, 2014.
Bell, M. L., Dominici, F., and Samet, J. M.: A meta-analysis of time-series studies of ozone and mortality with comparison to the national morbidity, mortality, and air pollution study, Epidemiology, 16, 436–445, 2005.
Bell, M. L., Zanobetti, A. F., and Dominici, F.: Who is more affected by ozone pollution? A systematic review and meta-analysis, Am. J. Epidemiol., 180, 15–28, https://doi.org/10.1093/aje/kwu115, 2014.
Bhalla, K., Shotten, M., Cohen, A., Brauer, M., Shahraz, S., Burnett, R., Leach-Kemon, K., Freedman, G., and Murray, C. J. L.: Transport for health: the global burden of disease from motorized road transport, Washington, DC: World Bank Group, 1, 39, 2014.
Brauer, M., Freedman, G., Frostad, J., Van Donkelaar, A., Martin, R. V., Dentener, F., Dingenen, R. V., Estep, K., Amini, H., Apte, J. S., Balakrishnan, K., Barregard, L., Broday, D., Feigin, V., Ghosh, S., Hopke, P. K., Knibbs, L. D., Kokubo, Y., Liu, Y., Ma, S., Morawska, L., Sangrador, J. L. T., Shaddick, G., Anderson, H. R., Vos, T., Forouzanfar, M. H., Burnett, R. T., and Cohen, A.: Ambient air pollution exposure estimation for the global burden of disease 2013, Envir. Sci. Tech., 50, 79–88, https://doi.org/10.1021/acs.est.5b03709, 2016.
Bright, E. A., Coleman, P. R., Rose, A. N., and Urban, M. L.: Land-Scan 2011, Oak Ridge National Laboratory SE, Oak Ridge, TN, USA, 2012.
Brook, R. D., Rajagopalan, S., Pope, C. A., Brook, J. R., Bhatnagar, A., Diez-Roux, A. V., Holguin, F., Hong, Y., Luepker, R. V., Mittleman, M. A., Peters, A., Siscovick, D., Smith Jr., S. C., Whitsel, L., Kaufman, J. D., and on behalf of the American Heart Association Council on Epidemiology and Prevention, Council on the Kidney in Cardiovascular Disease, and Council on Nutrition, Physical Activity and Metabolism: Particulate matter air pollution and cardiovascular disease: An update to the scientific statement from the American Heart Association, Circulation, 121, 2331–2378, https://doi.org/10.1161/CIR.0b013e3181dbece1, 2010.
Burnett, R. T., Arden Pope, C., Ezzati, M., Olives, C., Lim, S. S., Mehta, S., Shin, H. H., Singh, G., Hubbell, B., Brauer, M., Ross, Anderson, H., Smith, K. R., Balmes, J. R., Bruce, N. G., Kan, H., Laden, F., Prüss-Ustün, A., Turner, M. C., Gapstur, S. M., Diver, W. R., and Cohen, A: An integrated risk function for estimating the global burden of disease attributable to ambient fine particulate matter exposure, Environ. Health Persp., 122, 397, https://doi.org/10.1289/ehp.1307049, 2014.
Cohen, A. J., Brauer, M., Burnett, R., Anderson, H. R., Frostad, J., Estep, K., Balakrishnan, K., Brunekreef, B., Dandona, L., Dandona, R., Feigin, V., Freedman, G., Hubbell, B., Jobling, A., Kan, H., Knibbs, L., Liu, Y., Martin, R., Morawska, L., Pope III, C. A., Shin, H., Straif, K., Shaddick, G., Thomas, M., van Dingenen, R., van Donkelaar, A., Vos, T., Murray, C. J. L., and Forouzanfar, M. H: Estimates and 25-year trends of the global burden of disease attributable to ambient air pollution: an analysis of data from the Global Burden of Diseases Study 2015, The Lancet, 389, 1907–1918, https://doi.org/10.1016/S0140-6736(17)30505-6, 2017.
Chafe, Z. A., Brauer, M., Klimont, Z., Van Dingenen, R., Mehta, S., Rao, S., Riahi, K., Dentener, F., and Smith, K. R.: Household cooking with solid fuels contributes to ambient PM2.5 air pollution and the burden of disease, Environ. Health Persp., 122, 1314, https://doi.org/10.1289/ehp.1206340, 2014.
Chambliss, S., Silva, R., West, J., Zeinali, M., and Minjares, R.: Estimating source-attributable health impacts of ambient fine particulate matter exposure: global premature mortality from surface transportation emissions in 2005, Environ. Res. Lett., 9, 104009, https://doi.org/10.1088/1748-9326/9/10/104009, 2014.
Corbett, J. J., Winebrake, J. J., Green, E. H., Kasibhatla, P., Eyring, V., and Lauer, A.: Mortality from ship emissions: a global assessment, Environ. Sci. Technol., 41, 8512–8518, 2007.
Crippa, M., Janssens-Maenhout, G., Guizzardi, D., Van Dingenen, R., and Dentener, F.: Sectorial and regional uncertainty analysis of the contribution of anthropogenic emissions to regional and global PM2.5 health impacts, Atmos. Chem. Phys. Discuss., https://doi.org/10.5194/acp-2017-779, in review, 2017.
Dong, X., Fu, J. S., Zhu, Q., Sun, J., Tan, J., Keating, T., Sekiya, T., Sudo, K., Emmons, L., Tilmes, S., Jonson, J. E., Schulz, M., Bian, H., Chin, M., Davila, Y., Henze, D., Takemura, T., Benedictow, A. M. K., and Huang, K.: Long-range Transport Impacts on Surface Aerosol Concentrations and the Contributions to Haze Events in China: an HTAP2 Multi-Model Study, Atmos. Chem. Phys. Discuss., https://doi.org/10.5194/acp-2018-91, in review, 2018.
Dentener, F., Keating, T., and Akimoto, H. (Eds.): HTAP Hemispheric Transport of Air Pollution, Part A: Ozone and particulate matter, United Nations Publications, Geneva, Switzerland, 2010.
Doherty, R. M., Wild, O., Shindell, D. T., Zeng, G., MacKenzie, I. A., Collins, W. J., Fiore, A. M., Stevenson, D. S., Dentener, F. J., Schultz, M. G., Hess, P., Derwent, R. G., and Keating, T. J.: Impacts of climate change on surface ozone and intercontinental ozone pollution: A multi-model study, J. Geophys. Res.-Atmos., 118, 3744–3763, https://doi.org/10.1002/jgrd.50266, 2013.
Du, Y., Xu, X., Chu, M., Guo, Y., and Wang, J.: Air particulate matter and cardiovascular disease: the epidemiological, biomedical and clinical evidence, J. Thorac. Dis., 8, E8, https://doi.org/10.3978/j.issn.2072-1439.2015.11.37, 2016.
Duncan, B. N., West, J. J., Yoshida, Y., Fiore, A. M., and Ziemke, J. R.: The influence of European pollution on ozone in the Near East and northern Africa, Atmos. Chem. Phys., 8, 2267–2283, https://doi.org/10.5194/acp-8-2267-2008, 2008.
Fiore, A., Dentener, F. J., Wild, O., Cuvelier, C., Schultz, M. G., Hess, P., Textor, C., Schulz, M., Doherty, R. M., and Horowitz, L. W.: Multimodel estimates of intercontinental source-receptor relationships for ozone pollution, J. Geophys. Res., 114, D04301, https://doi.org/10.1029/2008JD010816, 2009.
Forouzanfar, M. H., Alexander, L., and Anderson, H. R., et al.: Global, regional, and national comparative risk assessment of 79 behavioural, environmental and occupational, and metabolic risks or clusters of risks, 1990–2015: a systematic analysis for the Global Burden of Disease Study 2015, The Lancet, 388, 1659–724, https://doi.org/10.1016/S0140-6736(16)31679-8, 2016.
Fry, M. M., Naik, V., West, J. J., Schwarzkopf, M. D., Fiore, A. M., Collins, W. J., Dentener, F. J., Shindell, D. T., Atherton, C., and Bergmann, D.: The influence of ozone precursor emissions from four world regions on tropospheric composition and radiative climate forcing, J. Geophys. Res., 117, D07306, https://doi.org/10.1029/2011JD017134, 2012.
Galmarini, S., Koffi, B., Solazzo, E., Keating, T., Hogrefe, C., Schulz, M., Benedictow, A., Griesfeller, J. J., Janssens-Maenhout, G., Carmichael, G., Fu, J., and Dentener, F.: Technical note: Coordination and harmonization of the multi-scale, multi-model activities HTAP2, AQMEII3, and MICS-Asia3: simulations, emission inventories, boundary conditions, and model output formats, Atmos. Chem. Phys., 17, 1543–1555, https://doi.org/10.5194/acp-17-1543-2017, 2017.
Global Burden of Disease Study 2010 (GBD 2010): Ambient Air Pollution Risk Model 1990–2010, Institute for Health Metrics and Evaluation (IHME), available at: http://ghdx.healthdata.org/record/global-burden-disease-study-2010-gbd-2010-ambient-air-pollution-risk-model-1990-2010 (last access: January 2015), 2010.
Gryparis, A., Forsberg, B., Katsouyanni, K., Analitis, A., Touloumi, G., Schwartz, J., Samoli, E., Medina, S., Anderson, H. R., Niciu, E. M., Wichmann, H. E., Kriz, B., Kosnik, M., Skorkovsky, J., Vonk, J. M., and Dortbudak, Z.: Acute effects of ozone on mortality from the “air pollution and health: a European approach” project, Am. J. Respir. Crit. Care Med., 170, 1080–1087, 2004.
Hamra, G. B., Guha, N., Cohen, A., Laden, F., Raaschou-Nielsen, O., Samet, J. M., Vineis, P., Forastiere, F., Saldiva, P., Yorifuji, T., and Loomis, D.: Outdoor particulate matter exposure and lung cancer: a systematic review and meta-analysis, Environ. Health Persp., 122, 906–911, https://doi.org/10.1289/ehp.1408092, 2014.
Heald, C. L., Jacob, D. J., Park, R. J., Alexander, B., Fairlie, T. D., Yantosca, R. M., and Chu, D. A.: Transpacific transport of Asian anthropogenic aerosols and its impact on surface air quality in the United States, J. Geophys. Res., 111, D14310, https://doi.org/10.1029/2005JD006847, 2006.
Huang, M., Carmichael, G. R., Pierce, R. B., Jo, D. S., Park, R. J., Flemming, J., Emmons, L. K., Bowman, K. W., Henze, D. K., Davila, Y., Sudo, K., Jonson, J. E., Tronstad Lund, M., Janssens-Maenhout, G., Dentener, F. J., Keating, T. J., Oetjen, H., and Payne, V. H.: Impact of intercontinental pollution transport on North American ozone air pollution: an HTAP phase 2 multi-model study, Atmos. Chem. Phys., 17, 5721–5750, https://doi.org/10.5194/acp-17-5721-2017, 2017.
Huang, M., Carmichael, G. R., Pierce, R. B., Jo, D. S., Park, R. J., Flemming, J., Emmons, L. K., Bowman, K. W., Henze, D. K., Davila, Y., Sudo, K., Jonson, J. E., Tronstad Lund, M., Janssens-Maenhout, G., Dentener, F. J., Keating, T. J., Oetjen, H., and Payne, V. H.: Impact of intercontinental pollution transport on North American ozone air pollution: an HTAP phase 2 multi-model study, Atmos. Chem. Phys., 17, 5721–5750, https://doi.org/10.5194/acp-17-5721-2017, 2017.
Im, U., Brandt, J., Geels, C., Hansen, K. M., Christensen, J. H., Andersen, M. S., Solazzo, E., Kioutsioukis, I., Alyuz, U., Balzarini, A., Baro, R., Bellasio, R., Bianconi, R., Bieser, J., Colette, A., Curci, G., Farrow, A., Flemming, J., Fraser, A., Jimenez-Guerrero, P., Kitwiroon, N., Liang, C.-K., Nopmongcol, U., Pirovano, G., Pozzoli, L., Prank, M., Rose, R., Sokhi, R., Tuccella, P., Unal, A., Vivanco, M. G., West, J., Yarwood, G., Hogrefe, C., and Galmarini, S.: Assessment and economic valuation of air pollution impacts on human health over Europe and the United States as calculated by a multi-model ensemble in the framework of AQMEII3, Atmos. Chem. Phys., 18, 5967–5989, https://doi.org/10.5194/acp-18-5967-2018, 2018.
Institute for Health Metrics and Evaluation (IHME): Global Burden of Disease Study 2010 (GBD 2010) Results by Cause 1990–2010, Seattle, United States: Institute for Health Metrics and Evaluation (IHME), 2012.
Ito, K., De Leon, S. F., and Lippmann, M.: Associations between Ozone and Daily Mortality: Analysis and Meta-Analysis, Epidemiology, 16, 446–457, 2005.
Janssens-Maenhout, G., Crippa, M., Guizzardi, D., Dentener, F., Muntean, M., Pouliot, G., Keating, T., Zhang, Q., Kurokawa, J., Wankmüller, R., Denier van der Gon, H., Kuenen, J. J. P., Klimont, Z., Frost, G., Darras, S., Koffi, B., and Li, M.: HTAP_v2.2: a mosaic of regional and global emission grid maps for 2008 and 2010 to study hemispheric transport of air pollution, Atmos. Chem. Phys., 15, 11411–11432, https://doi.org/10.5194/acp-15-11411-2015, 2015.
Jerrett, M., Burnett, R. T., Pope III, C. A., Ito, K., Thurston, G., Krewski, D., Shi, Y., Calle, E., and Thun, M.: Long-term ozone exposure and mortality, N. Engl. J. Med., 360, 1085–1095, https://doi.org/10.1056/NEJMoa0803894, 2009.
Krewski, D., Jerrett, M., Burnett, R. T., Ma, R., Hughes, E., Shi, Y., Turner, M. C., Pope III, C. A., Thurston, G., Calle, E. E., Thun, M. J., Beckerman, B., DeLuca, P., Finkelstein, N., Ito, K., Moore, D. K., Newbold, K. B., Ramsay, T., Ross, Z., Shin, H., and Tempalski, B.: Extended follow-up and spatial analysis of the American Cancer Society study linking particulate air pollution and mortality, Res. Rep. Health Eff. Inst., 5–114, discussion, 115-136, 2009.
Labonne M., Breon F. M., Schulz M.: AeroCom Database, AEROCOM, available at: http://aerocom.met.no/data.html (accessible upon request), last access: April 2017.
Leibensperger, E. M., Mickley, L. J., Jacob, D. J., and Barrett, S. R. H.: Intercontinental influence of NOx and CO emissions on particulate matter air quality, Atmos. Environ., 45, 3318–3324, https://doi.org/10.1016/j.atmosenv.2011.02.023, 2011.
Lelieveld, J., Evans, J. S., Fnais, M., Giannadaki, D., and Pozzer, A.: The contribution of outdoor air pollution sources to premature mortality on a global scale, Nature, 525, 367–371, https://doi.org/10.1038/nature15371, 2015.
Lepeule, J., Laden, F., Dockery, D., and Schwartz, J.: Chronic exposure to fine particles and mortality: an extended follow-up of the Harvard Six Cities study from 1974 to 2009, Environ. Health Perspect., 120, 965–970, https://doi.org/10.1289/ehp.1104660, 2012.
Levy, J. I., Chemerynski, S. M., and Sarnat, J. A.: Ozone exposure and mortality: an empiric bayes metaregression analysis, Epidemiology, 16, 458–468, 2005.
Lim, S. S., Vos, T., Flaxman, A. D., Danaei, G., Shibuya, K., Adair-Rohani, H., Amann, M., Anderson, H. R., et al.: A comparative risk assessment of burden of disease and injury attributable to 67 risk factors and risk factor clusters in 21 regions, 1990–2010: a systematic analysis for the Global Burden of Disease Study 2010, The Lancet, 380, 2224–2260, https://doi.org/10.1016/S0140-6736(12)61766-8, 2012.
Lin, M., Fiore, A. M., Horowitz, L. W., Cooper, O. R., Naik, V., Holloway, J., Johnson, B. J., Middlebrook, A. M., Oltmans, S. J., and Pollack, I. B.: Transport of Asian ozone pollution into surface air over the western United States in spring, J. Geophys. Res., 117, D00V07, https://doi.org/10.1029/2011JD016961, 2012.
Lin, M., Horowitz, L. W., Payton, R., Fiore, A. M., and Tonnesen, G.: US surface ozone trends and extremes from 1980 to 2014: quantifying the roles of rising Asian emissions, domestic controls, wildfires, and climate, Atmos. Chem. Phys., 17, 2943–2970, https://doi.org/10.5194/acp-17-2943-2017, 2017.
Liu, J., Mauzerall, D. L., and Horowitz, L. W.: Evaluating inter-continental transport of fine aerosols: (2) Global health impact, Atmos. Environ., 43, 4339–4347, https://doi.org/10.1016/j.atmosenv.2009.05.032, 2009a.
Liu, J., Mauzerall, D. L., Horowitz, L. W., Ginoux, P., and Fiore, A. M.: Evaluating inter-continental transport of fine aerosols: (1) Methodology, global aerosol distribution and optical depth, Atmos. Environ. 43, 4327–4338, https://doi.org/10.1016/j.atmosenv.2009.03.054, 2009b.
Malley, C. S., Henze, D. K., Kuylenstierna, J. C. I., Vallack, H. W., Davila, Y., Anenberg, S. C., Turner, M. C., and Ashmore, M. R.: Updated Global Estimates of Respiratory Mortality in Adults ≥ 30 Years of Age Attributable to Long-Term Ozone Exposure, Environ. Health Persp., 125, 1390, https://doi.org/10.1289/ehp.0901220, 2017.
Oak Ridge National Laboratory (ONRL): LandScan 2011 Global Population Dataset, East View Geospatial LandScan Global Archive, available at: https://landscan.ornl.gov/download (last access: January 2015), 2011.
Powell, H., Krall, J. R., Wang, Y., Bell, M. L., and Peng, R. D.: Ambient coarse particulate matter and hospital admissions in the Medicare Cohort Air Pollution Study, 1999–2010, Environ. Health Persp., 123, 1152, https://doi.org/10.1289/ehp.1408720, 2015.
Pope III, C. A., Burnett, R. T., Turner, M. C., Cohen, A., Krewski, D., Jerrett, M. et al.: Lung cancer and cardiovascular disease mortality associated with ambient air pollution and cigarette smoke: shape of the exposure–response relationships, Environ. Health Persp., 119, 1616, https://doi.org/10.1289/ehp.1103639, 2011.
Punger, E. M. and West, J. J.: The effect of grid resolution on estimates of the burden of ozone and fine particulate matter on premature mortality in the USA, Air. Qual. Atmos. Hlth., 6, 563–573, https://doi.org/10.1007/s11869-013-0197-8, 2013.
Schultz M. G., Schröder, S., Lyapina, O., Cooper, O., Galbally, I., Petropavlovskikh, I., et al.: Tropospheric Ozone Assessment Report: Database and Metrics Data of Global Surface Ozone Observations, Elem. Sci. Anth., 5, 58, https://doi.org/10.1525/elementa.244, 2017.
Schultz, M. G., Schröder, S., Lyapina, O., Cooper, O. R., Galbally, I., Petropavlovskikh, I., Schneidemesser, E. V., Tanimoto, H., Elshorbany, Y., Naja, M., Seguel, R. J., Dauert, U., Eckhardt, P., Feigenspan, S., Fiebig, M., Hjellbrekke, A.-G., Hong, Y.-D., Kjeld, P. C., Koide, H., Lear, G., Tarasick, D., Ueno, M., Wallasch, M., Baumgardner, D., Chuang, M.-T., Gillett, R., Lee, M., Molloy, S., Moolla, R., Wang, T., Sharps, K., Adame, J. A., Ancellet, G., Apadula, F., Artaxo, P., Barlasina, M. E., Bogucka, M., Bonasoni, P., Chang, L., Colomb, A., Cuevas-Agulló, E., Cupeiro, M., Degorska, A., Ding, A., Fröhlich, M., Frolova, M., Gadhavi, H., Gheusi, F., Gilge, S., Gonzalez, M. Y., Gros, V., Hamad, S. H., Helmig, D., Henriques, D., Hermansen, O., Holla, R., Hueber, J., Im, U., Jaffe, D. A., Komala, N., Kubistin, D., Lam, K.-S., Laurila, T., Lee, H., Levy, I., Mazzoleni, C., Mazzoleni, L. R., McClure-Begley, A., Mohamad, M., Murovec, M., Navarro-Comas, M., Nicodim, F., Parrish, D., Read, K. A., Reid, N., Ries, L., Saxena, P., Schwab, J. J., Scorgie, Y., Senik, I., Simmonds, P., Sinha, V., Skorokhod, A. I., Spain, G., Spangl, W., Spoor, R., Springston, S. R., Steer, K., Steinbacher, M., Suharguniyawan, E., Torre, P., Trickl, T., Weili, L., Weller, R., Xiaobin, X., Xue, L., and Zhiqiang, M.: Tropospheric Ozone Assessment Report, links to Global surface ozone datasets, PANGAEA, https://doi.org/10.1594/PANGAEA.876108, last access: March 2018.
Silva, R. A., West, J. J., Zhang, Y., Anenberg, S. C., Lamarque, J.-F., Shindell, D. T., Collins, W. J., Dalsoren, S., Faluvegi, G., Folberth, G., Horowitz, L. W., Nagashima, T., Naik, V., Rumbold, S., Skeie, R., Sudo, K., Takemura, T., Bergmann, D., Cameron-Smith, P., Cionni, I., Doherty, R. M., Eyring, V., Josse, B., MacKenzie, I. A., Plummer, D., Righi, M., Stevenson, D. S., Strode, S., Szopa, S., and Zeng, G.: Global premature mortality due to anthropogenic outdoor air pollution and the contribution of past climate change, Environ. Res. Lett., 8, 034005, https://doi.org/10.1088/1748-9326/8/3/034005, 2013.
Silva, R. A., Adelman, Z., Fry, M. M., and West, J. J.: The Impact of Individual Anthropogenic Emissions Sectors on the Global Burden of Human Mortality due to Ambient Air Pollution, Environ. Health Perspect., 124, 1776–1784, 2016a.
Silva, R. A., West, J. J., Lamarque, J.-F., Shindell, D. T., Collins, W. J., Dalsoren, S., Faluvegi, G., Folberth, G., Horowitz, L. W., Nagashima, T., Naik, V., Rumbold, S. T., Sudo, K., Takemura, T., Bergmann, D., Cameron-Smith, P., Cionni, I., Doherty, R. M., Eyring, V., Josse, B., MacKenzie, I. A., Plummer, D., Righi, M., Stevenson, D. S., Strode, S., Szopa, S., and Zengast, G.: The effect of future ambient air pollution on human premature mortality to 2100 using output from the ACCMIP model ensemble, Atmos. Chem. Phys., 16, 9847–9862, https://doi.org/10.5194/acp-16-9847-2016, 2016b.
Stieb, D. M., Szyszkowicz, M., Rowe, B. H., and Leech, J. A.: Air pollution and emergency department visits for cardiac and respiratory conditions: a multi-city time-series analysis, Environ. Health, 8, 25, https://doi.org/10.1186/1476-069X-8-25, 2009.
Stjern, C. W., Samset, B. H., Myhre, G., Bian, H., Chin, M., Davila, Y., Dentener, F., Emmons, L., Flemming, J., Haslerud, A. S., Henze, D., Jonson, J. E., Kucsera, T., Lund, M. T., Schulz, M., Sudo, K., Takemura, T., and Tilmes, S.: Global and regional radiative forcing from 20 % reductions in BC, OC and SO4 – an HTAP2 multi-model study, Atmos. Chem. Phys., 16, 13579–13599, https://doi.org/10.5194/acp-16-13579-2016, 2016.
Turner, M. C., Jerrett, M., Pope III, C. A., Krewski, D., Gapstur, S. M., Diver, W. R., Beckerman, B. S., Marshall, J. D., Su, J., Crouse, D. L., and Burnett, R. T: Long-Term Ozone Exposure and Mortality in a Large Prospective Study, Am. J. Resp. Crit. Care, 193, 1134–1142. https://doi.org/10.1164/rccm.201508-1633OC, 2016.
West, J. J., Naik, V., Horowitz, L. W., and Fiore, A. M.: Effect of regional precursor emission controls on long-range ozone transport – Part 1: Short-term changes in ozone air quality, Atmos. Chem. Phys., 9, 6077–6093, https://doi.org/10.5194/acp-9-6077-2009, 2009a.
West, J. J., Naik, V., Horowitz, L. W., and Fiore, A. M.: Effect of regional precursor emission controls on long-range ozone transport – Part 2: Steady-state changes in ozone air quality and impacts on human mortality, Atmos. Chem. Phys., 9, 6095–6107, https://doi.org/10.5194/acp-9-6095-2009, 2009b.
West, J. J., Cohen, A., Dentener, F., Brunekreef, B., Zhu, T., Armstrong, B., Bell, M. L., Brauer, M., Carmichael, G., Costa, D. L., Dockery, D. W., Kleeman, M., Krzyzanowski, M., Künzli, N., Liousse, C., Lung, S. C., Martin, R. V., Pöschl, U., Pope, C. A., Roberts, J. M., Russell, A. G., and Wiedinmyer, C: What we breathe impacts our health: improving understanding of the link between air pollution and health, Environ. Sci. Technol., 50, 4895–4904, https://doi.org/10.1021/acs.est.5b03827, 2016.
Wild, O. and Akimoto, H.: Intercontinental transport of ozone and its precursors in a three-dimensional global CTM, J. Geophys. Res., 106, 27729–27744, https://doi.org/10.1029/2000JD000123, 2001.
Young, P. J., Naik, V., Fiore, A. M., Gaudel, A., Guo, J., Lin, M., Neu, J., Parrish, D., Reider, H., Schnell, J., Tilmes, S., Wild, O., Zhang, L., Ziemke, J., Brandt, J., Delcloo, A., Doherty, R. M., Geels, C. ,Hegglin, M. I., Hu, L., Im, U., Kumar, R., Luhar, A., Murray, L., Plummer, D., Rodriguez, J., Saiz-Lopez, A., Schultz, M., Woodhouse, M. T., and Zeng, G: Tropospheric Ozone Assessment Report: Assessment of global-scale model performance for global and regional ozone distributions, variability, and trends, Elem. Sci. Anth., 6, 10, https://doi.org/10.1525/elementa.265, 2018.
Yu, H., Remer, L. A., Chin, M., Bian, H., Kleidman, R. G., and Diehl, T.: A satellite-based assessment of transpacific transport of pollution aerosol, J. Geophys. Res., 113, D14S12, https://doi.org/10.1029/2007JD009349, 2008.
Yu, H., Chin, M., West, J. J., Atherton, C. S., Bellouin, N., Bergmann, D., Bey, I., Bian, H., Diehl, T., and Forberth, G.: A multimodel assessment of the influence of regional anthropogenic emission reductions on aerosol direct radiative forcing and the role of intercontinental transport, J. Geophys. Res.-Atmos., 118, 700–720, https://doi.org/10.1029/2012JD018148, 2013.
Zhang, Q., Jiang, X., Tong, D., Davis, S. J., Zhao, H., Geng, G., Feng, T., Zheng, B., Lu, Z., and Streets, D. G.: Transboundary health impacts of transported global air pollution and international trade, Nature, 543, 705–709, https://doi.org/10.1038/nature21712, 2017.
The requested paper has a corresponding corrigendum published. Please read the corrigendum first before downloading the article.
- Article
(14155 KB) - Full-text XML
- Corrigendum
-
Supplement
(6975 KB) - BibTeX
- EndNote