the Creative Commons Attribution 4.0 License.
the Creative Commons Attribution 4.0 License.
 | 19 Jul 2018
Multi-year statistical and modeling analysis of submicrometer aerosol number size distributions at a rain forest site in Amazonia
Luciana Varanda Rizzo
Pontus Roldin
Joel Brito
John Backman
Erik Swietlicki
Radovan Krejci
Peter Tunved
Tukka Petäjä
Markku Kulmala
Paulo Artaxo
The Amazon Basin is a unique region to study atmospheric aerosols, given their relevance for the regional hydrological cycle and the large uncertainty of their sources. Multi-year datasets are crucial when contrasting periods of natural conditions and periods influenced by anthropogenic emissions. In the wet season, biogenic sources and processes prevail, and the Amazonian atmospheric composition resembles preindustrial conditions. In the dry season, the basin is influenced by widespread biomass burning emissions. This work reports multi-year observations of high time resolution submicrometer (10–600 nm) particle number size distributions at a rain forest site in Amazonia (TT34 tower, 60 km NW from Manaus city), between 2008 and 2010 and 2012 and 2014. The median particle number concentration was 403 cm−3 in the wet season and 1254 cm−3 in the dry season. The Aitken mode (∼ 30–100 nm in diameter) was prominent during the wet season, while the accumulation mode (∼ 100–600 nm in diameter) dominated the particle size spectra during the dry season. Cluster analysis identified groups of aerosol number size distributions influenced by convective downdrafts, nucleation events and fresh biomass burning emissions. New particle formation and subsequent growth was rarely observed during the 749 days of observations, similar to previous observations in the Amazon Basin. A stationary 1-D column model (ADCHEM – Aerosol Dynamics, gas and particle phase CHEMistry and radiative transfer model) was used to assess the importance of the processes behind the observed diurnal particle size distribution trends. Three major particle source types are required in the model to reproduce the observations: (i) a surface source of particles in the evening, possibly related to primary biological emissions; (ii) entrainment of accumulation mode aerosols in the morning; and (iii) convective downdrafts transporting Aitken mode particles into the boundary layer mostly during the afternoon. The latter process has the largest influence on the modeled particle number size distributions. However, convective downdrafts are often associated with rain and, thus, act as both a source of Aitken mode particles and a sink of accumulation mode particles, causing a net reduction in the median total particle number concentrations in the surface layer. Our study shows that the combination of the three mentioned particle sources is essential to sustain particle number concentrations in Amazonia.
- Article
(3624 KB) -
Supplement
(13854 KB) - BibTeX
- EndNote


The Amazon Basin contains some of the few continental areas in the world where aerosol number concentrations as low as 300–500 particles per cm−3 are routinely observed (Martin et al., 2010b). This concentration range represents an upper limit to the natural atmospheric particle loading before anthropogenic influence (Andreae, 2007). However, even the most preserved forest areas in the region are seasonally influenced by in-basin anthropogenic emissions resulting from the expansion of agriculture, logging and urbanization (Davidson et al., 2012), as well as out-of-basin long-range transport (Andreae et al., 2015). Characterization of Amazonian aerosols under clean and polluted conditions is a crucial part of understanding the biosphere–atmosphere dynamical processes and the ecosystem resilience to changes (Artaxo et al., 2013). Moreover, the intense tropical convective activity makes the Amazon Basin a relevant source of particles to the global atmosphere (Andreae et al., 2001; Andreae and Crutzen, 1997). In the last 20 years, there has been an effort to characterize atmospheric aerosols in Amazonia through intensive studies (Martin et al., 2010b). This work reports long-term observations of high time resolution aerosol property observations in central Amazonia. This activity was carried out as a part of the following projects: EUCAARI (European Integrated project on Aerosol Cloud Climate and Air Quality Interactions, Kulmala et al., 2011), AEROCLIMA (Direct and indirect effects of aerosols on climate in Amazonia and Pantanal, Artaxo et al., 2013) and GoAmazon2014/5 (Martin et al., 2016). In this work there is a special focus on submicrometer particle number size distributions.
Particle diameter and number concentration are key physical parameters, defining aerosol impacts on the climate and human health. The aerosol impact on climate is driven by its direct and indirect interaction with solar radiation (IPCC, 2014). One of the most fundamental properties of aerosol particles is their diameter, which strongly influences their ability to act as cloud condensation nuclei (CCN) (Dusek et al., 2006) and their interaction with radiation (Bohren and Huffman, 2008; McFiggans et al., 2006). Particle diameter also determines the spectral dependence of light scattered by the particles (Schuster et al., 2006). Furthermore, the ability of aerosol particles to penetrate into the human respiratory system is a function of particle size (Löndahl et al., 2008), and several studies have associated exposure to ambient aerosols with an increased risk of mortality (e.g., Pope and Dockery, 2006). Through particle number size distribution analysis, it is possible to investigate how the particle population is influenced by dynamical processes like primary emissions, transport, condensation, new particle formation, coagulation, dry and wet deposition and in cloud processing.
In Amazonia, organic carbon accounts for 60–70 % of particle mass in the fine mode (diameter <2.5 µm). The remaining fraction contains mainly soil dust particles, sulfate and elemental carbon (Martin et al., 2010b). Relative proportions of major components vary between the wet season, when clean conditions prevail, and the dry season, when the whole basin is affected by regional biomass burning emissions. The relative contribution of primary and secondary organic carbon particle sources in Amazonia is still under investigation, although observations indicate that secondary organic aerosols (SOA) play a major role in the fine mode particle chemical composition (Chen et al., 2009, 2015; Fuzzi et al., 2007; Pöschl et al., 2010). SOA is formed when volatile organic compounds (VOCs) are oxidized and produce low-volatility oxidation products. These products can either condense on preexisting particles (Pöhlker et al., 2012a) or contribute to new particle formation (NPF) and subsequent growth (Riipinen et al., 2012). The latter is an important source of particles, as well as CCN, to the global atmosphere (Kerminen et al., 2012; Spracklen et al., 2008, 2010).
NPF events are typically characterized by a fast increase in the number concentration of particles with diameters in the range of 1 to 3 nm, followed by their growth. Observations have shown that sulfuric acid, amines and organic vapor play a key role in the activation and subsequent growth of particle clusters (Almeida et al., 2013; Ehn et al., 2014; Kulmala et al., 2013; Paasonen et al., 2010). NPF events have been observed worldwide and in different environments (Kulmala et al., 2004), but several intensive experiments have shown that nucleation and subsequent particle growth is rare inside the boundary layer (BL) in Amazonia (Rissler et al., 2004; Rizzo et al., 2010; Zhou et al., 2002). Since the occurrence of NPF may depend on season and location (i.e., may vary depending on atmospheric conditions), short duration experiments cannot be conclusive about its frequency in Amazonia. The multi-year observations reported here confirm that NPF is uncommon, at least at this forest site in central Amazonia. Some hypotheses to explain the scarcity of NPF and subsequent growth events in the Amazon are as follows: (i) the concentration of inorganic precursors like SO2 and NH3 are relatively low, typically <0.1 ppb (Andreae et al., 1990; Rizzo, unpublished dataset) and <0.8 ppb (Trebs et al., 2004) in the wet season, respectively; (ii) NPF is inhibited by high emissions of isoprene (Kanawade et al., 2011; Kiendler-Scharr et al., 2009; Lee et al., 2016); (iii) NPF is inhibited by high relative humidity levels (Bonn and Moortgat, 2003; Hamed et al., 2011; Hyvönen et al., 2005); (iv) there are point sources of new particle formation, instead of regional sources, so that subsequent growth to the accumulation mode cannot be followed (Vana et al., 2008).
While NPF within the BL may not be a relevant source of fine mode particles in Amazonia, there are other possible sources to support the observed aerosol loadings during the wet season. Observations of submicrometer primary biological aerosols in Amazonia have been reported; these likely consist of individual bacterial cells, fragments of biological particles and droplets of organic and inorganic solutions ejected by plants and microorganisms (China et al., 2016; Elbert et al., 2007; Huffman et al., 2012; Krejci et al., 2005a; Pöhlker et al., 2012a). Another possible source is the downward transport of particles from above the BL, first suggested by Zhou et al. (2002). Observations reporting high concentrations of nucleation mode particles in the outflow of deep convective clouds in Amazonia (∼ 10 km height) (Krejci et al., 2003, Andreae et al., 2018) and of Aitken mode particles in the lower free troposphere (FT; ∼ 4–6 km height) (Krecji et al., 2003, 2005b, Wang et al., 2016) reinforce this hypothesis. While the origin of the nucleation mode particles in the outflow of deep convection clouds could be attributed to new particle formation from the oxidation of uplifted biogenic VOCs, which are favored by the low condensational sink and temperature typical of the upper troposphere (Andreae et al., 2018; Bianchi et al., 2016), the origin of the observed Aitken mode particles in the lower free troposphere is unclear. In cloud processing (e.g., Hoppel et al., 1994; Lee et al., 2004) in shallow convective clouds and particle formation through heterogeneous pathways (Jang et al., 2002; Lim et al., 2005; Limbeck et al., 2003) are possible mechanisms contributing to the presence of Aitken mode particles in the lower free troposphere. The downward transport of particles from the lower free troposphere to the BL can occur either through convective downdrafts (Wang et al., 2016), typically observed in Amazonia (Machado et al., 2004; Nunes et al., 2016), or through continuous entrainment. Previous studies reported heights of 1500 to 2500 km as the probable level of the origin of convective downdraft events in Amazonia (Betts et al., 2002; Schiro and Neelin, 2018). In this way, convective downdrafts could explain the transport of particles from the lower free troposphere into the BL; however the downward transport of particles from outflow regions of deep convective clouds is still uncertain, and requires more investigation.
In this paper, the seasonal and diurnal variability of submicrometer particle number size distributions in a forest site in Amazonia is presented. The most relevant particle sources, sinks and dynamical processes are investigated using a stationary 1-D column model (ADCHEM – Aerosol Dynamics, gas and particle phase CHEMistry and radiative transfer model) in addition to statistic tools, especially cluster and composite analysis.
2.1 Site description and supporting measurements
Particle number size distributions were measured at the Cuieiras forest reservation in central Amazonia. The reservation is surrounded by primary tropical forest areas within a radius of about 500 km, except for to the southeast, where Manus, a developing city with 1.8 million inhabitants (IBGE, 2015), is located (60 km away). Most of the time, the prevailing trade winds blow over vast expanses of intact tropical forest before reaching the measurement tower (TT34) ( S, W, 110 m a.s.l.). No biomass burning takes place in the reservation, but the site is affected by the regional transport of biomass burning pollutants, especially in the dry season (July–December). Occasionally, the Manaus urban plume reaches the site (Rizzo et al., 2013). Measurements were carried out in two periods: from February 2008 to July 2010, and from November 2012 to October 2014. Aerosol measurements were taken 10 m above the top of the canopy (39 m above ground) through inlet lines leading to an air conditioned container at ground level where particle analyzers were placed. The laminar-flow inlet had 50 % aerodynamic cutoffs of 4 nm and 7 µm for our flow conditions. All measurements were taken under low relative humidity (RH) conditions (30–40 %), assured by an automatic diffusion dryer (Tuch et al., 2009). Supporting aerosol measurements included particle absorption and scattering coefficients, and were made using a multi-angle absorption photometer (MAAP 5012, Thermo Inc.) and an integrating nephelometer (Model 3563, TSI Inc.), respectively. Housing for the researchers and a 60 kW diesel generator (that provided the power supply) were located 0.33 and 0.72 km to the west of the sampling site (downwind), respectively. A detailed description of the measurement site and surroundings can be found in Martin et al. (2010a).
In this work we define wet season as the period from January to June, and the dry season from July to December, in line with Rizzo et al. (2013). This definition may not be strictly correct from a climatological point of view, as the start date of each season changes from one year to the next, depending on precipitation patterns. Nevertheless, for the purpose of the current aerosol dataset interpretation, this is a reasonable choice. A detailed description of climatological conditions can be found in Marengo et al. (2001).
Meteorological parameters were measured at the K34 tower ( S, W, 130 m a.s.l.), which is located 1.6 km to the south of the aerosol sampling site, and is maintained by the National Institute for Amazonian Research (INPA). In this research, the terminology from Rissler et al. (2006) is adopted to define the BL structure into sublayers: the convective boundary layer (CBL), the nocturnal stable layer (NL) and the residual layer (RL). Variations in surface layer equivalent potential temperature (θe) were used as a proxy to the occurrence of downdrafts, using a method similar to Wang et al. (2016). First, θe time series were detrended by the subtraction of each seasonal mean value. Then, a time series of Δθe was determined by subtracting the detrended θe values from the seasonal mean diurnal cycle (Fig. S1 in the Supplement). In this way, Δθe refers to a deviation from the mean diurnal behavior; therefore if Δθe<0, it means that the observed θe is below the expected for that time of day and season. Decreases in θe have been associated with convective downdrafts in Amazonia, and with the transport of ozone to the surface (Betts et al., 2002; Gerken et al., 2016).
2.2 Particle number size distribution measurements
Three submicrometer particle spectrometer systems were used intermittently at the TT34 forest site. A custom-built scanning mobility particle sizer (SMPS) system, provided by the Aerosol Group at the Division of Nuclear Physics at Lund University, was operated between February 2008 and July 2010. The device consisted of a bipolar charger, a medium-long Vienna-type differential mobility analyzer (DMA) and a butanol-based condensation particle counter (CPC 3010, TSI Inc.). This system, here referred to as the Lund SMPS, provided particle number size distributions in the size range from 10 to 600 nm every 5 min, and was controlled through a LabVIEW 7.1 based program.
A TSI SMPS system (classifier model 3080, DMA model 3081 and CPC model 3010) operated in October 2008 and in July to October 2013. The system delivered particle number size distributions in the size range from 10 to 500 nm every 5 min. The Lund and TSI SMPS systems were intercompared between 4 and 16 October 2008, showing satisfactory linear correlations for the total number concentrations (slope = 0.89, R2=0.97) and the mean geometric diameters (slope = 0.85, R2=0.86). Median bin to bin ratios were within ±20 % in the 30 to 300 nm size range.
A custom-built differential mobility particle sizer (DMPS) system, provided by the Division of Atmospheric Sciences at Helsinki University, operated from November to December 2012 and in 2014. The system, operating with a butanol-based CPC (TSI Inc., 3772), provided particle number size distributions in the range of 6 to 800 nm every 10 min. High aerosol and sheath flow were used to measure particles in the 6 to 280 nm size range and low flows were used for the 280 to 800 nm particles. Particle number size distributions and total number concentrations were interchangeably measured using an automated bypass valve in every measurement cycle, which provided a means to validate the DMPS performance.
Ambient temperature and pressure were used to adjust particle number concentrations to standard temperature and pressure conditions (T=293.15 K, P=1013.25 hPa). The quality of particle number size distribution measurements essentially depends on the stability of sample and sheath air flow rates, as well as on the performance of the CPC (Wiedensohler et al., 2012). Concerning the CPC performance, butanol-based CPC counting efficiency decreases as water vapor condenses inside the saturator. Since this experiment was conducted in a remote area, which was not easily accessable, it was not possible to replace the butanol in the SMPS systems more frequently than once every 2–3 weeks. For data quality assurance, three CPCs, independent of SMPS systems, were intermittently operated: a TSI-3010, a TSI-3772 and a TSI-3782. The latter, a water-based CPC, showed a counting efficiency that was 20 % lower than the other models. Particle number concentrations measured by the independent CPCs were compared to the integrated particle number concentration from the size distributions, with satisfactory linear correlations (R2 ranged between 0.83 and 0.99). Only size distribution samples that corresponded to CPC/SMPS particle number concentration ratios within 1.0±0.2 were considered in this analysis. For the periods when CPC measurements were not available, data quality was assured via Mie scattering closure studies, which compared particle light scattering coefficients calculated from input size distributions against measured scattering coefficients.
Results from instrument intercomparison workshops indicate that, under controlled laboratory conditions, the particle number size distributions from 20 to 200 nm determined by mobility particle size design are within an uncertainty range of around ±10 % after correcting for internal particle losses (Wiedensohler et al., 2012). For particles in the 10–100 nm size range, Hornsby and Pryor (2014) report an agreement between several TSI SMPS systems and a TSI FMPS system (fast mobility particle sizer) of within ±30 % for particle number concentration and of within ±7.5 % for geometric mean diameter (Dpg). Those values can be considered a lower limit for the uncertainties in long-term field measurements, especially at locations with difficult maintenance conditions.
In total, 184 040 submicrometer particle number size spectra were measured between February 2008 and October 2014. It was detected that 2.4 % of the samples were contaminated by the previously mentioned diesel generator, and these were removed from the dataset. Contamination was detected based on fast variations of the particle number concentration (>100 % in 5 min) associated with northwestern winds (270–360∘).
2.3 Data processing
Particle size distribution data was interpolated to a common diameter sequence. Changes to the integrated particle number concentration remained below 0.5 %. Particle size distributions were fitted by a multimodal lognormal distribution function, described by the following equation:
where Dp is the particle diameter. Each of the n lognormal modes is characterized by three parameters: the mode number concentration (Ni), the mode geometric mean diameter () and the mode geometric standard deviation (σi). A script was developed to fit one to three lognormal modes to the measured particle number size distributions. The algorithm was based on the guidelines from Hussein et al. (2005). Initially, the algorithm decides between two or three modes' least squares fit based on the percent concentration of particles with diameters less than 40 nm and of particles with diameters greater than 100 nm. There are constraints for the mean geometric diameter of the first mode (maximum 25 nm) as well as for the geometric standard deviation of all modes (minimum 1.2 and maximum 2.1). The algorithm uses previous fitting parameters as a start point for the current fitting procedure. As a measure of fitting quality, the algorithm uses the root mean square error and a comparison between the integrated particle number concentrations calculated from the measured size distribution and from the fitted curve. The algorithm is able to reduce the number of modes if it detects superposition, based on mean geometric diameters and concentration ratios between adjacent modes. It is also able to increase the number of modes if it produces a major improvement of the fitting quality. As an indication of the successfulness of the algorithm, the average ratio between the integrated particle number concentration of the measured and the lognormal fitted size distributions was 0.99 with R2=1.0.
2.3.1 Cluster analysis
A clustering method was applied to the particle number size distribution data, in order to group particle size spectra with similar shapes and to unveil relationships with other variables, such as time of occurrence, season, local wind direction and particle absorption coefficient. For this reason, particle concentration variability was removed via the normalization of each size spectra with respect to its maximum concentration. Cluster analysis has been applied on particle number size distribution data in previous studies (e.g., Beddows et al., 2009; Dall’Osto et al., 2010; Tunved et al., 2004). Here, the MATLAB built-in function kmeans.m was used, which is available in the statistical package of version 2014a. This function uses a two-phase iterative algorithm to minimize the sum of point-to-centroid distances, summed over all clusters. Since this algorithm is very sensitive to outliers, these were omitted (0.13 % of samples), using a standard rule for outlier labeling (e.g., Hoaglin et al., 1986). The inner fences (f1 and f3) of the data were calculated using the interquartile range (Q3−Q1) as and , where Q1 is the first quartile and Q3 is the third quartile. As an illustration, these data fences correspond to the extremes of the whiskers in Fig. 1. The number of clusters was decided based on the Dunn index, which is the ratio between the minimal inter-cluster distance to the maximal intra-cluster distance. Figure S2 shows the Dunn index as a function of the number of clusters, in which a decreasing trend is observed. The decision to use seven clusters was made based on the competing need to have a high Dunn index and an ensemble of cluster centroids representing a variety of particle number size distribution shapes.
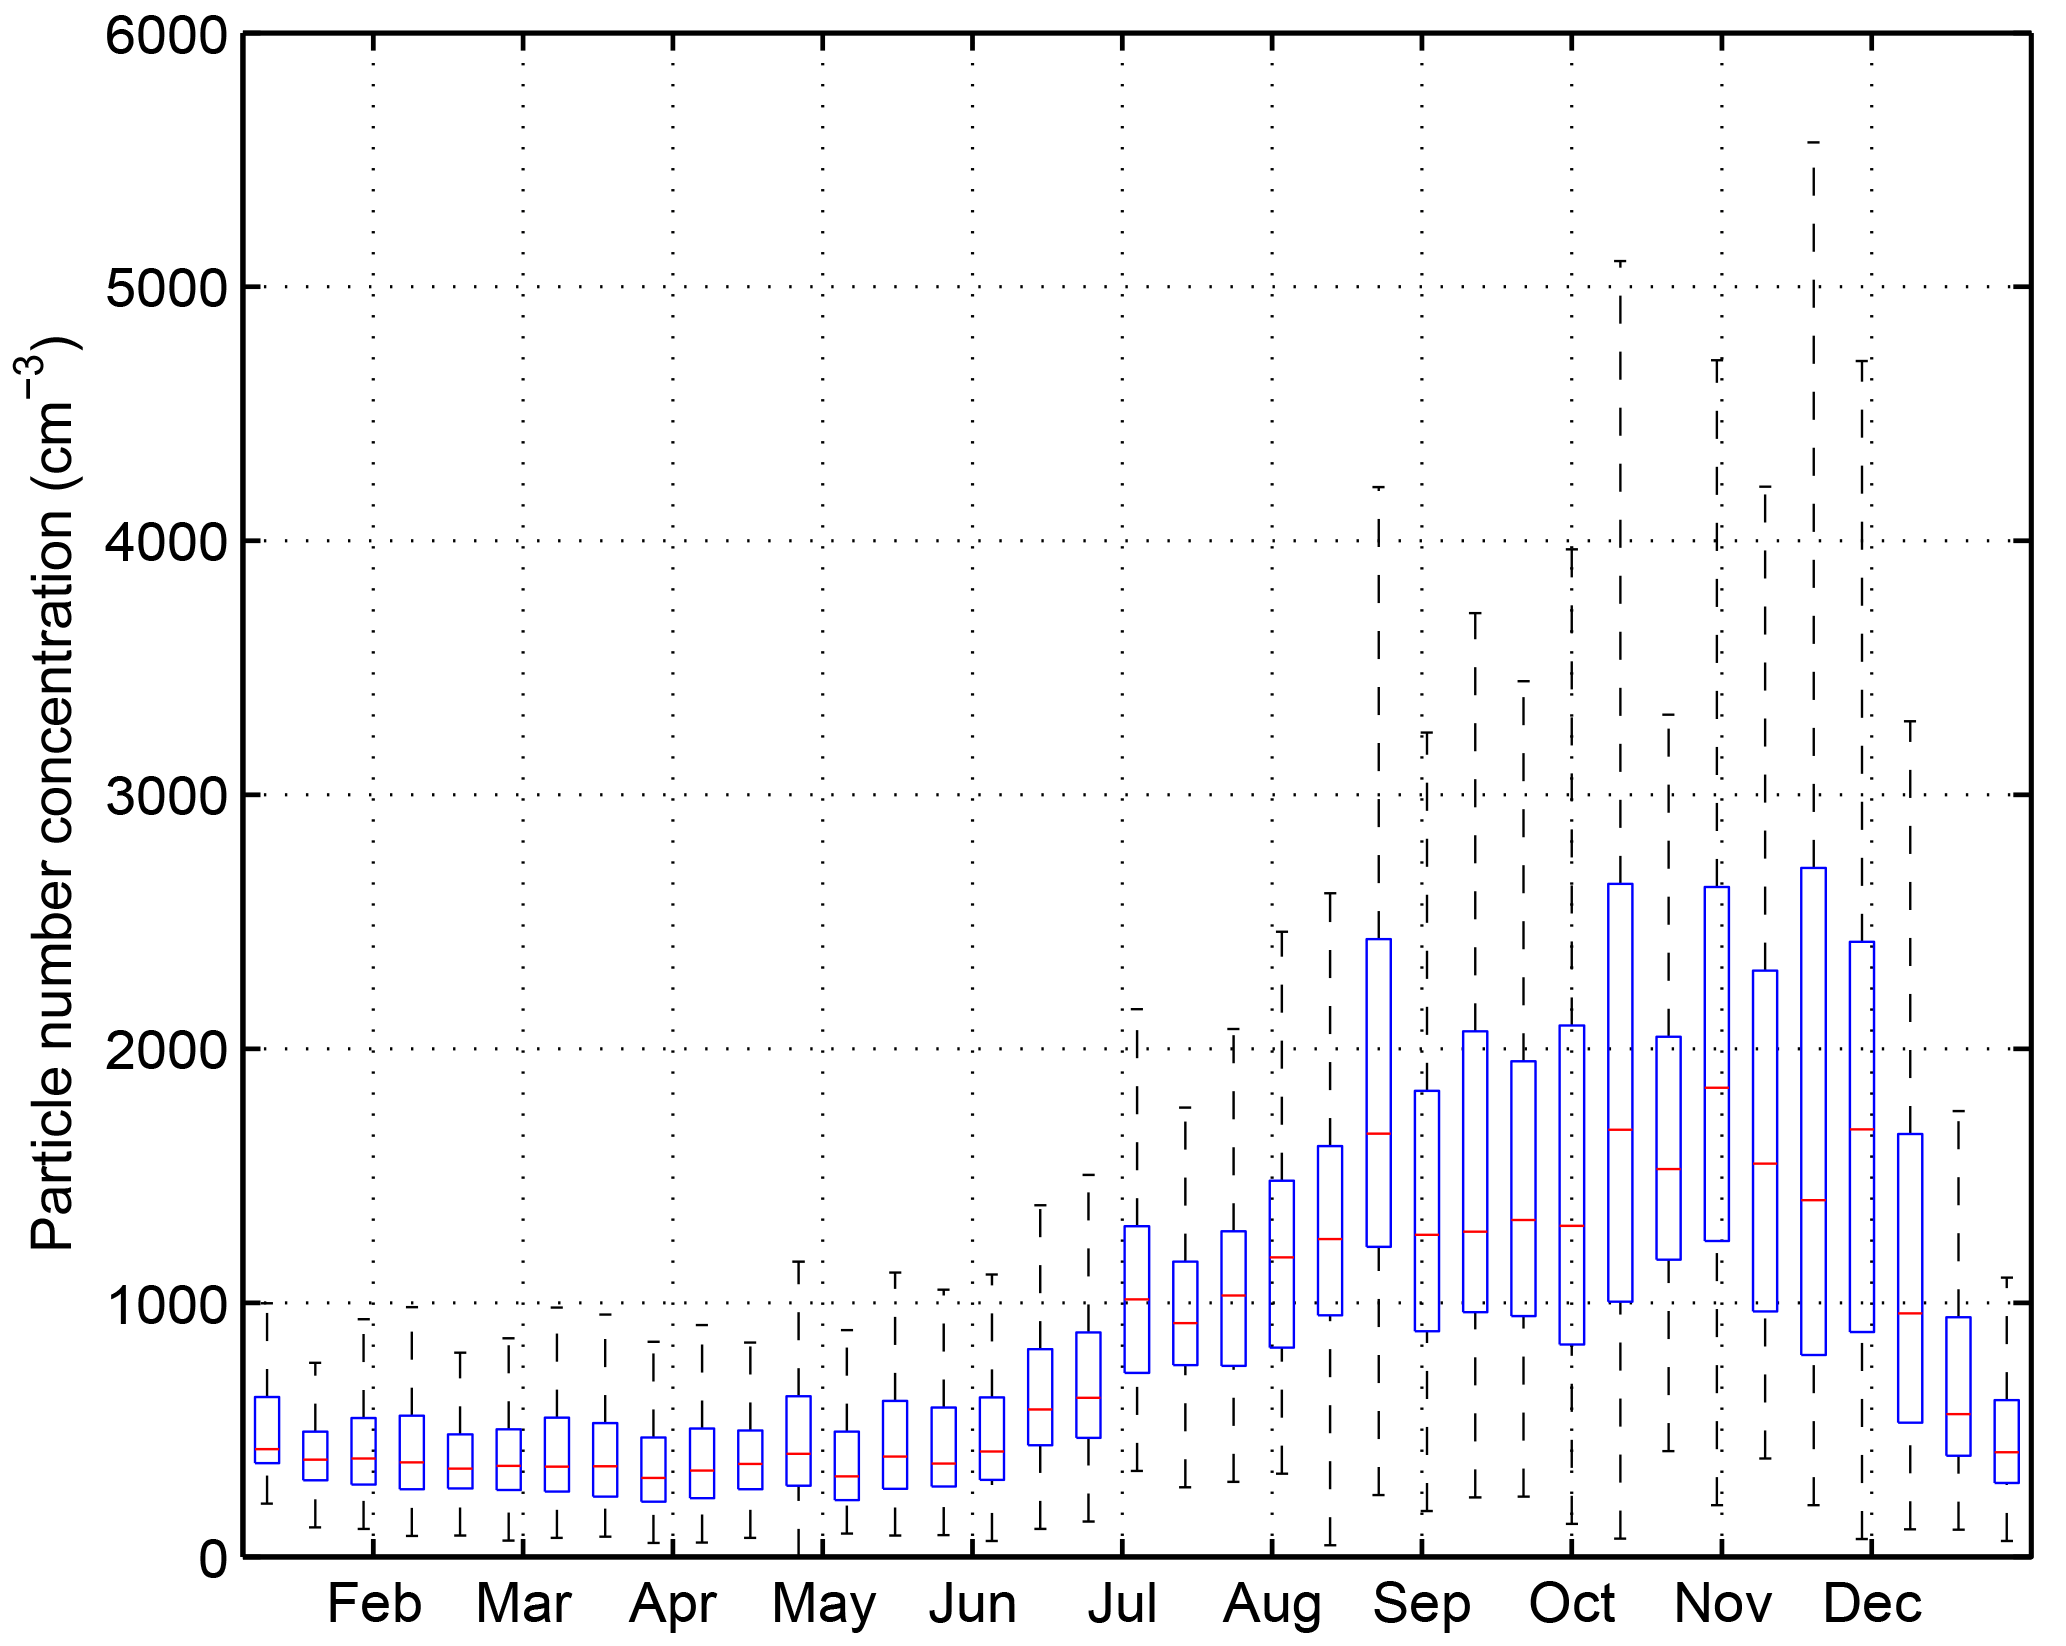
Figure 1Statistics for a 10-day window for particle number concentrations between 2008 and 2014. The dataset is a combination of particle number concentration measurements and integrated particle size distribution measurements (10–600 nm). The red line represents the median, the extremes of the blue boxes represent the 25 and 75 percentiles and the black whiskers extend to the most extreme data points that are not considered outliers.
2.4 Modeling the seasonal and diurnal variability
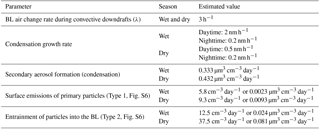
Process based modeling was used to analyze the extent to which the observed median diurnal particle number size distribution evolution at the surface was influenced by (i) aerosol dynamic processes (condensation and coagulation), (ii) dry deposition, (iii) below cloud scavenging, (iv) surface emissions of primary particles, (v) downward transport of aerosol particles into the CBL, (vi) dilution during the CBL development and (vii) transport of new particles from the FT into the CBL during convective downdrafts connected to strong precipitation events (Wang et al., 2016). ADCHEM (Aerosol Dynamics, gas and particle phase CHEMistry and radiative transfer model (Hermansson et al., 2014; Öström et al., 2017; Roldin et al., 2011) was implemented as a stationary 1-D column model for the measurement site. In the model, the lower atmosphere was divided into 50 vertical layers, each 50 m thick, extending from the surface up to 2500 m a.g.l. The vertical mixing was simulated with the first-order closure scheme (K-theory), represented by a turbulent diffusion process. The vertical turbulent diffusion coefficient (K) was calculated based on a slightly modified Grisogono scheme (Jericevic et al., 2010), in which the vertical K-profile depends on the friction velocity and height of the planetary boundary layer (Öström et al., 2017). Gas–particle partitioning of condensable vapors was not explicitly simulated. Instead, we used a particle size independent condensation growth rate (GR) as an unknown model fitting parameter, keeping the growth rate constant throughout the vertical column. The below cloud scavenging of particles in the whole vertical model domain (0–2500 m) was modeled using the size-resolved precipitation scavenging parameterization from Laakso et al. (2003) as a function of the precipitation intensity.
As model input we used median dry and wet season diurnal cycles of meteorological parameters for the years 2008 and 2009, obtained from the Global Data Assimilation System (GDAS), downloaded from the NOAA Air Resource Laboratory Real-time Environmental Application and Display sYstem (READY) (Rolph, 2016). Median diurnal cycles of BL height, horizontal momentum flux, sensible heat flux, temperature, RH and horizontal wind speed vertical profiles are shown in Figs. S3 and S4. The probability of rainfall intensity (fi) was obtained from observations at the K34 tower (Fig. S5) and grouped into 13 histogram bins representing rainfall with intensities from 0.1 to 30 mm h−1. The effect of below cloud scavenging of particles in size bin j was calculated using the probability distribution of rainfall intensity:
where Δt is the model time step in seconds, Nj,t and are the particle number concentrations in size bin j at time t and t−Δt, respectively, and βi,j is the precipitation scavenging rate coefficient (unit: s−1) for rainfall with intensity i and particles in size bin j. fi represents the probability of rainfall intensity. In this way, the modeled particle population is always affected by rainfall of different intensities, but to a much smaller extent (fi≪1) than during a specific rain event with an intensity i for which fi=1.
In order to mimic the observed diurnal behavior of particle number size distributions we included three different particle source types (Fig. S6): (Type 1) an evening and nighttime source of mainly Aitken and accumulation mode particles within the surface layer, (Type 2) a source of accumulation mode particles entrained from the FT or from the RL into the CBL, and (Type 3) a source of mainly Aitken mode particles transported into the CBL with convective downdrafts following after intense rainfall events (Wang et al., 2016).
The downward vertical transport of particles into the BL was not modeled explicitly. Instead, this process was parameterized by adding an exchange rate of particles from the BL with particles from the FT (Eq. 3):
where is the rate of change of the particle number concentration in size bin j; λ is an estimated median BL air exchange rate due to convective downdrafts; fdwnd is the probability of convective downdraft, which was estimated to be equal to the probability of precipitation with an intensity greater than 5 mm h−1 occurring one hour earlier; and Ndwnd,j is the concentration of particles in size bin j in the downdraft. Equation (3) was applied to all vertical model layers within the BL.
Table 1Frequency of occurrence, median and 10th and 90th percentiles for particle number size distribution parameters during the wet and dry seasons. Total particle number concentration (Ntotal) and surface area were integrated from 10 to 600 nm particle size distributions. Particle concentration (N), geometric mean diameter (Dpg) and geometric standard deviation (σ) are shown for the lognormal modes fitted to the size distribution samples: nucleation, Aitken and accumulation modes. The wet season period was defined as January–June, and the dry season period was defined as July–December.
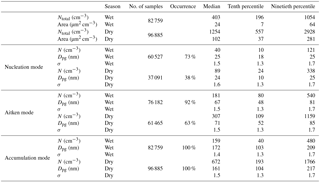
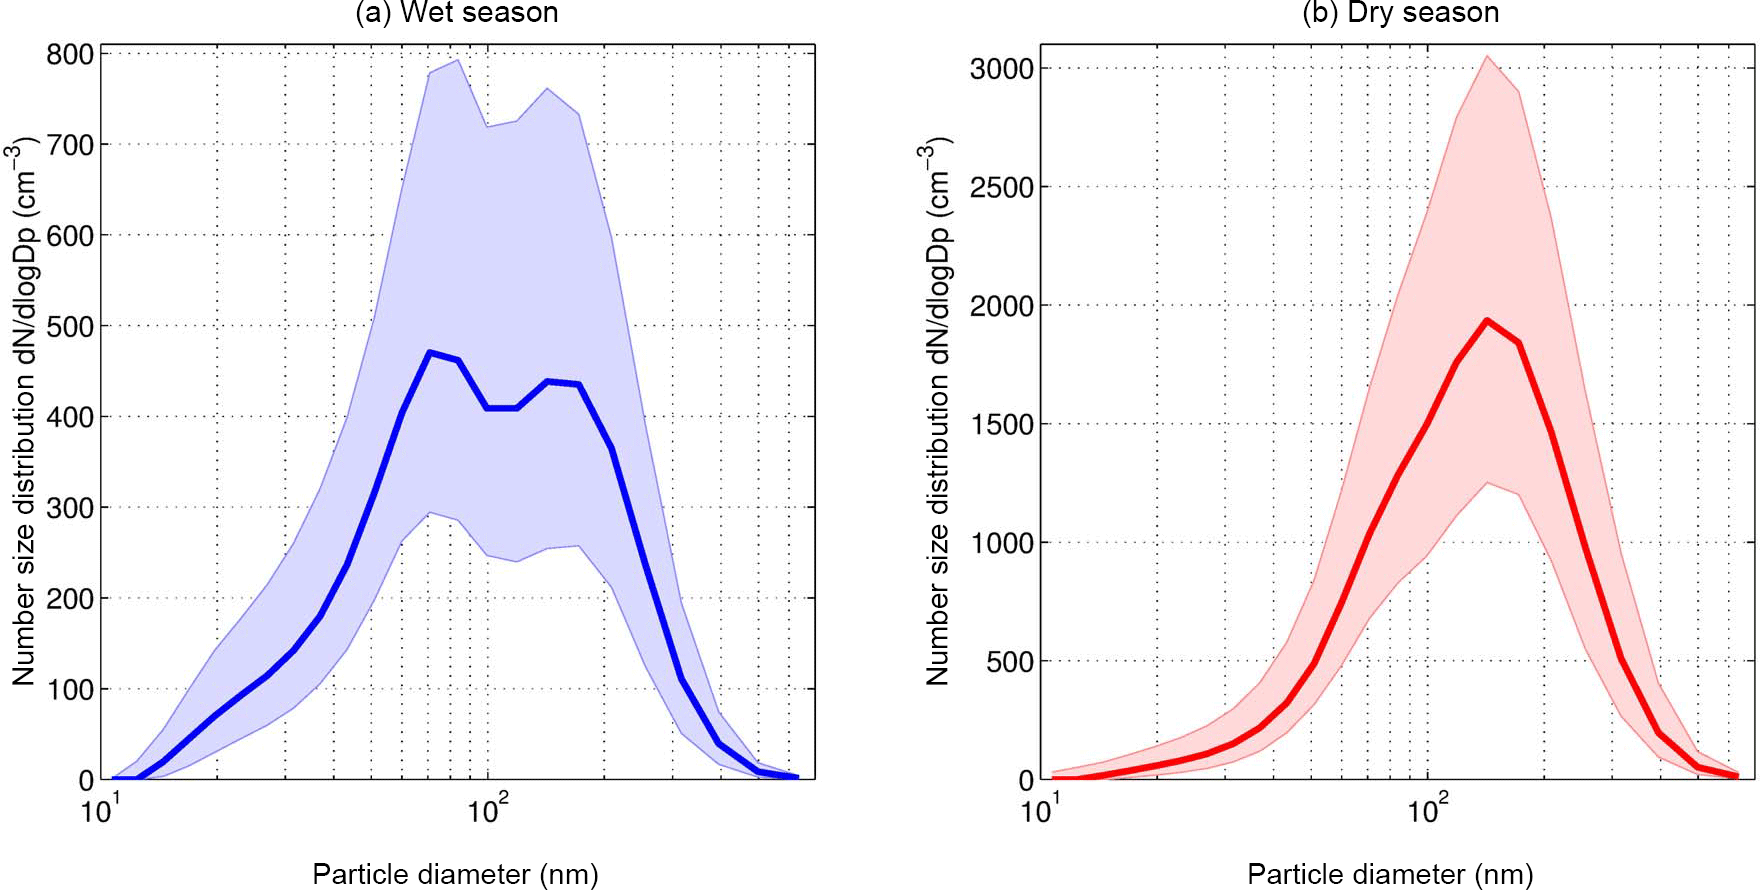
Figure 2Median particle number size distributions for the (a) wet and (b) dry season. Shadows represent the 25th–75th percentile range.
The model was initiated with the observed median particle number size distribution at noon for all model layers, and was set to simulate the diurnal particle number size distribution evolution during 10 consecutive days with identical meteorological conditions and particle sources. The 10-day model period with identical diurnal conditions was used in order to ensure that the modeled particle number size distributions reached a steady state, without any noticeable impact from the initial model conditions or variations from one day to another. Model fitted parameters, such as particle source strengths and condensation growth rates, were determined in order to reproduce the observed median diurnal trends in the particle number size distributions. In Sect. 3.2 we present results from the 10th simulation day and compare the model results with the observed median particle properties during wet and dry seasons.
It should be mentioned that the model system cannot be fully constrained and different combinations of parameter values can generate similar results. Therefore, the combination of parameters is not only based on the optimal agreement between model and observations, but also on the physical credibility of the parameter values. Choices were made in this way; for example, adopting lower growth rates (GR) during nighttime and during the dry season, when the condensation sink is substantially larger than during the wet season. The GR used in the model is lower than the median value of 5.5 nm h−1 derived from the observed NPF events (Sect. 3.4). This is reasonable because NPF event days are typically characterized by higher growth rates (e.g., Hyvönen et al., 2005).
3.1 Seasonal variability of submicrometer particle size spectra
Submicrometer particle number size spectra were measured between February 2008 and October 2014 and consisted of 179644 valid samples. Forty-six percent of these samples were from the wet season (January to June) and fifty-four percent were from the dry season (July to December), comprising 749 days of observations. Figure 1 shows an annual cycle in particle number concentrations observed between 2008 and 2014, which clearly depicts the seasonal variability. During the wet season, pristine conditions prevailed, with a median particle number concentration of 403 (196–1054) cm−3 (the values in parentheses are the 10th and 90 percentiles) (Table 1). These values are similar to previously reported observations for this region (∼ 400 cm−3 on average, according to Martin et al., 2010a; Zhou et al., 2002). In the dry season, the site is affected by advection of biomass burning aerosols from eastern and southern Amazonia. The median particle number concentration reaches 1254 (557–2928) cm−3 (Table 1). These values are compatible with previously reported values for the dry season from another site in the same forest reservation (ZF2) (averages in the range of 1080 to 1400 cm−3, according to Rissler et al., 2004; Rizzo et al., 2010). In spite of the three-fold increase from wet to dry season, observed particle number concentrations are well below observations from the Amazonian state of Rondônia (for example), which is a site heavily affected by biomass burning emissions, where particle number concentration averages are in the range of 5700 to 10 440 cm−3 (Artaxo et al., 2002; Brito et al., 2014; Rissler et al., 2006).
Figure 2 shows the median particle number size distribution for each season. One of the major differences between both seasons is the clear bimodal shape with pronounced Aitken mode (∼30–100 nm) during wet season, compared to the accumulation mode (∼100–600 nm) dominated dry season aerosol size distribution. The local minimum between the Aitken and accumulation modes observed in the wet season is known as the Hoppel minimum (Hoppel et al., 1994), and it is an indicator of aerosol in-cloud processing. The persistence of the Hoppel minimum and the weak contribution of nucleation mode particles (diameter<30 nm) during the wet season suggest that submicrometer aerosol sources from above the BL are relevant at this forest site.
To analyze dynamic variations of the particle number size distributions, one to three lognormal modes were fitted to each size spectra. Aitken and accumulation modes were almost ubiquitous in the wet season (92 and 100 % of samples, respectively) (Table 1). In the dry season, the Aitken mode was less frequent (63 %), likely being overwhelmed by the influence of accumulation mode particles from regional biomass burning. Geometric mean diameters (d) typically ranged between 50 and 85 nm for the Aitken mode and between 100 and 220 nm for the accumulation mode (Table 1). The nucleation mode was present in 73 % of size spectra observed in the wet season, and in 38 % of size spectra in the dry season, with mean geometric diameters in the range of 10–25 nm (Table 1). This result is consistent with previous observations of the decreased occurrence of the nucleation mode from wet to dry season (Rissler et al., 2004, 2006; Rizzo et al., 2010; Zhou et al., 2002). A possible explanation for this is the increased aerosol loading during the dry season, which acts as a sink for nucleation mode particles and for low-volatility organic compounds. The median particle surface area, which is approximately proportional to the condensation sink of non-volatile vapors, was 24 µm2 cm−3 during the wet season and 102 µm2 cm−3 during the dry season.
3.2 Diurnal variability and modeling of processes that govern the behavior of submicrometer particle size spectra
Figure 3 shows the median diurnal cycles of the total (Ntotal) and modal (Ni) particle number concentrations observed during the wet and dry seasons, as well as the variability of the geometric mean diameter (Dpg) of the size distributions. The observations are satisfactorily reproduced by the model (Fig. 4). Table 2 summarizes the model fitted parameters in order to reproduce the observations, particularly the estimated source strength of Type 1 (particles emitted at the surface), Type 2 (particles entrained from above the CBL) and Type 3 (Aitken mode particles transported into the CBL with convective downdrafts) particles. The diurnal variations in the contribution of the different particle source types to the particle number concentrations at the surface, as well as the characteristic number size distribution for the type 1, 2 and 3 particle source are shown in Figs. S6 and S7 in the Supplement.
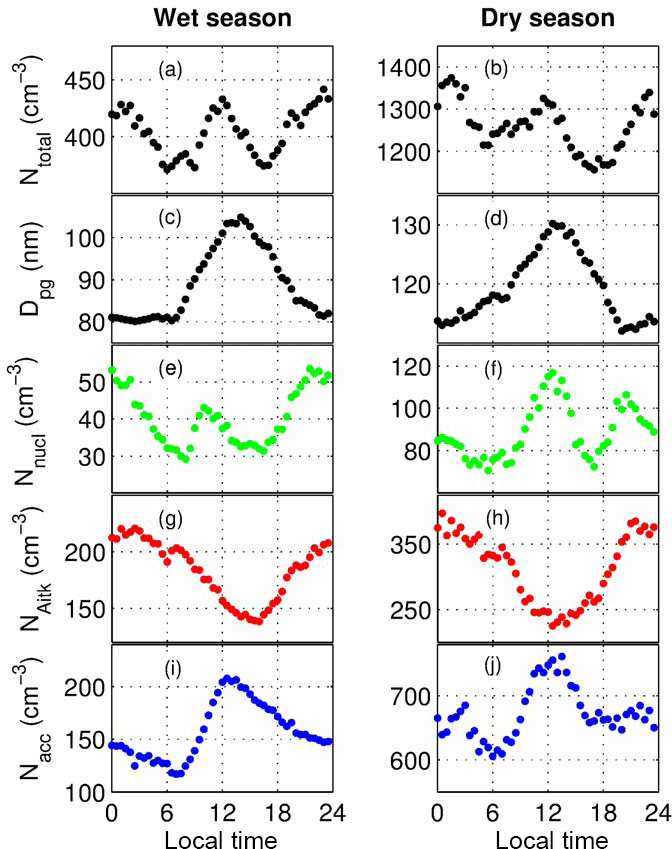
Figure 3Median diurnal cycles for the wet and dry seasons. Total particle number concentration in the 10–600 nm range (Ntotal) (a, b); particle mean geometric diameter (Dpg) (c, d); concentration of the nucleation mode (Nnucl) (e, f); concentration of the Aitken mode (NAitk) (g, h); and the concentration of the accumulation mode (Nacc) (i, j).
The overall diurnal behavior of Ntotal and Dpg did not show significant seasonal variation, in spite of the substantially different particle number size distribution shape and total number concentration (Fig. 3a–d). Between 02:00 and 06:00 local time (LT) the total particle number concentration decreased continuously, both during the wet and the dry seasons (Fig. 3a–b). According to the model simulations, this is mainly attributed to dry deposition in a shallow NL (Figs. S3–S4) and insignificant primary particle emissions from the surface. At the same time, the Dpg is fairly stable (Fig. 3c–d), especially during the wet season. In the model, this combination of decreasing particle number concentrations and nearly constant Dpg can only be achieved if the particle condensation growth rates are low.
Table 2Model fitted parameters and their estimated values for the wet and dry seasons. Fitted condensation growth rates are shown for daytime (06:00 to 18:00 LT) and nighttime (18:00 to 06:00 LT). The contribution of the different particle sources is given as an effective daily concentration contribution to the lowermost 1000 m of the atmosphere.
Around 08:00 Ntotal and Dpg begin to increase rapidly during both seasons. A shift to larger particle sizes during daytime was also reported by Rissler et al. (2006). From Fig. 3i–j, it is clear that the accumulation mode leads the diurnal particle number concentration increase. The nucleation mode also increased in the morning, but its contribution to total particle number concentration is smaller due to its relatively low frequency of occurrence and concentrations (Table 1). Part of this behavior, i.e., the decrease of the Aitken mode concentrations coincident with an increase in accumulation mode concentrations, could be explained by the growth of Aitken mode particles into accumulation mode particles. The Aitken mean geometric diameter (not shown) increased in the morning (1 nm h−1, on average), supporting this hypothesis. Particle growth can be driven by the condensation of low-volatility vapors produced by the photooxidation of biogenic volatile organic compounds (BVOC) (e.g., Chen et al., 2015; Claeys et al., 2004; Hu et al., 2015; Sá et al., 2017) and by in cloud processing (Hoppel et al., 1994; Krejci et al., 2005a). The model simulations confirm the influence of condensation growth on the observed morning behavior, but also indicate the influence of another relevant process: the entrainment of accumulation mode particles (particle source Type 2), as the CBL develops between 07:00 and 10:00 LT. The origin of such accumulation mode particles could be both long-range transport and in cloud processed particles in the RL and in the lowermost FT. In the dry season, the entrainment of long-range transported particles into the surface level during the morning hours has also been documented in western Amazonia (Brito et al., 2014). Model simulations require a greater Type 2 particle source strength in the dry season compared to the wet season (Fig. S6 and Table 2). Accordingly, previous observations pictured the rainforest as a net fine mode particle sink (Ahlm et al., 2010; Rizzo et al., 2010), with higher deposition fluxes in the dry season.
In the afternoon (14:00–18:00), a decrease was observed in Ntotal (Fig. 3a–b), Dpg (Fig. 3c–d) and the accumulation mode concentration (Fig. 3i–j). Heavy rain showers are frequent in the afternoon (Machado et al., 2004; Nunes et al., 2016 and Fig. S5). According to the model simulations, the decreasing total particle number concentration can partly be explained by below cloud scavenging. However, scavenging alone cannot explain the observed decreasing Dpg values, which were explained in the model simulations by the inclusion of a Type 3 particle source (Figs. S6 and S8). This particle source refers to convective downdrafts that transport FT air masses with low concentrations of accumulation mode particles but relatively high concentrations of Aitken mode particles into the CBL (Wang et al., 2016). In agreement with this explanation, observations show an increase in the Aitken mode particle concentrations in the afternoon (Fig. 3g–h); this mode then reaches its highest values in the evening.
Around 17:00 LT the total particle number concentration starts to rise relatively steeply, led by the increasing Aitken and nucleation mode concentrations (Fig. 3e–h). At this time, the BL is also becoming very shallow and surface RH increases from around 80 to 95 % on average (Figs. S3 and S4). Surface emission of biological particles could explain the steeply increasing number concentration during the evening, during both the wet and the dry season. A possible mechanism is related to the rapid RH transition in the late afternoon, which can trigger the emission of submicrometer primary biological aerosol particles via rupturing and wet discharge of fungal spores. Fungal spores are mostly supermicrometer sized (e.g., Huffman et al., 2012), but their fragments and the liquid droplets discharged along with them are emitted in a broad range of sizes, from tenths of nanometers to micrometers (China et al., 2016; Elbert et al., 2007). In order to explain the small trends in Dpg during the evening, model calculations indicate that the surface emitted particles (source Type 1, Fig. S6) need to be dominated by a mode of around 65 nm in diameter, with the contribution of nucleation mode particles only during the wet season.

Figure 4Modeled average particle number sized distributions for (a) the wet season and (b) the dry season. Shown are: the base case model runs, where all processes listed in Table 2 were considered; simulations without the Type 1 surface source of particles; simulations without the Type 2 source of particles entrained from above the BL; simulations with particle-free air in the convective downdrafts (Type 3); no convective downdrafts; no particle dry deposition losses; no below cloud scavenging; no coagulation; and no condensation. The measured median particle number size distributions are also displayed.
Figure 4 shows modeled average particle number size distributions for the wet and dry season when one process at a time was turned off in the model. For the base case, the modeled particle number size distributions are almost identical with the observations during the wet and dry seasons, respectively. It is evident that the single process with largest influence on the modeled particle number size distribution, especially during the wet season, is the parameterized convective downdrafts. If the model does not take these downdrafts into account, the size distributions during both the wet and dry seasons are completely dominated by a large accumulation mode with Dpg>200 nm. If we instead assume that the convective downdrafts contain completely particle free air, the model instead substantially underestimates the concentration of Aitken mode particles during the wet season. Thus, according to our model simulations, the convective downdrafts serve as an important source of Aitken mode particles to the surface layer, especially during the wet season. However, precipitation, usually associated with convective downdrafts, effectively decreases the concentrations of accumulation mode particles and causes a net reduction in the median total particle number and volume concentrations in the CBL in the afternoon (Fig. 3a–b). According to the model, condensation, i.e., secondary aerosol formation, is by far the largest source of submicron aerosol volume (mass), with estimated volume contributions of 0.33 and 0.43 µm3 cm−3 per day in the lowermost 1000 m of the atmosphere, during wet and dry seasons, respectively. Assuming a density of 1 g cm−3, this corresponds to aerosol mass concentration values of 0.33 and 0.43 µg m−3, representing 10–15 % of typical fine mode aerosol concentrations in Amazonian forest sites (about 2.0 and 4.0 µg m−3 in the wet and dry seasons, Martin et al., 2010b). The estimated particle mass yield by condensation also agrees with reported PM1 mass concentrations of SOA produced by gas-to-particle conversion pathways (about 0.3 µg m−3 in the wet season, Chen et al., 2015).
3.3 Cluster analysis
Cluster analysis was applied to all particle number size distribution samples, which were normalized by particle number concentration. The number of clusters was chosen to be seven (Sect. 2.3.1). Figure 5 shows the cluster centroids, as well as the frequency of occurrence in each season and the percentage of size distribution samples included in each cluster. Four of the clusters occurred mostly in the wet season, and three of the clusters predominated in the dry season. Figure 6 shows the relative frequency plots associating cluster occurrence to particle number concentration, the particle light absorption coefficient, variations in equivalent potential temperature (Δθe) and ambient RH. Since meteorological data was available each 30 min, linear interpolation was used to match the time lines of meteorological observations and the occurrence of particle size distribution clusters.
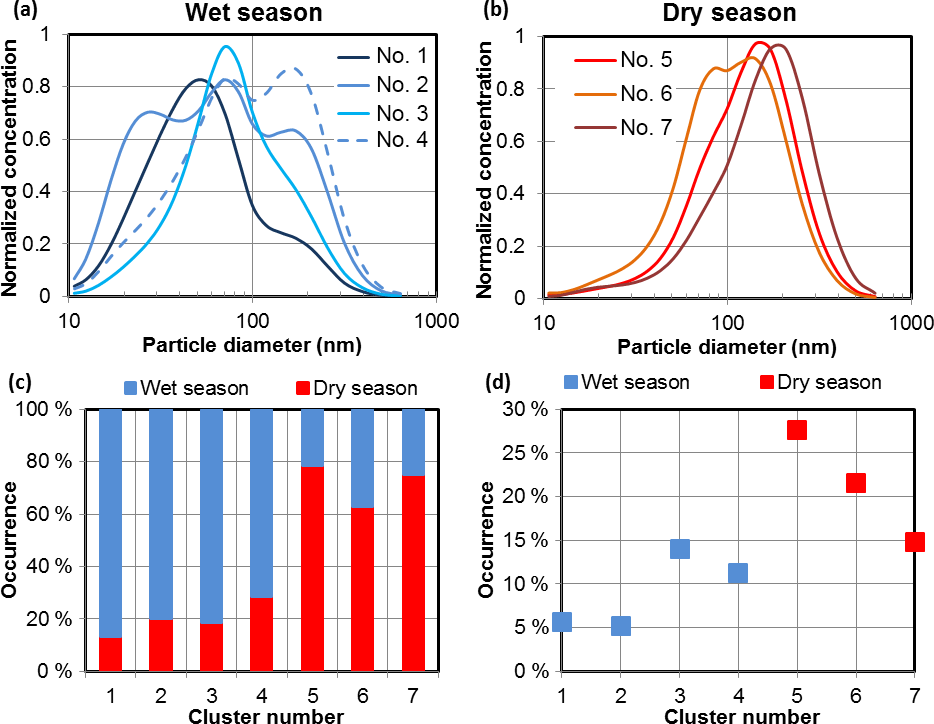
Figure 5Normalized particle number size distribution cluster centroids occurring in the wet season (a) and dry season (b). The percentage of the occurrence of each cluster in each season (c), and the percentage of the size distribution samples included in each cluster (d).
The clusters predominant in the wet season (clusters 1, 2, 3 and 4) were associated with relatively clean conditions, with total particle number concentrations <500 cm−3 most of the time (60–70 % of samples in each cluster) and particle absorption coefficients less than 1 Mm−1 (65–80 % of samples in each cluster) (Fig. 6). Conversely, the clusters predominant in the dry season (clusters 5, 6 and 7) occurred when particle number concentrations (>500 cm−3 in 65–80 % of samples) and particle absorption coefficients (>1 Mm−1 in 45–90 % of samples) were relatively high (Fig. 6ab). Rizzo et al. (2013) reported particle absorption coefficients of 1.0±1.4 Mm−1 for the wet season and 3.9±3.6 Mm−1 for the dry season, at the same sampling site. In the dry season, the relatively large particle absorption coefficients are associated with the presence of biomass burning aerosols, while in the wet season absorption is attributed to both light absorbing biogenic aerosols and to long-range transported African biomass burning aerosols (e.g., Martin et al., 2010b and references therein).
Among the dry season clusters, cluster 6 occurred during intermediate aerosol loadings (Fig. 6ab), and may be associated with periods of seasonal transition. Accordingly, it shows some contribution from the Aitken mode (Fig. 5b), typical of the natural wet season particle size distributions. This indicates that the contribution of biogenic aerosols, either from particle sources at surface or from above the BL, is present year round, which is consistent with the model simulations.
In the wet season clusters (1, 2, and 3) the Aitken mode is predominant, whereas in the dry season clusters (5 and 7) the accumulation mode dominates the particle size spectra (Fig. 5a, b). Only one cluster showed a strong influence of nucleation mode (wet season cluster 2) (Fig. 5a). This was true even if the number of clusters was increased to 20, reflecting the transient nature of the nucleation mode (Table 1). Clusters 4 and 6 had similar contributions from Aitken and accumulation modes, and their centroids hold the Hoppel minimum, suggesting the influence of in cloud processed secondary aerosol formation. The cluster centroids with a distinct contribution of the Aitken mode (clusters 1, 2, 3, 4 and 6) were mostly observed during periods of negative Δθe (Fig. 6c, 50–75 % of samples in each cluster), i.e., periods with decreasing surface equivalent potential temperature, which suggests the influence of convective downdrafts. This result strengthens the hypothesis of a source of Aitken mode particles from above the BL, as suggested by the model results from Sect. 3.2.
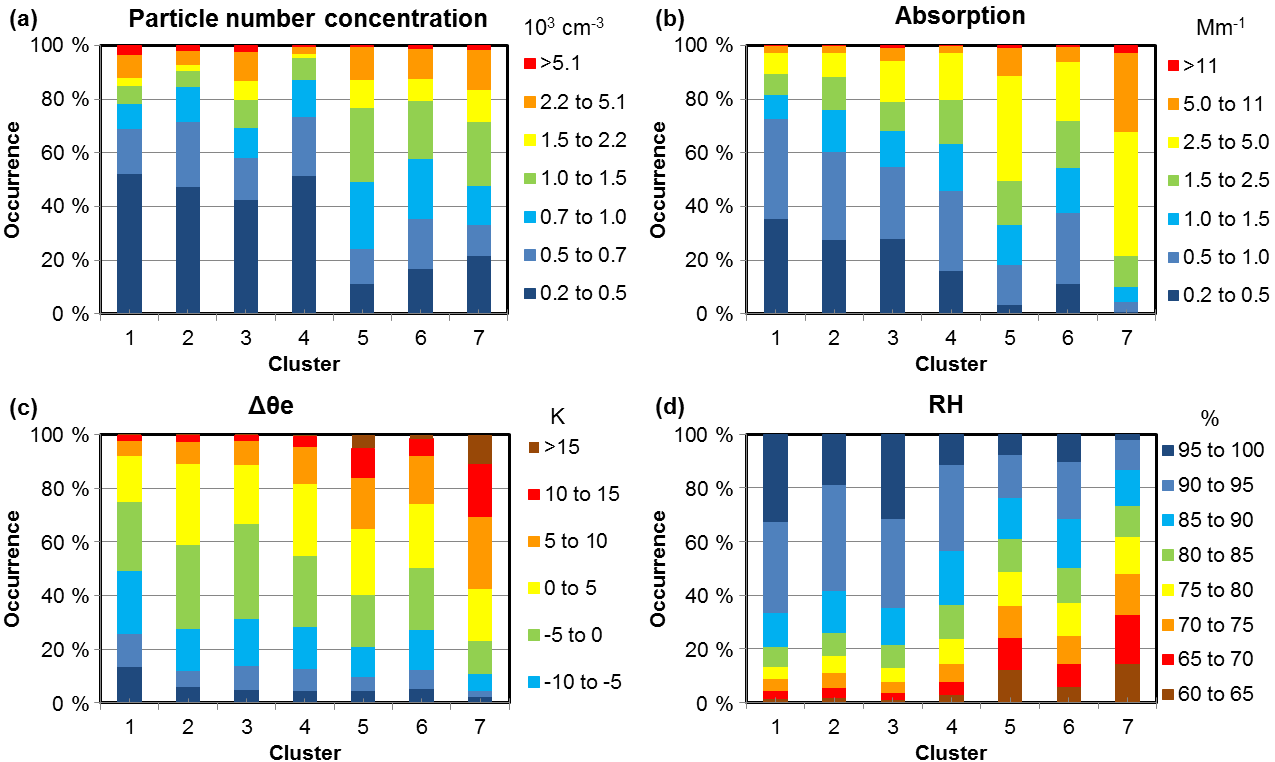
Figure 6Stacked bar plots showing (a) which particle number concentration range each cluster was most frequent in, (b) which particle absorption coefficient range each cluster was most frequent in, (c) which equivalent potential temperature variation range (Δθe) each cluster was most frequent in, and (d) which RH range each cluster was most frequent in. Wet season clusters (numbers 1 to 4) showed aerosol number concentrations and absorption coefficients within background ranges 500 cm−3 and 1 Mm−1, respectively, contrary to the dry season clusters (numbers 5 to 7).
Cluster 1 was the only cluster that showed a relationship with both precipitation and downdraft events. Considering a lag time of ±6 h, cluster 1 typically occurred after rainy periods (Fig. S9), simultaneously with negative Δθe (75 % of samples with Δθe<0, Fig. 6c), and during periods with an increasing particle number concentration. This suggests that the particle samples within this cluster originated from above the CBL. Accordingly, the cluster 1 centroid shows the predominance of particles in the lower range of the Aitken mode, centered at 50 nm (Fig. 5a), similar to the size distribution used in the ADCHEM model simulations to represent the particle population in convective downdrafts (Fig. S6).
Dry season cluster 7 had distinct features: it showed an abundance of particles in the upper part of accumulation mode (centered at 210 nm) (Fig. 5b); it occurred in relatively dry conditions (62 % of samples occurred at RH<80 %) (Fig. 6d); and it was associated with high particle light absorption coefficients (90 % of samples had absorption coefficients >1 Mm−1) (Fig. 6b). Two case studies, analyzed in the Supplement, suggest that the occurrence of cluster 7 is connected to the influence of fresh biomass burning aerosols (Figs. S11 and S12). Cluster 7 was predominant during events of intense biomass burning activity, and also when fire spots were detected relatively close to the TT34 site. Considering the whole time series, clusters 5 and 6 were more frequent than cluster 7 (Fig. 5d), indicating that aged biomass burning emissions are the major anthropogenic influence over the TT34 site in the dry season.
Cluster analysis was not able to associate a specific particle number size distribution shape when local wind came from the southeast – the direction of the city of Manaus, which is 60 km away. This suggests that the Manaus urban plume influence is occasional, and that particles are processed on their way to the forest site. The particles then merge with the aerosol population above forest areas without any apparent significant differences concerning particle size distributions. Rizzo et al. (2013) identified 43 episodes of Manaus plume influence over the TT34 tower site between 2008 and 2011, which comprised 1.5 % of their dataset.
3.4 New particle formation and particle burst events
Analyzing daily contour plots of particle number size distributions, the 749 days with observations were classified into the following categories: days with new particle formation and growth (NPF) events (comprising 3 % of days); undefined event days (28 %); non-event days (52 %) and unclassified days (16 %). The classification criteria were based on Dal Maso et al. (2005), which states that NPF events have the following characteristics: (i) a distinctly new mode of particles with diameters less than 25 nm must appear in the size distribution; (ii) the mode must prevail over a time span of hours; and (iii) the new mode must show signs of growth. Events were classified as undefined when a burst of nucleation mode or Aitken mode particles was observed, prevailing for at least 1 h, but without clear signs of growth (Fig. 7). Unclassified days were those with measurement coverage less than 12 h or with intermittent sampling periods.
The observed frequency of NPF events is very low in comparison to other forest environments worldwide (e.g., Boy et al., 2008; Han et al., 2013; Held et al., 2004; Mäkelä et al., 2000). In a boreal forest site in Finland, which hold one of the longest time series of particle size distribution observations, NPF event days reach 24 %, being most frequent during spring and autumn (Dal Maso et al., 2005). In this dataset, the percentage of days with events classified as undefined (28 %) is similar to what has been reported in Finland (37 %, according to Dal Maso et al., 2005).
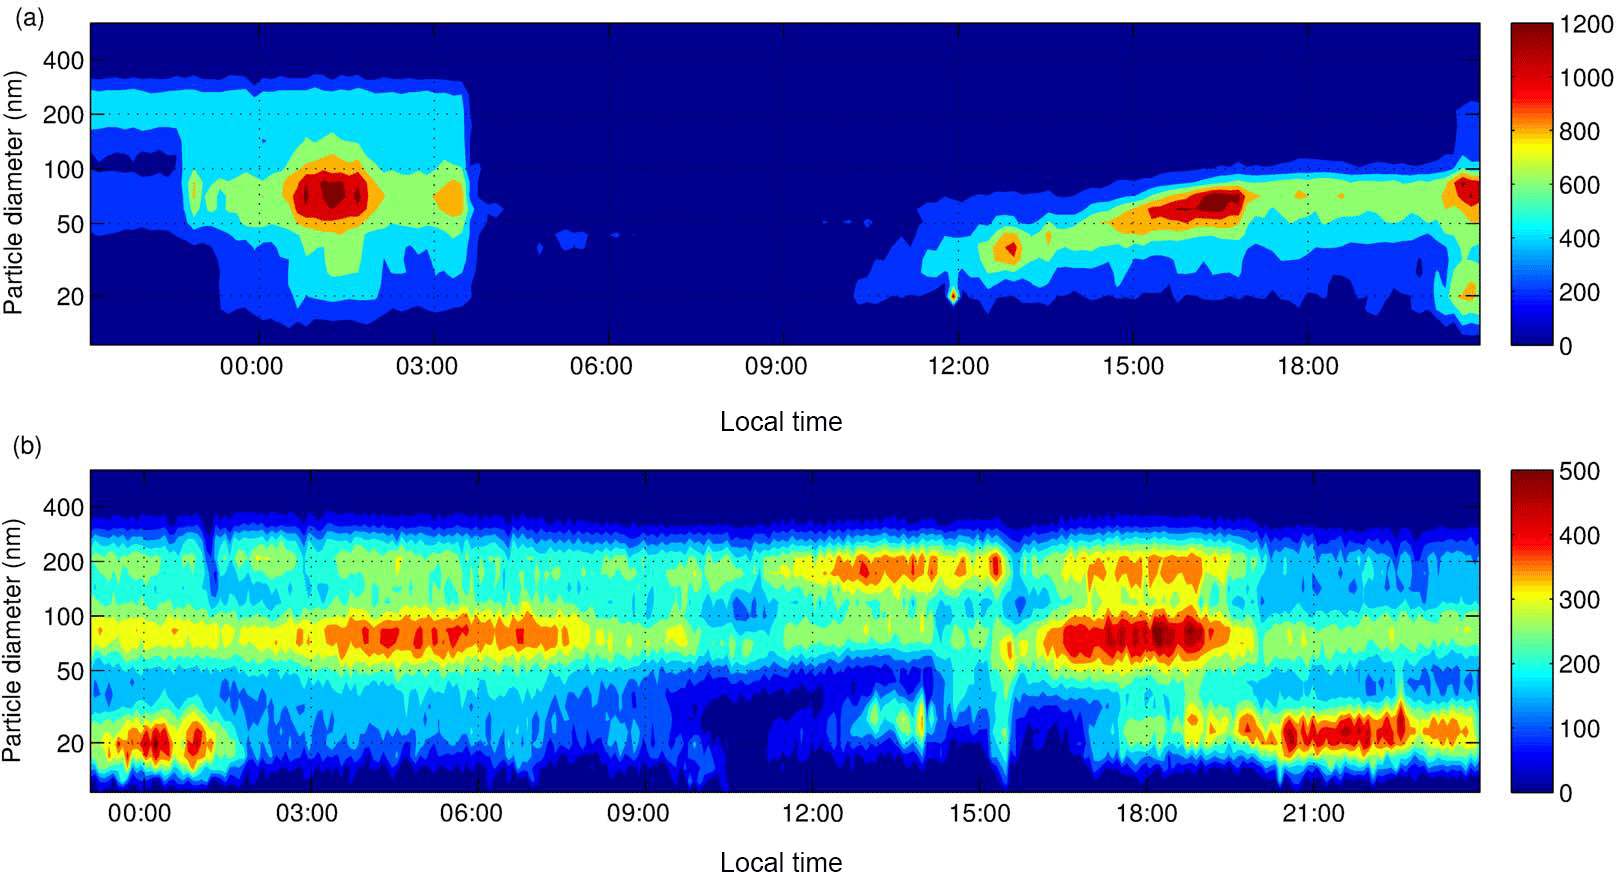
Figure 7(a) Example of a new particle formation (NPF) and growth event starting on 21 February 2014 10:00 LT. (b) Example of undefined events, on 4 June 2009. Particle bursts were observed at 00:00, 14:00 and 21:00 LT, without subsequent growth. In both plots, the color coding shows the particle number concentration normalized by diameter channel, dN∕dlogDp, in cm−3.
Most NPF events started at daytime (Fig. S13) and during the wet season (19 out of 24 events). This is expected, as worldwide NPF event days are typically characterized by relatively low condensation sinks (e.g., Hyvönen et al., 2005). The median particle surface area, which is approximately proportional to the condensation sink of non-volatile vapors, was 18 µm2 cm−3 (on average) at the onset of NPF events. This can be compared with the total dataset median values of 24 and 102 µm2 cm−3 during the respective wet and dry seasons (Table 1). Growth rates for the NPF events were calculated by fitting a first-order polynomial to the geometric mean diameter of the nucleation and Aitken modes, following growth between 10 and 50 nm. The median growth rate was 5.5 nm h−1, ranging from 1 to 17 nm h−1. For comparison, particle growth rates at a boreal forest site in Finland during the summer typically range from 8 to 12 nm −1 (Kulmala et al., 2004).
Undefined events were also most common in the wet season (161 out of 212 events); however contrary to NPF events, the bursts of nucleation and Aitken mode particles occurred equally at daytime (46 %) and nighttime (Fig. S13). Consequently, it is possible that different mechanisms result in the observed undefined events. Comparison of the atmospheric conditions during diurnal NPF and diurnal undefined events (Fig. S14) show that particle surface area was typically higher in undefined events, while radiation and ozone mixing ratios were similar in both events. This leads to the interpretation that diurnal undefined events are failed NPF and growth events, similar to those observed in Finland (Mazon et al., 2009). Nocturnal undefined events coincide with the Aitken mode particle number concentration increase observed in the evening (Fig. 3), are associated with surface emissions and are likely of biogenic origin. Based on the available dataset, there is not enough evidence to confirm whether these particles are primary or secondary; therefore, the mechanism behind the undefined events remains unclear.
NPF and growth events may be connected with the occurrence of convective downdrafts, since precipitation and negative Δθe were frequent 2 h before such events (Fig. S14). Moreover, cluster 1 (Fig. 5a), associated with the transport of Aitken mode particles from above the BL (Sect. 3.3), was characteristic of NPF events (Fig. S10). Conversely, cluster 2 was uncommon during non-event days, and very frequent during both NPF and undefined events (Fig. S10), which meant that particle size distributions within this cluster could be used as tracers for both events.

Figure 8Mean values calculated within ±6 h of the occurrence of strong precipitation events (>10 mm h−1). Time zero corresponds to the instant of maximum precipitation in each event. Only wet season afternoon events (12:00–16:00 LT) were considered in this plot. Top: (a) precipitation (accumulated mm in 30 min), (b) variations in equivalent potential temperature (Δθe), (c) H2O mixing ratios. Middle: (d) number concentration of particles with a diameter less than 50 nm (N<50), (e) number concentration of particles with a diameter greater than 100 nm (N>100), (f) total particle number concentration (Ntotal). Bottom: (g) contour plot showing mean particle size distributions within ±6 h of precipitation events. The color coding represents particle number concentration normalized by diameter channel, dN∕dlogDp, in cm−3.
3.5 Influence of precipitation and downdraft events on particle number size distributions
Throughout the particle size distribution measurement period, 86 wet season afternoon (12:00–16:00 LT) precipitation events with moderate to strong intensities (>10 mm h−1) were identified, typically lasting 1.5 h. Constraining the analysis to the afternoon favors the selection of rain events from convective origin, as opposed to rain produced by squall lines. Decreases in the surface equivalent potential temperature, i.e., negative Δθe values, were used as a proxy for the occurrence of convective downdrafts (Sect. 2.1). Previous investigations in Amazonia have shown the transport of ozone to the surface in association with convective downdrafts (Betts et al., 2002; Gerken et al., 2016). Airborne observations have shown strong vertical gradients of particle number concentrations above forest areas in Amazonia during the wet season (Krejci et al., 2005b; Wang et al., 2016; Andreae et al., 2018), indicating a profusion of Aitken and nucleation mode particles in the FT. Wang et al. (2016) showed case studies to attest the relevance of convective downdrafts as a source of particles in the Amazonian BL during the wet season. Here, a similar analysis is presented, but based on a longer measurement time series. On one hand, a longer time series provides statistical significance; however, on the other hand, an analysis such as this puts together events that occurred under different atmospheric conditions. It is important to mention that the method used here does not distinguish between deep and shallow convection and its different air mass exchange efficiencies, and also does not consider the occasional presence of long range transported aerosol plumes in the FT at the onset of precipitation events.
Figure 8 shows a lag time analysis using the instant of maximum precipitation rate in each event as a reference (zero lag). Average negative values of Δθe at the onset of rain events indicate the occurrence of downdrafts in most of the 86 selected precipitation events. Simultaneously, a fast decrease in H2O mixing ratios was detected, suggesting the mixture of surface air with dryer air from the FT. The average effect of the selected afternoon precipitation events is an increase in the number concentration of small particles (N<50, diameter less than 50 nm), and a decrease in the concentration of accumulation mode particles (N>100). This results in a net reduction in the total particle number concentration (Fig. 8d–f). The combination of particle scavenging and a source of small particles above the BL is consistent with the afternoon behavior of particle number size distributions, discussed in Sect. 3.2 and Fig. 3. Analyzing the relationship between particle concentrations and the occurrence of downdrafts (Fig. S15), the trend of increased N<50 particle concentrations with negative Δθe, as reported by Wang et al. (2016), is confirmed, but is less clear. Particle scavenging ratios and the vertical transport of particles from above the BL need further investigation and improved methods, which take the efficiency of air mass exchanges for different types of clouds and convection scales, as well as the presence of aerosol plumes above the BL into account.
This work reports a multi-year dataset of submicrometer particle size spectra in Amazonia. In the dry season, the accumulation mode dominates the particle number size spectra, due to the continuous input of aged biomass burning particles from regional emissions. During the wet season, the Aitken and accumulation modes, as well as the Hoppel minimum, are present, and the relative importance of the modes changes during the day. Cluster analysis, applied to normalized particle number size distributions, was useful in distinguishing particle size spectra shape typical of the influence of fresh biomass burning aerosols, vertical transport of particles associated with convective downdrafts and nucleation events.
One of the major scientific questions supporting the continuous observation of particle number size distributions in Amazonia is “Was the lack of surface level NPF events observed during short-term experiments representative over all seasons?”. This dataset confirms that NPF and subsequent particle growth is rare in Amazonia, such that 24 events were detected in 749 days of observations (3 %). This frequency is very low in comparison to other forest environments worldwide (e.g., Boy et al., 2008; Han et al., 2013; Held et al., 2004; Mäkelä et al., 2000). The majority of the few NPF events observed occurred after precipitation and were concurrent with decreasing surface θe, which links NPF events to the occurrence of convective downdrafts. Conversely, bursts of Aitken and/or nucleation mode particles without subsequent growth (undefined events) were relatively frequent (28 % of the measurement days). Undefined events did not show a clear diurnal pattern or a relationship with downdraft occurrence, which means that the observed particle bursts may be a combination of different processes.
Since NPF events within the BL are infrequent in Amazonia, other particle sources must be active to support the observed submicrometer aerosol loadings. The analysis of observed and modeled diurnal patterns of particle size spectra indicates that, in order to maintain the particle number concentrations, the following particle sources are needed: (i) a source of Aitken mode particles within the BL in the evening and at night (Type 1); (ii) the entrainment of accumulation mode particles in the morning, either from in-cloud processing or long-range transport (Type 2); and (iii) the vertical transport of Aitken mode aerosols into the BL by convective downdrafts in the afternoon (Type 3). Modeling points to dry deposition and afternoon wet deposition as the major aerosol sinks within the BL during the wet season, and coagulation during the dry season.
Results indicate that the transport of Aitken mode particles from convective downdrafts (Type 3) has a large impact on the median particle number size distributions, especially during the wet season; this is in accordance with the mechanism proposed by Wang et al. (2016). The analysis of 86 afternoon precipitation events in the wet season confirm the input of small particles (N<50) into the BL at the onset of strong rain events, but also indicates a net decrease in the total particle number concentration due to scavenging. This means that particle removal is not entirely compensated for by the input of particles from downdrafts. To reproduce the observed particle number concentrations after the typical afternoon rain events, model simulations indicate the existence of an evening and nighttime source of particles within the BL (Type 1). Since the measurement site is in a forest reserve where local pollution sources are not significant, this source is likely biogenic and either from primary emissions or secondary aerosol formation. Primary biological emissions could be trigged by fast RH variations in the late afternoon, through the rupture and wet discharge of fungal spores (China et al., 2016; Elbert et al., 2007). The mechanisms behind nighttime surface particle emissions require further investigation.
The datasets used in this publication can be downloaded from the file repository created and maintained by the Laboratory of Atmospheric Physics at the University of São Paulo (LFA/USP): http://lfa.if.usp.br/ftp/public/LFA_Processed_Data/ (LFA/USP, 2018).
The supplement related to this article is available online at: https://doi.org/10.5194/acp-18-10255-2018-supplement.
PA, MK and ES conceived the experiment and coordinated research grants. LVR, PR, JB and JB conducted the measurements. PR did the model analysis. LVR and PR analyzed the data and wrote the manuscript. JB, JB, ES, RK, PT and TP contributed to the discussion of the results. All authors reviewed the manuscript.
The authors declare that they have no conflict of interest.
This article is part of the special issue “Observations and Modeling of the Green Ocean Amazon (GoAmazon2014/5) (ACP/AMT/GI/GMD inter-journal SI)”. It is not associated with a conference.
This work was supported by Fundação de Amparo à Pesquisa do Estado de São
Paulo (FAPESP grant nos. 08/58100-2 and 13/05014-0), the Conselho Nacional de Desenvolvimento
Científico (CNPq) and the European Integrated FP6 project on Aerosol Cloud
Climate and Air Quality Interactions (EUCAARI – project no. 34684), under the scope of
the LBA experiment. We thank the INPA (Instituto Nacional de Pesquisas da Amazônia)
for the coordination of the LBA Experiment and meteorological data.
The authors gratefully acknowledge financial support from the Academy of Finland Centre of Excellence program
(project no. 1118615), the Swedish Research Council FORMAS (project no. 2014-1445)
and STINT (project BR2013-5210). The authors would also like to thank the following key
people for support with aerosol sampling and analysis: Alcides Ribeiro,
Ana Lucia Loureiro, Fernando Morais, Fábio Jorge, Glauber Cirino, Kenia T.
Wiedemann, Lívia Oliveira and Simone Guimarães.
Edited by: Maria Assuncao Silva Dias
Reviewed by: two anonymous referees
Ahlm, L., Nilsson, E. D., Krejci, R., Mårtensson, E. M., Vogt, M., and Artaxo, P.: A comparison of dry and wet season aerosol number fluxes over the Amazon rain forest, Atmos. Chem. Phys., 10, 3063–3079, https://doi.org/10.5194/acp-10-3063-2010, 2010.
Almeida, J., Schobesberger, S., Kürten, A., Ortega, I. K., Kupiainen-Määttä, O., Praplan, A. P., Adamov, A., Amorim, A., Bianchi, F., Breitenlechner, M., David, A., Dommen, J., Donahue, N. M., Downard, A., Dunne, E., Duplissy, J., Ehrhart, S., Flagan, R. C., Franchin, A., Guida, R., Hakala, J., Hansel, A., Heinritzi, M., Henschel, H., Jokinen, T., Junninen, H., Kajos, M., Kangasluoma, J., Keskinen, H., Kupc, A., Kurtén, T., Kvashin, A. N., Laaksonen, A., Lehtipalo, K., Leiminger, M., Leppä, J., Loukonen, V., Makhmutov, V., Mathot, S., McGrath, M. J., Nieminen, T., Olenius, T., Onnela, A., Petäjä, T., Riccobono, F., Riipinen, I., Rissanen, M., Rondo, L., Ruuskanen, T., Santos, F. D., Sarnela, N., Schallhart, S., Schnitzhofer, R., Seinfeld, J. H., Simon, M., Sipilä, M., Stozhkov, Y., Stratmann, F., Tomé, A., Tröstl, J., Tsagkogeorgas, G., Vaattovaara, P., Viisanen, Y., Virtanen, A., Vrtala, A., Wagner, P. E., Weingartner, E., Wex, H., Williamson, C., Wimmer, D., Ye, P., Yli-Juuti, T., Carslaw, K. S., Kulmala, M., Curtius, J., Baltensperger, U., Worsnop, D. R., Vehkamäki, H., and Kirkby, J.: Molecular understanding of sulphuric acid-amine particle nucleation in the atmosphere, Nature, 502, 359–363, https://doi.org/10.1038/nature12663, 2013.
Andreae, M. O.: Aerosols Before Pollution, Science (New York, N.Y.), 315, 50–51, https://doi.org/10.1126/science.1136529, 2007.
Andreae, M. O. and Crutzen, P. J.: Atmospheric Aerosols: Biogeochemical Sources and Role in Atmospheric Chemistry, Science (New York, N.Y.), 276, 1052–1057, https://doi.org/10.1126/science.276.5315.1052, 1997.
Andreae, M. O., Berresheim, H., Bingemer, H., Jacob, D. J., Lewis, B. L., Li, S.-M., and Talbot, R. W.: The atmospheric sulfur cycle over the Amazon Basin 2 – Wet season, J. Geophys. Res., 95, 16813–16824, 1990.
Andreae, M. O., Artaxo, P., Fischer, H., Freitas, S. R., Grégoire, J.-M., Hansel, A., Hoor, P., Kormann, R., Krejci, R., Lange, L., Lelieveld, J., Lindinger, W., Longo, K., Peters, W., de Reus, M., Scheeren, B., Silva Dias, M. A. F., Ström, J., van Velthoven, P. F. J., and Williams, J.: Transport of biomass burning smoke to the upper troposphere by deep convection in the equatorial region, Geophys. Res. Lett., 28, 951–954, https://doi.org/10.1029/2000GL012391, 2001.
Andreae, M. O., Acevedo, O. C., Araùjo, A., Artaxo, P., Barbosa, C. G. G., Barbosa, H. M. J., Brito, J., Carbone, S., Chi, X., Cintra, B. B. L., da Silva, N. F., Dias, N. L., Dias-Júnior, C. Q., Ditas, F., Ditz, R., Godoi, A. F. L., Godoi, R. H. M., Heimann, M., Hoffmann, T., Kesselmeier, J., Könemann, T., Krüger, M. L., Lavric, J. V., Manzi, A. O., Lopes, A. P., Martins, D. L., Mikhailov, E. F., Moran-Zuloaga, D., Nelson, B. W., Nölscher, A. C., Santos Nogueira, D., Piedade, M. T. F., Pöhlker, C., Pöschl, U., Quesada, C. A., Rizzo, L. V., Ro, C.-U., Ruckteschler, N., Sá, L. D. A., de Oliveira Sá, M., Sales, C. B., dos Santos, R. M. N., Saturno, J., Schöngart, J., Sörgel, M., de Souza, C. M., de Souza, R. A. F., Su, H., Targhetta, N., Tóta, J., Trebs, I., Trumbore, S., van Eijck, A., Walter, D., Wang, Z., Weber, B., Williams, J., Winderlich, J., Wittmann, F., Wolff, S., and Yáñez-Serrano, A. M.: The Amazon Tall Tower Observatory (ATTO): overview of pilot measurements on ecosystem ecology, meteorology, trace gases, and aerosols, Atmos. Chem. Phys., 15, 10723–10776, https://doi.org/10.5194/acp-15-10723-2015, 2015.
Andreae, M. O., Afchine, A., Albrecht, R., Holanda, B. A., Artaxo, P., Barbosa, H. M. J., Borrmann, S., Cecchini, M. A., Costa, A., Dollner, M., Fütterer, D., Järvinen, E., Jurkat, T., Klimach, T., Konemann, T., Knote, C., Krämer, M., Krisna, T., Machado, L. A. T., Mertes, S., Minikin, A., Pöhlker, C., Pöhlker, M. L., Pöschl, U., Rosenfeld, D., Sauer, D., Schlager, H., Schnaiter, M., Schneider, J., Schulz, C., Spanu, A., Sperling, V. B., Voigt, C., Walser, A., Wang, J., Weinzierl, B., Wendisch, M., and Ziereis, H.: Aerosol characteristics and particle production in the upper troposphere over the Amazon Basin, Atmos. Chem. Phys., 18, 921–961, https://doi.org/10.5194/acp-18-921-2018, 2018.
Artaxo, P., Martins, J. V., Yamasoe, M. A., Procópio, A. S., Pauliquevis, T. M., Andreae, M. O., Guyon, P., Gatti, L. V., and Cordova, A. M. L.: Physical and chemical properties of aerosols in the wet and dry seasons in Rondônia, Amazonia, J. Geophys. Res., 107, 8081, https://doi.org/10.1029/2001JD000666, 2002.
Artaxo, P., Rizzo, L. V., Brito, J. F., Barbosa, H. M. J., Arana, A., Sena, E. T., Cirino, G. G., Bastos, W., Martin, S. T., and Andreae, M. O.: Atmospheric aerosols in Amazonia and land use change: from natural biogenic to biomass burning conditions, Faraday Discuss., 165, 203, https://doi.org/10.1039/c3fd00052d, 2013.
Beddows, D. C. S., Dall'Osto, M., and Harrison, R. M.: Cluster analysis of rural, urban, and curbside atmospheric particle size data, Environ. Sci. Technol., 43, 4694–4700, 2009.
Betts, A. K., Gatti, L. V., Cordova, A. M., Silva Dias, M. A. F., and Fuentes, J. D.: Transport of ozone to the surface by convective downdrafts at night, J. Geophys. Res., 107, 1–7, https://doi.org/10.1029/2000JD000158, 2002.
Bianchi, F., Trostl, J., Junninen, H., Frege, C., Henne, S., Hoyle, C. R., Molteni, U., Herrmann, E., Adamov, A., Bukowiecki, N., Chen, X., Duplissy, J., Gysel, M., Hutterli, M., Kangasluoma, J., Kontkanen, J., Kurten, A., Manninen, H. E., Munch, S., Perakyla, O., Petaja, T., Rondo, L., Williamson, C., Weingartner, E., Curtius, J., Worsnop, D. R., Kulmala, M., Dommen, J., and Baltensperger, U.: New particle formation in the free troposphere: A question of chemistry and timing, Science, 352, 1109–1112, https://doi.org/10.1126/science.aad5456, 2016.
Bohren, C. F. and Huffman, D. R.: Absorption and scattering of light by small particles, John Wiley & Sons, 2008.
Bonn, B. and Moortgat, G. K.: Sesquiterpene ozonolysis: Origin of atmospheric new particle formation from biogenic hydrocarbons, Geophys. Res. Lett., 30, 1585, https://doi.org/10.1029/2003GL017000, 2003.
Boy, M., Karl, T., Turnipseed, A., Mauldin, R. L., Kosciuch, E., Greenberg, J., Rathbone, J., Smith, J., Held, A., Barsanti, K., Wehner, B., Bauer, S., Wiedensohler, A., Bonn, B., Kulmala, M., and Guenther, A.: New particle formation in the Front Range of the Colorado Rocky Mountains, Atmos. Chem. Phys., 8, 1577–1590, https://doi.org/10.5194/acp-8-1577-2008, 2008.
Brito, J., Rizzo, L. V., Morgan, W. T., Coe, H., Johnson, B., Haywood, J., Longo, K., Freitas, S., Andreae, M. O., and Artaxo, P.: Ground-based aerosol characterization during the South American Biomass Burning Analysis (SAMBBA) field experiment, Atmos. Chem. Phys., 14, 12069–12083, https://doi.org/10.5194/acp-14-12069-2014, 2014.
Buenrostro Mazon, S., Riipinen, I., Schultz, D. M., Valtanen, M., Dal Maso, M., Sogacheva, L., Junninen, H., Nieminen, T., Kerminen, V.-M., and Kulmala, M.: Classifying previously undefined days from eleven years of aerosol-particle-size distribution data from the SMEAR II station, Hyytiälä, Finland, Atmos. Chem. Phys., 9, 667–676, https://doi.org/10.5194/acp-9-667-2009, 2009.
Chen, Q., Farmer, D. K., Schneider, J., Zorn, S. R., Heald, C. L., Karl, T. G., Guenther, A., Allan, J. D., Robinson, N., Coe, H., Kimmel, J. R., Pauliquevis, T., Borrmann, S., Pöschl, U., Andreae, M. O., Artaxo, P., Jimenez, J. L., and Martin, S. T.: Mass spectral characterization of submicron biogenic organic particles in the Amazon Basin, Geophys. Res. Lett., 36, 1–5, https://doi.org/10.1029/2009GL039880, 2009.
Chen, Q., Farmer, D. K., Rizzo, L. V., Pauliquevis, T., Kuwata, M., Karl, T. G., Guenther, A., Allan, J. D., Coe, H., Andreae, M. O., Pöschl, U., Jimenez, J. L., Artaxo, P., and Martin, S. T.: Submicron particle mass concentrations and sources in the Amazonian wet season (AMAZE-08), Atmos. Chem. Phys., 15, 3687–3701, https://doi.org/10.5194/acp-15-3687-2015, 2015.
China, S., Wang, B., Weis, J., Rizzo, L., Brito, J., Cirino, G. G., Kovarik, L., Artaxo, P., Gilles, M. K., and Laskin, A.: Rupturing of Biological Spores As a Source of Secondary Particles in Amazonia, Environ. Sci. Technol., 50, 12179–12186, https://doi.org/10.1021/acs.est.6b02896, 2016.
Claeys, M., Graham, B., Vas, G., Wang, W., Vermeylen, R., Pashynska, V., Cafmeyer, J., Guyon, P., Andreae, M. O., Artaxo, P., and Maenhaut, W.: Formation of secondary organic aerosols through photooxidation of isoprene, Science (New York, N.Y.), 303, 1173–1176, https://doi.org/10.1126/science.1092805, 2004.
Dal Maso, M., Kulmala, M., Riipinen, I., Wagner, R., Hussein, T., Aalto, P. P., and Lehtinen, K. E. J.: Formation and growth of fresh atmospheric aerosols: eight years of aerosol size distribution data from SMEAR II, Hyytiala, Finland, Boreal Environ. Res., 10, 323–336, 2005.
Dall'Osto, M., Monahan, C., Greaney, R., Beddows, D. C. S., Harrison, R. M., Ceburnis, D., and O'Dowd, C. D.: A statistical analysis of North East Atlantic (submicron) aerosol size distributions, Atmos. Chem. Phys., 11, 12567–12578, https://doi.org/10.5194/acp-11-12567-2011, 2011.
Davidson, E. A., Araujo, A. C., Artaxo, P., Balch, J. K., Brown, I. F., Bustamante, M. M. C., Coe, M. T., Defries, R. S., Keller, M., Longo, M., Munger, J. W., Schroeder, W., Soares-Filho, B. S., Souza Jr., C. M., and Wofsy, S. C.: The Amazon basin in transition, Nature, 481, 321–328, https://doi.org/10.1038/nature10717, 2012.
de Sá, S. S., Palm, B. B., Campuzano-Jost, P., Day, D. A., Newburn, M. K., Hu, W., Isaacman-VanWertz, G., Yee, L. D., Thalman, R., Brito, J., Carbone, S., Artaxo, P., Goldstein, A. H., Manzi, A. O., Souza, R. A. F., Mei, F., Shilling, J. E., Springston, S. R., Wang, J., Surratt, J. D., Alexander, M. L., Jimenez, J. L., and Martin, S. T.: Influence of urban pollution on the production of organic particulate matter from isoprene epoxydiols in central Amazonia, Atmos. Chem. Phys., 17, 6611–6629, https://doi.org/10.5194/acp-17-6611-2017, 2017.
Ehn, M., Thornton, J. A., Kleist, E., Sipilä, M., Junninen, H., Pullinen, I., Springer, M., Rubach, F., Tillmann, R., Lee, B., Lopez-Hilfiker, F., Andres, S., Acir, I.-H., Rissanen, M., Jokinen, T., Schobesberger, S., Kangasluoma, J., Kontkanen, J., Nieminen, T., Kurtén, T., Nielsen, L. B., Jørgensen, S., Kjaergaard, H. G., Canagaratna, M., Maso, M. D., Berndt, T., Petäjä, T., Wahner, A., Kerminen, V.-M., Kulmala, M., Worsnop, D. R., Wildt, J., and Mentel, T. F.: A large source of low-volatility secondary organic aerosol, Nature, 506, 476–479, https://doi.org/10.1038/nature13032, 2014.
Elbert, W., Taylor, P. E., Andreae, M. O., and Pöschl, U.: Contribution of fungi to primary biogenic aerosols in the atmosphere: wet and dry discharged spores, carbohydrates, and inorganic ions, Atmos. Chem. Phys., 7, 4569–4588, https://doi.org/10.5194/acp-7-4569-2007, 2007.
Fuzzi, S., Decesari, S., Facchini, M. C., Cavalli, F., Emblico, L., Mircea, M., Andreae, M. O., Trebs, I., Hoffer, A., Guyon, P., Artaxo, P., Rizzo, L. V., Lara, L. L., Pauliquevis, T., Maenhaut, W., Raes, N., Chi, X., Mayol-Bracero, O. L., Soto-García, L. L., Claeys, M., Kourtchev, I., Rissler, J., Swietlicki, E., Tagliavini, E., Schkolnik, G., Falkovich, A. H., Rudich, Y., Fisch, G., and Gatti, L. V.: Overview of the inorganic and organic composition of size-segregated aerosol in Rondônia, Brazil, from the biomass-burning period to the onset of the wet season, J. Geophys. Res., 112, D01201, https://doi.org/10.1029/2005JD006741, 2007.
Gerken, T., Wei, D., Chase, R. J., Fuentes, J. D., Schumacher, C., Machado, L. A. T., Andreoli, R. V., Chamecki, M., Ferreira de Souza, R. A., Freire, L. S., Jardine, A. B., Manzi, A. O., Nascimento dos Santos, R. M., von Randow, C., dos Santos Costa, P., Stoy, P. C., Tóta, J., and Trowbridge, A. M.: Downward transport of ozone rich air and implications for atmospheric chemistry in the Amazon rainforest, Atmos. Environ., 124, 64–76, https://doi.org/10.1016/j.atmosenv.2015.11.014, 2016.
Hamed, A., Korhonen, H., Sihto, S.-L., Joutsensaari, J., Järvinen, H., Petäjä, T., Arnold, F., Nieminen, T., Kulmala, M., Smith, J. N., Lehtinen, K. E. J., and Laaksonen, A.: The role of relative humidity in continental new particle formation, J. Geophys. Res., 116, D03202, https://doi.org/10.1029/2010JD014186, 2011.
Han, Y., Iwamoto, Y., Nakayama, T., Kawamura, K., Hussein, T., and Mochida, M.: Observation of new particle formation over a mid-latitude forest facing the North Pacific, Atmos. Environ., 64, 77–84, https://doi.org/10.1016/j.atmosenv.2012.09.036, 2013.
Held, A., Nowak, A., Birmilli, W., Wiedensohler, A., Forkel, R., and Klemm, O.: Observations of particle formation and growth in a mountainous forest region in central Europe, J. Geophys. Res., 109, D23204, https://doi.org/10.1029/2004JD005346, 2004.
Hermansson, E., Roldin, P., Rusanen, A., Mogensen, D., Kivekäs, N., Väänänen, R., Boy, M., and Swietlicki, E.: Biogenic SOA formation through gas-phase oxidation and gas-to-particle partitioning – a comparison between process models of varying complexity, Atmos. Chem. Phys., 14, 11853–11869, https://doi.org/10.5194/acp-14-11853-2014, 2014.
Hoaglin, D. C., Iglewicz, B., and Tukey, J. W.: Performance of Some Resistant Performance Rules for Labeling Outlier, J. Am. Stat. Assoc., 81, 991–999, https://doi.org/10.1080/01621459.1986.10478363, 1986.
Hoppel, W. A., Frick, G. M., Fitzgerald, J. W., and Larson, R. E.: Marine boundary layer measurements of new particle formation and the effects nonprecipitating clouds have on aerosol size distribution, J. Geophys. Res., 99, 14443–14459, 1994.
Hornsby, K. and Pryor, S.: A Laboratory Comparison of Real-Time Measurement Methods for 10–100 nm Particle Size Distributions, Aerosol Sci. Technol., 48, 571–582, https://doi.org/10.1080/02786826.2014.901488, 2014.
Hu, W. W., Campuzano-Jost, P., Palm, B. B., Day, D. A., Ortega, A. M., Hayes, P. L., Krechmer, J. E., Chen, Q., Kuwata, M., Liu, Y. J., de Sá, S. S., McKinney, K., Martin, S. T., Hu, M., Budisulistiorini, S. H., Riva, M., Surratt, J. D., St. Clair, J. M., Isaacman-Van Wertz, G., Yee, L. D., Goldstein, A. H., Carbone, S., Brito, J., Artaxo, P., de Gouw, J. A., Koss, A., Wisthaler, A., Mikoviny, T., Karl, T., Kaser, L., Jud, W., Hansel, A., Docherty, K. S., Alexander, M. L., Robinson, N. H., Coe, H., Allan, J. D., Canagaratna, M. R., Paulot, F., and Jimenez, J. L.: Characterization of a real-time tracer for isoprene epoxydiols-derived secondary organic aerosol (IEPOX-SOA) from aerosol mass spectrometer measurements, Atmos. Chem. Phys., 15, 11807–11833, https://doi.org/10.5194/acp-15-11807-2015, 2015.
Huffman, J. A., Sinha, B., Garland, R. M., Snee-Pollmann, A., Gunthe, S. S., Artaxo, P., Martin, S. T., Andreae, M. O., and Pöschl, U.: Size distributions and temporal variations of biological aerosol particles in the Amazon rainforest characterized by microscopy and real-time UV-APS fluorescence techniques during AMAZE-08, Atmos. Chem. Phys., 12, 11997–12019, https://doi.org/10.5194/acp-12-11997-2012, 2012.
Hussein, T., Dal Maso, M., Petäjä, T., Koponen, I. K., Paatero, P., Aalto, P. P., Hameri, K., and Kulmala, M.: Evaluation of an automatic algorithm for fitting the particle number size distributions, Boreal Environ. Res., 10, 337–355, 2005.
Hyvönen, S., Junninen, H., Laakso, L., Dal Maso, M., Grönholm, T., Bonn, B., Keronen, P., Aalto, P., Hiltunen, V., Pohja, T., Launiainen, S., Hari, P., Mannila, H., and Kulmala, M.: A look at aerosol formation using data mining techniques, Atmos. Chem. Phys., 5, 3345–3356, https://doi.org/10.5194/acp-5-3345-2005, 2005.
IBGE: Estimativas populacionais para os municípios e para as Unidades da Federação brasileiros em 01.07.2015, Tech. rep., Instituto Brasileiro de Geografia e Estatística, available at: https://ww2.ibge.gov.br/home/estatistica/populacao/estimativa2015/estimativa_dou.shtm (last access: July 2018), 2015.
IPCC: Climate Change 2014: Synthesis Report. Contribution of Working Groups I, II and III to the Fifth Assessment Report of the Intergovernmental Panel on Climate Change, Tech. rep., IPCC, Geneva, Switzerland, 2014.
Jang, M., Czoschke, N. M., Lee, S., and Kamens, R. M.: Heterogeneous atmospheric aerosol production by acid-catalyzed particle-phase reactions, Science (New York, N.Y.), 298, 814–817, https://doi.org/10.1126/science.1075798, 2002.
Jeričević, A., Kraljević, L., Grisogono, B., Fagerli, H., and Večenaj, Ž.: Parameterization of vertical diffusion and the atmospheric boundary layer height determination in the EMEP model, Atmos. Chem. Phys., 10, 341–364, https://doi.org/10.5194/acp-10-341-2010, 2010.
Kanawade, V. P., Jobson, B. T., Guenther, A. B., Erupe, M. E., Pressley, S. N., Tripathi, S. N., and Lee, S.-H.: Isoprene suppression of new particle formation in a mixed deciduous forest, Atmos. Chem. Phys., 11, 6013–6027, https://doi.org/10.5194/acp-11-6013-2011, 2011.
Kerminen, V.-M., Paramonov, M., Anttila, T., Riipinen, I., Fountoukis, C., Korhonen, H., Asmi, E., Laakso, L., Lihavainen, H., Swietlicki, E., Svenningsson, B., Asmi, A., Pandis, S. N., Kulmala, M., and Petäjä, T.: Cloud condensation nuclei production associated with atmospheric nucleation: a synthesis based on existing literature and new results, Atmos. Chem. Phys., 12, 12037–12059, https://doi.org/10.5194/acp-12-12037-2012, 2012.
Kiendler-Scharr, A., Wildt, J., Dal Maso, M., Hohaus, T., Kleist, E., Mentel, T. F., Tillmann, R., Uerlings, R., Schurr, U., and Wahner, A.: New particle formation in forests inhibited by isoprene emissions, Nature, 461, 381–384, https://doi.org/10.1038/nature08292, 2009.
Krejci, R., Ström, J., de Reus, M., Hoor, P., Williams, J., Fischer, H., and Hansson, H.-C.: Evolution of aerosol properties over the rain forest in Surinam, South America, observed from aircraft during the LBA-CLAIRE 98 experiment, J. Geophys. Res., 108, 4561, https://doi.org/10.1029/2001JD001375, 2003.
Krejci, R., Ström, J., de Reus, M., and Sahle, W.: Single particle analysis of the accumulation mode aerosol over the northeast Amazonian tropical rain forest, Surinam, South America, Atmos. Chem. Phys., 5, 3331–3344, https://doi.org/10.5194/acp-5-3331-2005, 2005a.
Krejci, R., Ström, J., de Reus, M., Williams, J., Fischer, H., Andreae, M. O., and Hansson, H.-C.: Spatial and temporal distribution of atmospheric aerosols in the lowermost troposphere over the Amazonian tropical rainforest, Atmos. Chem. Phys., 5, 1527–1543, https://doi.org/10.5194/acp-5-1527-2005, 2005b.
Kulmala, M., Vehkamäki, H., Petäjä, T., Dalmaso, M., Lauri, A., Kerminen, V., Birmili, W., and Mcmurry, P.: Formation and growth rates of ultrafine atmospheric particles: a review of observations, J. Aerosol Sci., 35, 143–176, https://doi.org/10.1016/j.jaerosci.2003.10.003, 2004.
Kulmala, M., Asmi, A., Lappalainen, H. K., Baltensperger, U., Brenguier, J.-L., Facchini, M. C., Hansson, H.-C., Hov, Ø., O'Dowd, C. D., Pöschl, U., Wiedensohler, A., Boers, R., Boucher, O., de Leeuw, G., Denier van der Gon, H. A. C., Feichter, J., Krejci, R., Laj, P., Lihavainen, H., Lohmann, U., McFiggans, G., Mentel, T., Pilinis, C., Riipinen, I., Schulz, M., Stohl, A., Swietlicki, E., Vignati, E., Alves, C., Amann, M., Ammann, M., Arabas, S., Artaxo, P., Baars, H., Beddows, D. C. S., Bergström, R., Beukes, J. P., Bilde, M., Burkhart, J. F., Canonaco, F., Clegg, S. L., Coe, H., Crumeyrolle, S., D'Anna, B., Decesari, S., Gilardoni, S., Fischer, M., Fjaeraa, A. M., Fountoukis, C., George, C., Gomes, L., Halloran, P., Hamburger, T., Harrison, R. M., Herrmann, H., Hoffmann, T., Hoose, C., Hu, M., Hyvärinen, A., Hõrrak, U., Iinuma, Y., Iversen, T., Josipovic, M., Kanakidou, M., Kiendler-Scharr, A., Kirkevåg, A., Kiss, G., Klimont, Z., Kolmonen, P., Komppula, M., Kristjánsson, J.-E., Laakso, L., Laaksonen, A., Labonnote, L., Lanz, V. A., Lehtinen, K. E. J., Rizzo, L. V., Makkonen, R., Manninen, H. E., McMeeking, G., Merikanto, J., Minikin, A., Mirme, S., Morgan, W. T., Nemitz, E., O'Donnell, D., Panwar, T. S., Pawlowska, H., Petzold, A., Pienaar, J. J., Pio, C., Plass-Duelmer, C., Prévôt, A. S. H., Pryor, S., Reddington, C. L., Roberts, G., Rosenfeld, D., Schwarz, J., Seland, Ø., Sellegri, K., Shen, X. J., Shiraiwa, M., Siebert, H., Sierau, B., Simpson, D., Sun, J. Y., Topping, D., Tunved, P., Vaattovaara, P., Vakkari, V., Veefkind, J. P., Visschedijk, A., Vuollekoski, H., Vuolo, R., Wehner, B., Wildt, J., Woodward, S., Worsnop, D. R., van Zadelhoff, G.-J., Zardini, A. A., Zhang, K., van Zyl, P. G., Kerminen, V.-M., S Carslaw, K., and Pandis, S. N.: General overview: European Integrated project on Aerosol Cloud Climate and Air Quality interactions (EUCAARI) – integrating aerosol research from nano to global scales, Atmos. Chem. Phys., 11, 13061–13143, https://doi.org/10.5194/acp-11-13061-2011, 2011.
Kulmala, M., Kontkanen, J., Junninen, H., Lehtipalo, K., Manninen, H. E., Nieminen, T., Petäjä, T., Sipilä, M., Schobesberger, S., Rantala, P., Franchin, A., Jokinen, T., Järvinen, E., Äijälä, M., Kangasluoma, J., Hakala, J., Aalto, P. P., Paasonen, P., Mikkilä, J., Vanhanen, J., Aalto, J., Hakola, H., Makkonen, U., Ruuskanen, T., Mauldin, R. L., Duplissy, J., Vehkamäki, H., Bäck, J., Kortelainen, A., Riipinen, I., Kurtén, T., Johnston, M. V., Smith, J. N., Ehn, M., Mentel, T. F., Lehtinen, K. E. J., Laaksonen, A., Kerminen, V.-M., and Worsnop, D. R.: Direct observations of atmospheric aerosol nucleation, Science (New York, N.Y.), 339, 943–946, https://doi.org/10.1126/science.1227385, 2013.
Laakso, L., Grönholm, T., Rannik, U., Kosmale, M., Fiedler, V., Vehkamäki, H., and Kulmala, M.: Ultrafine particle scavenging coefficients calculated from 6 years field measurements, Atmos. Environ., 37, 3605–3613, 2003.
Lee, S.-H., Wilson, J. C., Baumgardner, D., Herman, R. L., Weinstock, E. M., LaFleur, B. G., Kok, G., Anderson, B., Lawson, P., Baker, B., Strawa, A., Pittman, J. V., Reeves, J. M., and Bui, T. P.: New particle formation observed in the tropical/subtropical cirrus clouds, J. Geophys. Res., 109, D20209, https://doi.org/10.1029/2004JD005033, 2004.
Lee, S.-H., Uin, J., Guenther, A. B., de Gouw, J. A., Yu, F., Nadykto, A. B., Herb, J., Ng, N. L., Koss, A., Brune, W. H., Baumann, K., Kanawade, V. P., Keutsch, F. N., Nenes, A., Olsen, K., Goldstein, A., and Ouyang, Q.: Isoprene suppression of new particle formation: Potential mechanisms and implications, J. Geophys. Res.-Atmos., 121, 14621–14635, https://doi.org/10.1002/2016JD024844, 2016.
LFA/USP: Particle size distribution measurements at the ZF2-TT34 site, available at: http://lfa.if.usp.br/ftp/public/LFA_Processed_Data/, last access: July 2018.
Lim, H.-J., Carlton, A. G., and Turpin, B. J.: Isoprene Forms Secondary Organic Aerosol through Cloud Processing: Model Simulations, Environ. Sci. Technol., 39, 4441–4446, 2005.
Limbeck, A., Kulmala, M., and Puxbaum, H.: Secondary organic aerosol formation in the atmosphere via heterogeneous reaction of gaseous isoprene on acidic particles, Geophys. Res. Lett., 30, 4–7, https://doi.org/10.1029/2003GL017738, 2003.
Löndahl, J., Pagels, J., Boman, C., Swietlicki, E., Massling, A., Rissler, J., Blomberg, A., Bohgard, M., and Sandström, T.: Deposition of biomass combustion aerosol particles in the human respiratory tract, Inhal. Toxicol., 20, 923–933, https://doi.org/10.1080/08958370802087124, 2008.
Machado, L. A. T., Laurent, H., Dessay, N., and Miranda, I.: Seasonal and diurnal variability of convection over the Amazonia: A comparison of different vegetation types and large scale forcing, Theor. Appl. Climatol., 78, 61–77, https://doi.org/10.1007/s00704-004-0044-9, 2004.
Mäkelä, J., Dal Maso, M., Pirjola, L., Keronen, P., Laakso, L., Kulmala, M., and Laaksonen, A.: Characteristics of the atmospheric particle formation events observed at a borel forest site in Southern Finland, Boreal Environ. Res., 5, 299–313, 2000.
Marengo, J. A., Liebmann, B., Kousky, V. E., Filizola, N. P., and Wainer, I. C.: Onset and End of the Rainy Season in the Brasilian Amazon Basin, J. Climate, 14, 833–852, https://doi.org/10.1175/1520-0442(2001)014<0833:OAEOTR>2.0.CO;2, 2001.
Martin, S. T., Andreae, M. O., Althausen, D., Artaxo, P., Baars, H., Borrmann, S., Chen, Q., Farmer, D. K., Guenther, A., Gunthe, S. S., Jimenez, J. L., Karl, T., Longo, K., Manzi, A., Müller, T., Pauliquevis, T., Petters, M. D., Prenni, A. J., Pöschl, U., Rizzo, L. V., Schneider, J., Smith, J. N., Swietlicki, E., Tota, J., Wang, J., Wiedensohler, A., and Zorn, S. R.: An overview of the Amazonian Aerosol Characterization Experiment 2008 (AMAZE-08), Atmos. Chem. Phys., 10, 11415–11438, https://doi.org/10.5194/acp-10-11415-2010, 2010a.
Martin, S. T., Andreae, M. O., Artaxo, P., Baumgardner, D., Chen, Q., Goldstein, A. H., Guenther, A., Heald, C. L., Bracero, O. L. M., McMurry, P. H., Pauliquevis, T., Pöschl, U., Prather, K. A., Roberts, G. C., Saleska, S. R., Dias, M. A. S., Spracklen, D. V., Swietlicki, E., and Trebs, I.: SOURCES AND PROPERTIES OF AMAZONIAN AEROSOL PARTICLES, Rev. Geophys., 48, 2008RG000280, https://doi.org/10.1029/2008RG000280, 2010b.
Martin, S. T., Artaxo, P., Machado, L. A. T., Manzi, A. O., Souza, R. A. F., Schumacher, C., Wang, J., Andreae, M. O., Barbosa, H. M. J., Fan, J., Fisch, G., Goldstein, A. H., Guenther, A., Jimenez, J. L., Pöschl, U., Silva Dias, M. A., Smith, J. N., and Wendisch, M.: Introduction: Observations and Modeling of the Green Ocean Amazon (GoAmazon2014/5), Atmos. Chem. Phys., 16, 4785–4797, https://doi.org/10.5194/acp-16-4785-2016, 2016.
McFiggans, G., Artaxo, P., Baltensperger, U., Coe, H., Facchini, M. C., Feingold, G., Fuzzi, S., Gysel, M., Laaksonen, A., Lohmann, U., Mentel, T. F., Murphy, D. M., O'Dowd, C. D., Snider, J. R., and Weingartner, E.: The effect of physical and chemical aerosol properties on warm cloud droplet activation, Atmos. Chem. Phys., 6, 2593–2649, https://doi.org/10.5194/acp-6-2593-2006, 2006.
Nunes, A. M. P., Silva Dias, M. A. F., Anselmo, E. M., and Morales, C. A.: Severe Convection Features in the Amazon Basin: A TRMM-Based 15-Year Evaluation, Front. Earth Sci., 4, 1–14, https://doi.org/10.3389/feart.2016.00037, 2016.
Öström, E., Putian, Z., Schurgers, G., Mishurov, M., Kivekäs, N., Lihavainen, H., Ehn, M., Rissanen, M. P., Kurtén, T., Boy, M., Swietlicki, E., and Roldin, P.: Modeling the role of highly oxidized multifunctional organic molecules for the growth of new particles over the boreal forest region, Atmos. Chem. Phys., 17, 8887–8901, https://doi.org/10.5194/acp-17-8887-2017, 2017.
Paasonen, P., Nieminen, T., Asmi, E., Manninen, H. E., Petäjä, T., Plass-Dülmer, C., Flentje, H., Birmili, W., Wiedensohler, A., Hõrrak, U., Metzger, A., Hamed, A., Laaksonen, A., Facchini, M. C., Kerminen, V.-M., and Kulmala, M.: On the roles of sulphuric acid and low-volatility organic vapours in the initial steps of atmospheric new particle formation, Atmos. Chem. Phys., 10, 11223–11242, https://doi.org/10.5194/acp-10-11223-2010, 2010.
Pöhlker, C., Wiedemann, K. T., Sinha, B., Shiraiwa, M., Gunthe, S. S., Smith, M., Su, H., Artaxo, P., Chen, Q., Cheng, Y., Elbert, W., Gilles, M. K., Kilcoyne, A. L. D., Moffet, R. C., Weigand, M., Martin, S. T., Pöschl, U., and Andreae, M. O.: Biogenic potassium salt particles as seeds for secondary organic aerosol in the Amazon., Science (New York, N.Y.), 337, 1075–1078, https://doi.org/10.1126/science.1223264, 2012.
Pope, C. A. and Dockery, D. W.: Health Effects of Fine Particulate Air Pollution: Lines that Connect, J. Air Waste Manag. Assoc., 56, 709–742, 2006.
Pöschl, U., Martin, S. T., Sinha, B., Chen, Q., Gunthe, S. S., Huffman, J. A., Borrmann, S., Farmer, D. K., Garland, R. M., Helas, G., Jimenez, J. L., King, S. M., Manzi, A., Mikhailov, E., Pauliquevis, T., Petters, M. D., Prenni, A. J., Roldin, P., Rose, D., Schneider, J., Su, H., Zorn, S. R., Artaxo, P., and Andreae, M. O.: Rainforest Aerosols as Biogenic Nuclei of Clouds and Precipitation in the Amazon, Science (New York, N.Y.), 329, 1513–1516, https://doi.org/10.1126/science.1191056, 2010.
Riipinen, I., Yli-Juuti, T., Pierce, J. R., Petäjä, T., Worsnop, D. R., Kulmala, M., and Donahue, N. M.: The contribution of organics to atmospheric nanoparticle growth, Nature Geosci., 5, 453–458, 2012.
Rissler, J., Swietlicki, E., Zhou, J., Roberts, G., Andreae, M. O., Gatti, L. V., and Artaxo, P.: Physical properties of the sub-micrometer aerosol over the Amazon rain forest during the wet-to-dry season transition – comparison of modeled and measured CCN concentrations, Atmos. Chem. Phys., 4, 2119–2143, https://doi.org/10.5194/acp-4-2119-2004, 2004.
Rissler, J., Vestin, A., Swietlicki, E., Fisch, G., Zhou, J., Artaxo, P., and Andreae, M. O.: Size distribution and hygroscopic properties of aerosol particles from dry-season biomass burning in Amazonia, Atmos. Chem. Phys., 6, 471–491, https://doi.org/10.5194/acp-6-471-2006, 2006.
Rizzo, L., Artaxo, P., Karl, T., Guenther, A., and Greenberg, J.: Aerosol properties, in-canopy gradients, turbulent fluxes and VOC concentrations at a pristine forest site in Amazonia, Atmos. Environ., 44, 503–511, https://doi.org/10.1016/j.atmosenv.2009.11.002, 2010.
Rizzo, L. V., Artaxo, P., Müller, T., Wiedensohler, A., Paixão, M., Cirino, G. G., Arana, A., Swietlicki, E., Roldin, P., Fors, E. O., Wiedemann, K. T., Leal, L. S. M., and Kulmala, M.: Long term measurements of aerosol optical properties at a primary forest site in Amazonia, Atmos. Chem. Phys., 13, 2391–2413, https://doi.org/10.5194/acp-13-2391-2013, 2013.
Roldin, P., Swietlicki, E., Schurgers, G., Arneth, A., Lehtinen, K. E. J., Boy, M., and Kulmala, M.: Development and evaluation of the aerosol dynamics and gas phase chemistry model ADCHEM, Atmos. Chem. Phys., 11, 5867–5896, https://doi.org/10.5194/acp-11-5867-2011, 2011.
Rolph, G.: Real-time Environmental Applications and Display sYstem (READY) Website, available at: http://ready.arl.noaa.gov (last access: July 2018), 2016.
Schiro, K. A. and Neelin, J. D.: Tropical continental downdraft characteristics: mesoscale systems versus unorganized convection, Atmos. Chem. Phys., 18, 1997–2010, https://doi.org/10.5194/acp-18-1997-2018, 2018.
Schuster, G. L., Dubovik, O., and Holben, B. N.: Angstrom exponent and bimodal aerosol size distributions, J. Geophys. Res., 111, 1–14, https://doi.org/10.1029/2005JD006328, 2006.
Spracklen, D. V., Carslaw, K. S., Kulmala, M., Kerminen, V.-M., Sihto, S.-L., Riipinen, I., Merikanto, J., Mann, G. W., Chipperfield, M. P., Wiedensohler, A., Birmili, W., and Lihavainen, H.: Contribution of particle formation to global cloud condensation nuclei concentrations, Geophys. Res. Lett., 35, L06808, https://doi.org/10.1029/2007GL033038, 2008.
Spracklen, D. V., Carslaw, K. S., Merikanto, J., Mann, G. W., Reddington, C. L., Pickering, S., Ogren, J. A., Andrews, E., Baltensperger, U., Weingartner, E., Boy, M., Kulmala, M., Laakso, L., Lihavainen, H., Kivekäs, N., Komppula, M., Mihalopoulos, N., Kouvarakis, G., Jennings, S. G., O'Dowd, C., Birmili, W., Wiedensohler, A., Weller, R., Gras, J., Laj, P., Sellegri, K., Bonn, B., Krejci, R., Laaksonen, A., Hamed, A., Minikin, A., Harrison, R. M., Talbot, R., and Sun, J.: Explaining global surface aerosol number concentrations in terms of primary emissions and particle formation, Atmos. Chem. Phys., 10, 4775–4793, https://doi.org/10.5194/acp-10-4775-2010, 2010.
Trebs, I., Meixner, F. X., Slanina, J., Otjes, R., Jongejan, P., and Andreae, M. O.: Real-time measurements of ammonia, acidic trace gases and water-soluble inorganic aerosol species at a rural site in the Amazon Basin, Atmos. Chem. Phys., 4, 967–987, https://doi.org/10.5194/acp-4-967-2004, 2004.
Tuch, T. M., Haudek, A., Müller, T., Nowak, A., Wex, H., and Wiedensohler, A.: Design and performance of an automatic regenerating adsorption aerosol dryer for continuous operation at monitoring sites, Atmos. Meas. Tech., 2, 417–422, https://doi.org/10.5194/amt-2-417-2009, 2009.
Tunved, P., Ström, J., and Hansson, H.-C.: An investigation of processes controlling the evolution of the boundary layer aerosol size distribution properties at the Swedish background station Aspvreten, Atmos. Chem. Phys., 4, 2581–2592, https://doi.org/10.5194/acp-4-2581-2004, 2004.
Vana, M., Ehn, M., Petäjä, T., Vuollekoski, H., Aalto, P., de Leeuw, G., Ceburnis, D., O'Dowd, C. D., and Kulmala, M.: Characteristic features of air ions at Mace Head on the west coast of Ireland, Atmos. Res., 90, 278–286, https://doi.org/10.1016/j.atmosres.2008.04.007, 2008.
Wang, J., Krejci, R., Giangrande, S., Kuang, C., Barbosa, H. M. J., Brito, J., Carbone, S., Chi, X., Comstock, J., Ditas, F., Lavric, J., Manninen, H. E., Mei, F., Moran-Zuloaga, D., Pöhlker, C., Pöhlker, M. L., Saturno, J., Schmid, B., Souza, R. A. F., Springston, S. R., Tomlinson, J. M., Toto, T., Walter, D., Wimmer, D., Smith, J. N., Kulmala, M., Machado, L. A. T., Artaxo, P., Andreae, M. O., Petäjä, T., and Martin, S. T.: Amazon boundary layer aerosol concentration sustained by vertical transport during rainfall, Nature, 539, 416–419, https://doi.org/10.1038/nature19819, 2016.
Wiedensohler, A., Birmili, W., Nowak, A., Sonntag, A., Weinhold, K., Merkel, M., Wehner, B., Tuch, T., Pfeifer, S., Fiebig, M., Fjäraa, A. M., Asmi, E., Sellegri, K., Depuy, R., Venzac, H., Villani, P., Laj, P., Aalto, P., Ogren, J. A., Swietlicki, E., Williams, P., Roldin, P., Quincey, P., Hüglin, C., Fierz-Schmidhauser, R., Gysel, M., Weingartner, E., Riccobono, F., Santos, S., Grüning, C., Faloon, K., Beddows, D., Harrison, R., Monahan, C., Jennings, S. G., O'Dowd, C. D., Marinoni, A., Horn, H.-G., Keck, L., Jiang, J., Scheckman, J., McMurry, P. H., Deng, Z., Zhao, C. S., Moerman, M., Henzing, B., de Leeuw, G., Löschau, G., and Bastian, S.: Mobility particle size spectrometers: harmonization of technical standards and data structure to facilitate high quality long-term observations of atmospheric particle number size distributions, Atmos. Meas. Tech., 5, 657–685, https://doi.org/10.5194/amt-5-657-2012, 2012.
Zhou, J., Swietlicki, E., Hansson, H. C., and Artaxo, P.: Submicrometer aerosol particle size distribution and hygroscopic growth measured in the Amazon rain forest during the wet season, J. Geophys. Res., 107, 8055, https://doi.org/10.1029/2000JD000203, 2002.