the Creative Commons Attribution 4.0 License.
the Creative Commons Attribution 4.0 License.
 | 09 Aug 2019
The impact of recent changes in Asian anthropogenic emissions of SO2 on sulfate loading in the upper troposphere and lower stratosphere and the associated radiative changes
Suvarna Fadnavis
Rolf Müller
Gayatry Kalita
Matthew Rowlinson
Alexandru Rap
Jui-Lin Frank Li
Blaž Gasparini
Anton Laakso
Convective transport plays a key role in aerosol enhancement in the upper troposphere and lower stratosphere (UTLS) over the Asian monsoon region where low-level convective instability persists throughout the year. We use the state-of-the-art ECHAM6–HAMMOZ global chemistry–climate model to investigate the seasonal transport of anthropogenic Asian sulfate aerosols and their impact on the UTLS. Sensitivity simulations for SO2 emission perturbation over India (48 % increase) and China (70 % decrease) are performed based on the Ozone Monitoring Instrument (OMI) satellite-observed trend, rising over India by ∼4.8 % per year and decreasing over China by ∼7.0 % per year during 2006–2017. The enhanced Indian emissions result in an increase in aerosol optical depth (AOD) loading in the UTLS by 0.61 to 4.17 % over India. These aerosols are transported to the Arctic during all seasons by the lower branch of the Brewer–Dobson circulation enhancing AOD by 0.017 % to 4.8 %. Interestingly, a reduction in SO2 emission over China inhibits the transport of Indian sulfate aerosols to the Arctic in summer-monsoon and post-monsoon seasons due to subsidence over northern India. The region of sulfate aerosol enhancement shows significant warming in the UTLS over northern India, south China (0.2±0.15 to 0.8±0.72 K) and the Arctic ( to 1.6±1.07 K). The estimated seasonal mean direct radiative forcing at the top of the atmosphere (TOA) induced by the increase in Indian SO2 emission is −0.2 to −1.5 W m−2 over northern India. The Chinese SO2 emission reduction leads to a positive radiative forcing of ∼0.6 to 6 W m−2 over China. The decrease in vertical velocity and the associated enhanced stability of the upper troposphere in response to increased Indian SO2 emissions will likely decrease rainfall over India.
Please read the corrigendum first before continuing.
-
Notice on corrigendum
The requested paper has a corresponding corrigendum published. Please read the corrigendum first before downloading the article.
-
Article
(19801 KB)
- Corrigendum
-
Supplement
(1689 KB)
-
The requested paper has a corresponding corrigendum published. Please read the corrigendum first before downloading the article.
- Article
(19801 KB) - Corrigendum
-
Supplement
(1689 KB) - BibTeX
- EndNote


Emissions of sulfur dioxide (SO2) were shown to have large detrimental effects on air quality and, therefore, human health. Moreover, increases in SO2 have effects on the hydrological cycle and crop yield (Li et al., 2017; Shawki et al., 2018). On the other hand, SO2 emissions have a cooling effect on climate, due to the increased formation of sulfate aerosols (), which are produced from the oxidation of SO2. Over the Asian region, the high emission growth of SO2 also has implications for the recurrent and more severe droughts happening during the second half of the 20th century, resulting in socioeconomic impacts (Kim et al., 2016; Paul et al., 2016; Q. Zhang et al., 2012). Its effects on precipitation deficit are via scattering of solar radiation leading to the invigoration of surface cooling, reduction in land–ocean thermal contrast and overturning of circulation (Ramanathan et al., 2005; Yeh et al.,2015; Shawki et al., 2018).
To curb its adverse effect, the implementation of international legislation on sulfur emission was enforced which resulted in a global decrease until 2000, followed by a sharp rise until 2006 and a declining trend afterward. The global rising and declining trend seem to be modulated by the emissions from China since it is the world's largest SO2-emitting country (Aas et al., 2019). While SO2, emissions over China have declined since 2006 (by ∼75 %), India shows a continued increase (∼50 %) (Krotkov et al., 2016; Li et al., 2017). The rising trend in SO2 emissions in India is due to sustained economic growth during the last few decades (Krotkov et al., 2016). According to the Indian Ocean Experiment (INDOEX) during January to March 1999 sulfate aerosols over the Indian region contribute 29 % to the observed aerosol optical depth (AOD) (Verma et al., 2012). The Aerosol Radiative Forcing over India NETwork (ARFINET) AOD measurements over India show a consistent rising annual trend of 0.004 during 1988–2013 (Babu et al., 2013). Over northern India sulfate AOD estimates vary between ∼0.10 and 0.14, and the direct radiative forcing (DRF) at the top of the atmosphere (TOA) varies between and −2.0 W m−2 (Verma et al., 2012). Globally, the current best estimate of sulfate aerosol DRF is −0.4 W m−2 (−0.6 W m−2 to −0.2 W m−2) (Myhre et al., 2013).
The long-range transport of sulfate aerosols from the Asian boundary layer to the upper troposphere and lower stratosphere (UTLS) and further northward to the Arctic (poleward of 65∘ N) alters the aerosol burden in the upper troposphere over Asia and the Arctic (Bourgeois and Bey, 2011; Yang et al., 2018). This northward extending layer from Asia to the Arctic in the UTLS affects the surface temperature and produces climatic impacts via DRF (Yang et al., 2018). The Cloud-Aerosol Lidar with Orthogonal Polarization (CALIOP) satellite measurements and model simulations indicate that 13 % (annual mean) of the sulfate in the Arctic troposphere comes from Asia (Bourgeois and Bey, 2011). The model sensitivity experiments for a 20 % emission reduction in SO2 show a decrease in the sulfate aerosol burden in the Arctic of ∼36 %–41 % when tagged with east Asian emission and ∼7 %–10 % in response to south Asian emissions. The global burden of sulfate aerosols during 1975–2000 has produced a cooling trend of 0.02 K decade−1 in surface temperature (Yang et al., 2018). The recent significant changes in SO2 emissions within Asia are likely to alter the atmospheric burden of sulfate aerosols and their impacts (on radiative forcing, clouds, temperature, etc.), both regionally and in the remote locations.
The transport of aerosols from the Asian boundary layer to the UTLS by the monsoon convection is known to form and maintain the Asian Tropopause Aerosols Layer (ATAL) (SPARC-ASAP, 2006; Fadnavis et al., 2013; Vernier et al., 2015, 2018; Yu et al., 2017). In the future, the aerosol burden in the UTLS may increase due to rising trends in aerosol emission. The enhancement in the UTLS involves complexities due to transport processes. Previous work indicates that a fraction of Asian emissions is transported to the UTLS (contributing to the ATAL associated with the monsoon anticyclone) since the majority of aerosols that grow into cloud droplets (∼80 %) are removed by precipitation. Two-thirds of the total aerosol loading that reaches the monsoon anticyclone is transported poleward through circulation in the lower stratosphere (Lelieveld et al., 2018). The observed SO2 concentrations in the monsoon anticyclone are ∼5–10 times higher than in the rest of the tropics (Lelieveld et al., 2018). The major sources of aerosols in the ATAL are found in India and China, with Indian emissions dominating the composition of the ATAL (Lau et al., 2018). Climate model simulations show that the Asian monsoon region (15–45∘ N, 30–120∘ E) is 3 times more efficient (per unit area and time) in enhancing aerosol in the Northern Hemisphere stratosphere than annually averaged tropical (15∘ N–15∘ S) upwelling (Yu et al., 2017). Although the chemical composition of the particles constituting the ATAL is not well understood, satellite observations (e.g., Cloud–Aerosol Lidar and Infrared Pathfinder Satellite Observation, CALIPSO; Stratospheric Aerosol and Gas Experiment, SAGE–II; balloon sonde and aircraft measurements; Civil Aircraft for the Regular Investigation of the atmosphere Based on an Instrumented Container, CARIBIC) suggest that ATAL particles may contain large amounts of sulfate, as well as black carbon, organic, nitrates (including ammonium nitrate) and dust (Vernier et al., 2015, 2018; Yu et al., 2016; Höpfner et al., 2019). Further, model studies suggest sulfate is, together with organics, a major chemical component of the ATAL (e.g., Fadnavis et al., 2013; Yu et al., 2017). However, there is also a model study (Gu et al., 2016) that emphasizes the importance of nitrate as a chemical component of the aerosol in the UTLS over the Tibetan Plateau and the south Asian summer-monsoon region. In addition, balloon measurements from Hyderabad, India, indicate the presence of large amounts of nitrate aerosols near the tropopause (100 ng m−3), which may be due to NOX from anthropogenic emissions, lightning and gas-to-particle conversion (Vernier et al., 2015, 2018). Further, Yu et al. (2016, 2017) report that sulfate and nitrate aerosols are important components of the ATAL. Aerosol loadings in the UTLS result in a significant impact on radiative forcing. For example, satellite observations show that the ATAL layer has exerted a regional radiative forcing at the top of the atmosphere of approximately −0.1 W m−2 in the past 18 years, thus locally reducing the impact of global warming (Vernier et al., 2015).
Over Asia, the intensity of seasonal convection is controlled by regional instability, thereby modulating the horizontal and vertical transport processes (Luo et al., 2013). The transport pathways of pollutants lifted into the upper troposphere by monsoon convection are well documented: (i) quasi-isentropic transport in the monsoon anticyclone above about 360 K from the monsoon anticyclone into the extratropical lowermost stratosphere, (ii) cross-isentropic transport from the UTLS into the tropical stratosphere by slow, radiatively driven ascent and (iii) transport of air into the stratosphere by deep convection that sometimes crosses the tropopause in the tropics (Kremser et al., 2016; Fadnavis et al., 2017a; Vogel et al., 2019). However little is known about the transport of Asian pollutants in the UTLS outside of the summer monsoon.
In this study, we address the following research questions. (1) What is the seasonal contribution of SO2 emissions from India and China to the AOD in the UTLS? (2) What is the associated radiative forcing? (3) Can the increase or decrease in Indian or Chinese SO2 emissions change the seasonal dynamics and clouds in the UTLS? For this purpose, we perform two sets of sensitivity simulations based on observed satellite trends in SO2 emissions over India (48 % increase) and China (70 % decrease) during 2006–2017 using the state-of-the-art aerosol–chemistry–climate model ECHAM6–HAMMOZ (version echam6.1.0-ham2.1-moz0.8).
The paper is organized as follows: Sect. 2 describes the model simulations and measurements used in our study. The model evaluation follows in Sect. 3. The distribution of aerosols in the UTLS is discussed in Sect. 4. The impact of sulfate aerosols on radiative forcing, cloud ice and temperature are presented in Sect. 5. Discussions are given in Sect. 6. Finally, Sect. 7 presents the conclusions of this study.
2.1 Satellite and ground-based measurements of AOD
We analyze aerosol retrievals from Multi-Angle Imaging Spectroradiometer (MISR) (level-3 version 4, at 550 nm wavelength during 2000–2016) (Martonchik et al., 2002), The MISR AOD measurements give aerosol properties over the global ocean and land with bright targets such as deserts (Kahn et al., 2001). Aerosol Robotic NETwork (AERONET) sun photometer, level 2.0 version 3 daily AOD observations during 2006–2016 (Holben et al., 1998) were also analyzed at the stations in the Indo-Gangetic Plain, (Bihar: 25.87∘ N, 84.12∘ E; Jaipur: 26.90∘ N, 75.80∘ E; Kanpur: 80.23∘ E, 26.51∘ N; Karachi: 67.13∘ E, 24.95∘ N), and China (Xianghe: 39.76∘ N, 110.00∘ E; Nghia Do: 21.04∘ N, 105.80∘ E).
2.2 SO2 measurements from the Ozone Monitoring Instrument
The Ozone Monitoring Instrument (OMI) aboard the NASA Aura spacecraft retrieves SO2 data from Earthshine radiances in the wavelength range of 310.5–340 nm (Levelt et al., 2006). It gives the total number of SO2 molecules in the entire atmospheric column above a unit area (https://disc.gsfc.nasa.gov/datasets/OMSO2e_V003/, last access: 5 August 2019). Details of the retrieval technique are documented by Li et al. (2017). To understand the impact of SO2 emission changes over India and China, we estimate a trend in the SO2 (2007–2017) over the Indian region (8–35∘ N, 70–95∘ E) and the Chinese region (20–45∘ N, 95–130∘ E) (see Fig. 2e). For this purpose, we used version 1.3, level-2, OMI retrievals that assume all SO2 is located in the planetary boundary layer. We use a regression model described by Fadnavis and Beig (2006). A model regression equation is given as follows:
where θ(t,z) is the daily mean number of SO2 molecules averaged over the Indian or Chinese region, with altitude z set to 1 km, as we use column data. The model uses the harmonic expansion to calculate the seasonal coefficient, α, and the trend coefficient, β. The harmonic expansion for α(t) is given as
where ; A0, A1, A2, …. are constants and t (t=1, 2, …n) is the time index. The estimated trend value for SO2 is 4.8±3.2 % yr−1 over the Indian region and 7.0±6.3 % yr−1 over the Chinese region (99 % confidence interval). These trend values are used while designing the model sensitivity simulations (discussed in Sect. 2.4).
2.3 CloudSat and Cloud-Aerosol Lidar Infrared Pathfinder Satellite Observations
We use the ice water content (IWC) dataset from a combination of CALIPSO lidar and CloudSat radar data (2C-ICE dataset, version L3_V01) for the period 2007–2010 (Deng et al., 2013). The Cloud Profiling Radar (CPR) onboard the CloudSat satellite is a 94 GHz nadir-looking radar which measures the power backscattered by clouds as a function of distance. It provides information on cloud abundance, distribution, structure and radiative properties. CALIOP is an elastically backscattered active polarization-sensitive lidar instrument onboard CALIPSO. CALIOP transmits laser light simultaneously at 532 and 1064 nm at a pulse repetition rate of 20.16 Hz. The lidar receiver subsystem measures backscatter intensity at 1064 nm and two orthogonally polarized components of 532 nm backscatter signal that provide the information on the vertical distribution of aerosols and clouds, cloud particle phase, and the classification of aerosol size (Winker et al., 2010). The details of the data retrieval method are explained in Li et al. (2012).
2.4 The model simulations
The ECHAM6–HAMMOZ aerosol–chemistry–climate model used in the present study comprises the ECHAM6 global climate model coupled to the two-moment aerosol and cloud microphysics module HAM (Stier et al., 2005; Tegen et al., 2019) and the sub-model for trace gas chemistry MOZ (Kinnison et al., 2007). HAM predicts the nucleation, growth, evolution and sinks of sulfate (), black carbon (BC), particulate organic matter (POM), sea salt (SS) and mineral dust (DU) aerosols. The size distribution of the aerosol population is described by seven log-normal modes with prescribed variance as in the M7 aerosol module (Stier et al., 2005; K. Zhang et al., 2012). Moreover, HAM explicitly simulates the impact of aerosol species on cloud droplet and ice crystal formation. Aerosol particles can act as cloud condensation nuclei or ice-nucleating particles. Other relevant cloud microphysical processes such as evaporation of cloud droplets, sublimation of ice crystals, ice crystal sedimentation and detrainment of ice crystals from convective cloud tops are simulated interactively (Lohmann and Ferrachat, 2010; Neubauer et al., 2014). The anthropogenic and fire emissions of sulfate, black carbon (BC) and organic carbon (OC) are based on the AEROCOM-ACCMIP-II emission inventory for the study period 2010–2011 (Textor et al., 2006). The MOZ sub-model describes the trace gas chemistry from the troposphere up to the lower thermosphere. The species included within the chemical mechanism are contained in the OX, NOX, HOX, ClOX and BrOX chemical families, along with CH4 and its degradation products. Several primary non-methane hydrocarbons (NMHCs) and related oxygenated organic compounds are also included. This mechanism contains 108 species, 71 photolytic processes, 218 gas-phase reactions and 18 heterogeneous reactions on aerosol (Kinnison et al., 2007). Details of anthropogenic, biomass burning, biogenic, emissions fossil fuel sources, etc., are reported by Fadnavis et al. (2017a).
The model simulations are performed at the T63 spectral resolution corresponding to in the horizontal dimension, while the vertical resolution is described by 47 hybrid σ−p levels from the surface up to 0.01 hPa. The model has 12 vertical levels in the UTLS (50–300 hPa). The simulations have been carried out at a time step of 20 min. Atmospheric Model Intercomparison Project (AMIP) sea surface temperature (SST) and sea ice cover (SIC) (Taylor et al., 2000) were used as lower boundary conditions. We performed 10-member ensemble runs by varying the initial conditions (both SST and SIC) starting between 1 and 10 January 2010 and ending on 31 December 2011 to obtain statistically significant results. The analysis is performed for the year 2011. The 2011 Indian monsoon was well within the long-term norm, with no strong influences from the Indian Ocean Dipole or El Niño modes of interannual climatic variability. We refer to it as the control simulation (CTRL). In previous work, Fadnavis et al. (2013, 2017b) used the ensemble means from 6 to 10 members to analyze the variability of aerosols and associated impacts during the monsoon season. In two emission sensitivity simulations we applied (1) a flat 48 % increase in anthropogenic SO2 emissions over India (referred to as Ind48 simulation) and (2) a flat 48 % increase in anthropogenic SO2 emissions over India and a flat 70 % decrease in anthropogenic SO2 emissions over China simultaneously (referred to as Ind48Chin70 simulation); the same assumptions were made for simulated years. The simulation design is based on the estimated trend of 4.8 % per year over India and −7.0 % over China, from OMI SO2 observations during 2007–2017. The Ind48 and Ind48Chin70 simulations are also 10-member ensemble runs for the same period as CTRL and are analyzed for the year 2011 (see Table 1). We compare the CTRL and Ind48 and Ind48Chin70 simulations to understand the seasonal impact of enhanced sulfate aerosol on the UTLS, radiative balance and cirrus clouds. We should mention that our simulations are canonical in design in order to show the impact of Asian sulfate aerosols; they do not include many of the observed complexities, like radiative forcing due to non-sulfate aerosols (e.g., organics, nitrates and dust). The Quasi-biennial Oscillation (QBO) is not internally generated in the model. Notwithstanding this, the present work provides valuable insight into the relevance of the impact of sulfate aerosol originating from India and China on the UTLS.
The seasons considered in this study are pre-monsoon (March–May), summer monsoon (June–September), post-monsoon (October–November) and winter (December–February).
2.5 Offline radiative calculations
We use offline radiative calculations to explore the radiative impacts of enhanced sulfate aerosol loadings in the UTLS only (300–50 hPa), compared to the all atmosphere enhancement. Radiative effects associated with the sulfate aerosol enhancement are calculated using the SOCRATES radiative transfer model (Edwards and Slingo, 1996; Rap et al., 2013) with the CLASSIC aerosol scheme (Bellouin et al., 2011). We used the offline version of the model with six shortwave and nine longwave bands and a delta-Eddington two-stream scattering solver at all wavelengths.
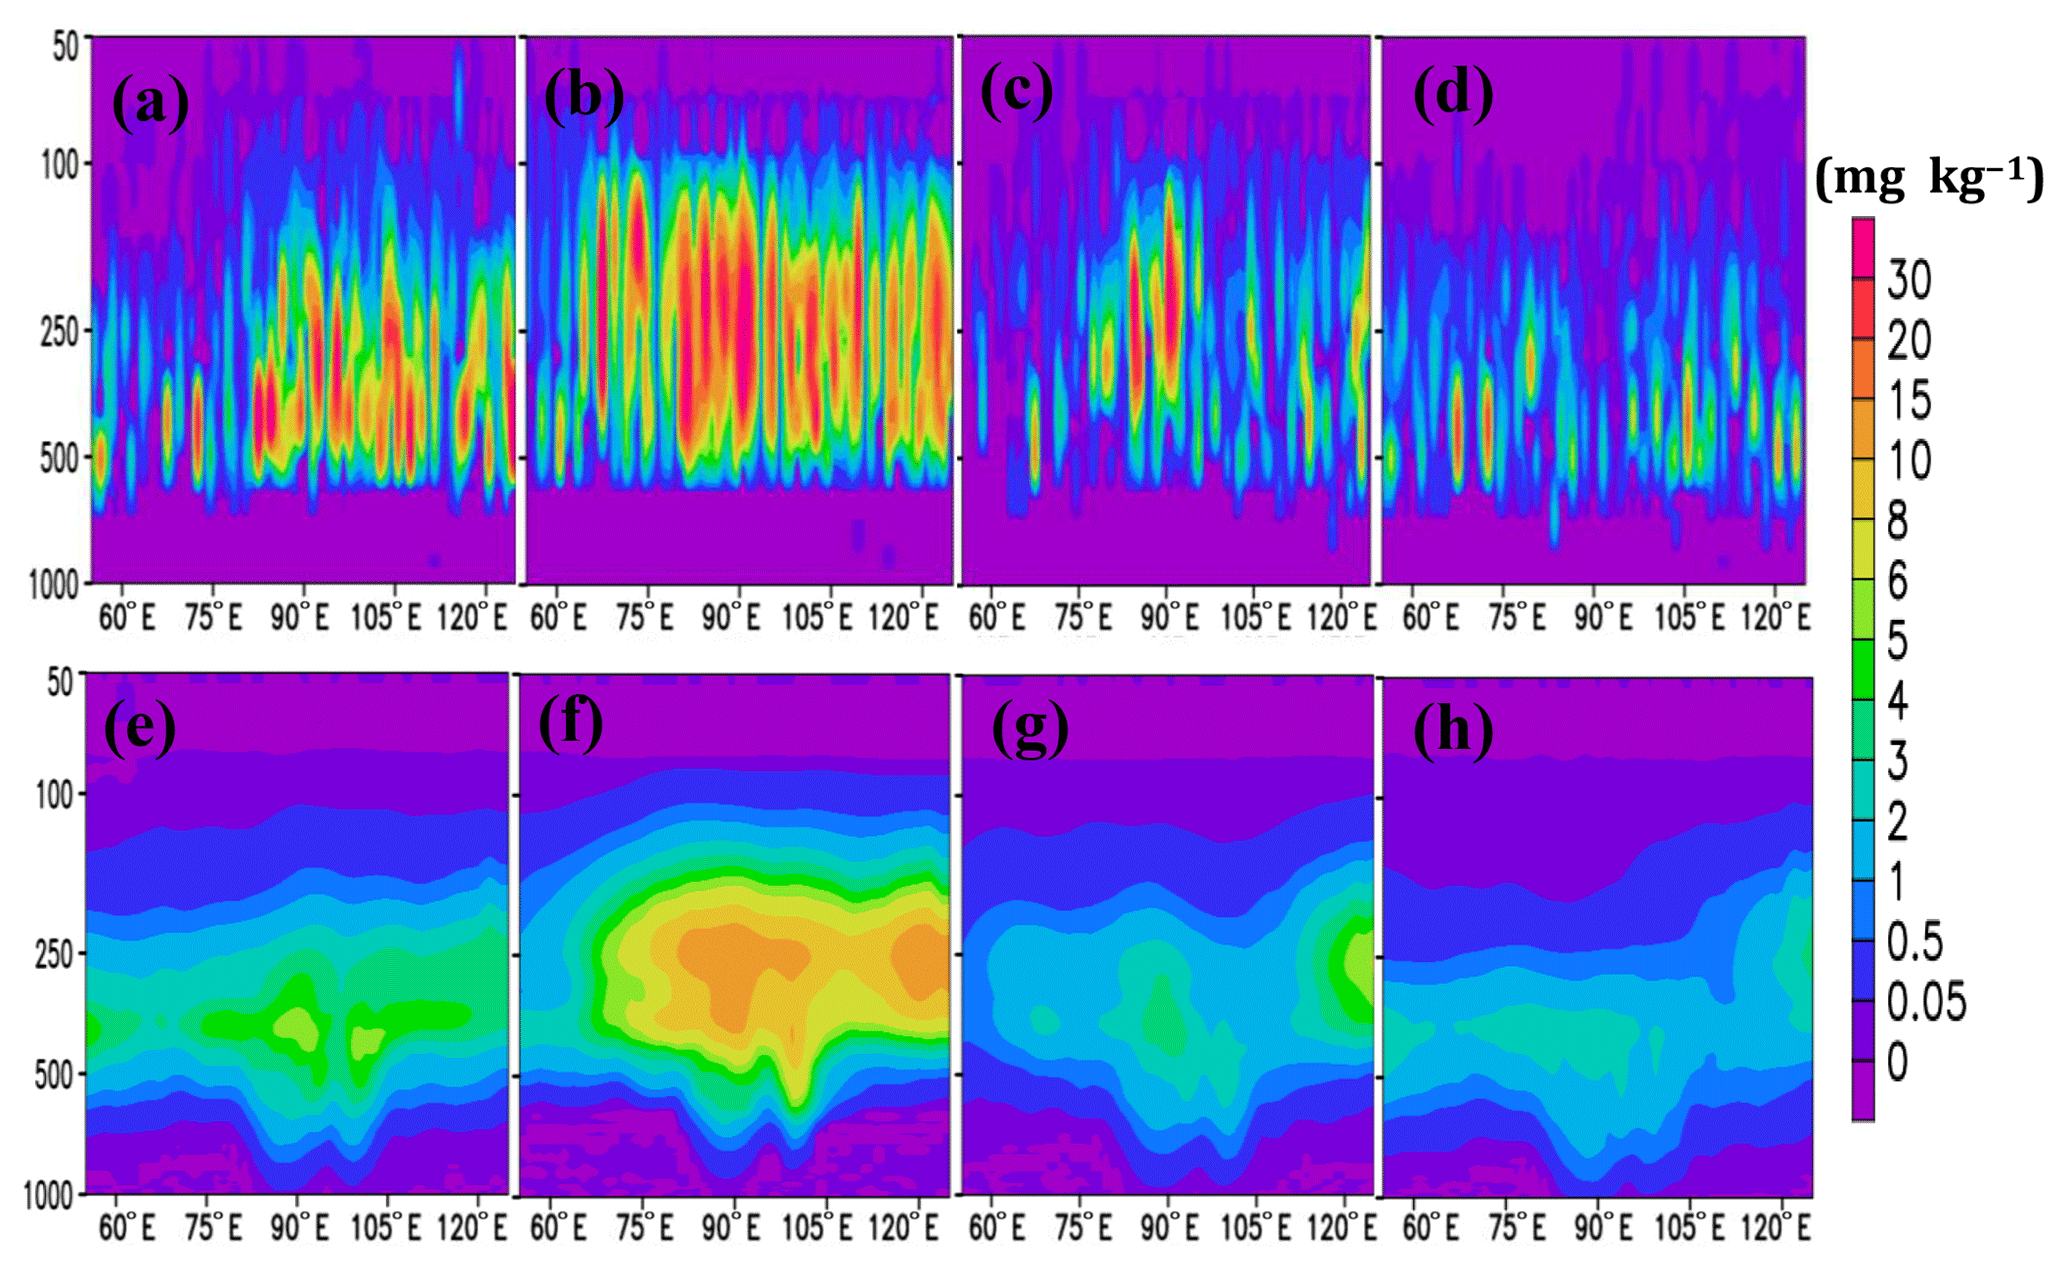
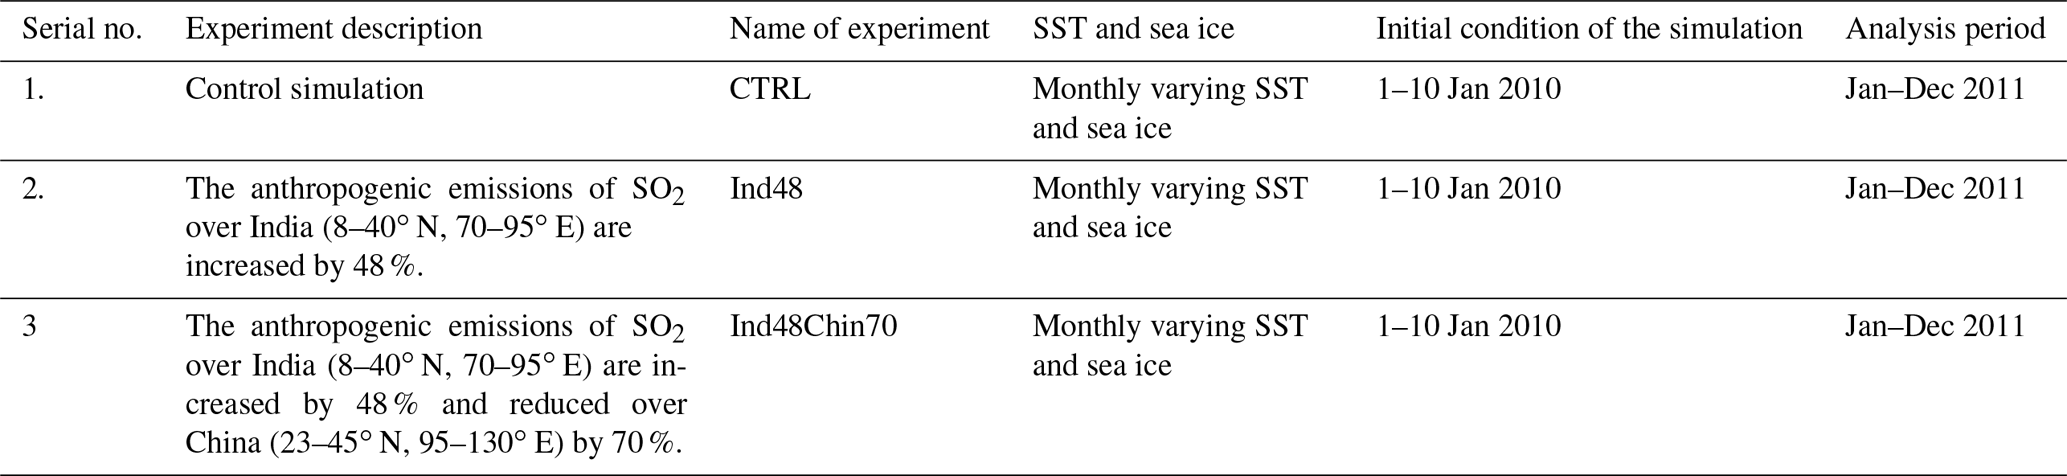
Figure 1Seasonal mean distribution (2007–2010) of cloud ice mass mixing ratio (mg kg−1) from CloudSat and CALIPSO combined 2C-ICE L3 averaged for 20–40∘ N for the (a) pre-monsoon, (b) summer-monsoon, (c) post-monsoon and (d) winter seasons; (e)–(h) same as (a)–(d) but from CTRL simulations.
In Fig. 1a–h, we show the distribution of the seasonal mean cloud ice mixing ratio from ECHAM6–HAMMOZ and combined measurements of total cloud ice from CloudSat and CALIPSO (2C-ICE) (2007–2010). Although cloud ice is underestimated in the model (∼6–15 mg kg−1; 35–45 %), the spatial distribution is well reproduced. Both the model simulations and the observations show high amounts of cloud ice in the mid–upper troposphere (450–250 hPa) over the Asian monsoon region (80–120∘ E). Cloud ice peaks during the monsoon season with a second peak in the pre-monsoon season. The observed seasonality might have links with seasonal transport processes in the troposphere (details in Sect. 4.2). The differences in model simulations and observations are due to uncertainties in satellite observations and model biases (Li et al., 2012); for example, the model does not consider large ice particles, unlike the cloud ice measurement from CloudSat and CALIPSO. The total ice water mass estimates from 2C-ICE combined measurements from CALIPSO lidar depolarization, which is sensitive to small ice particles (i.e., cloud ice represented in global climate models), and CloudSat radar, which is very sensitive to larger ice particles (i.e., precipitating ice or snow) (Li et al., 2012).
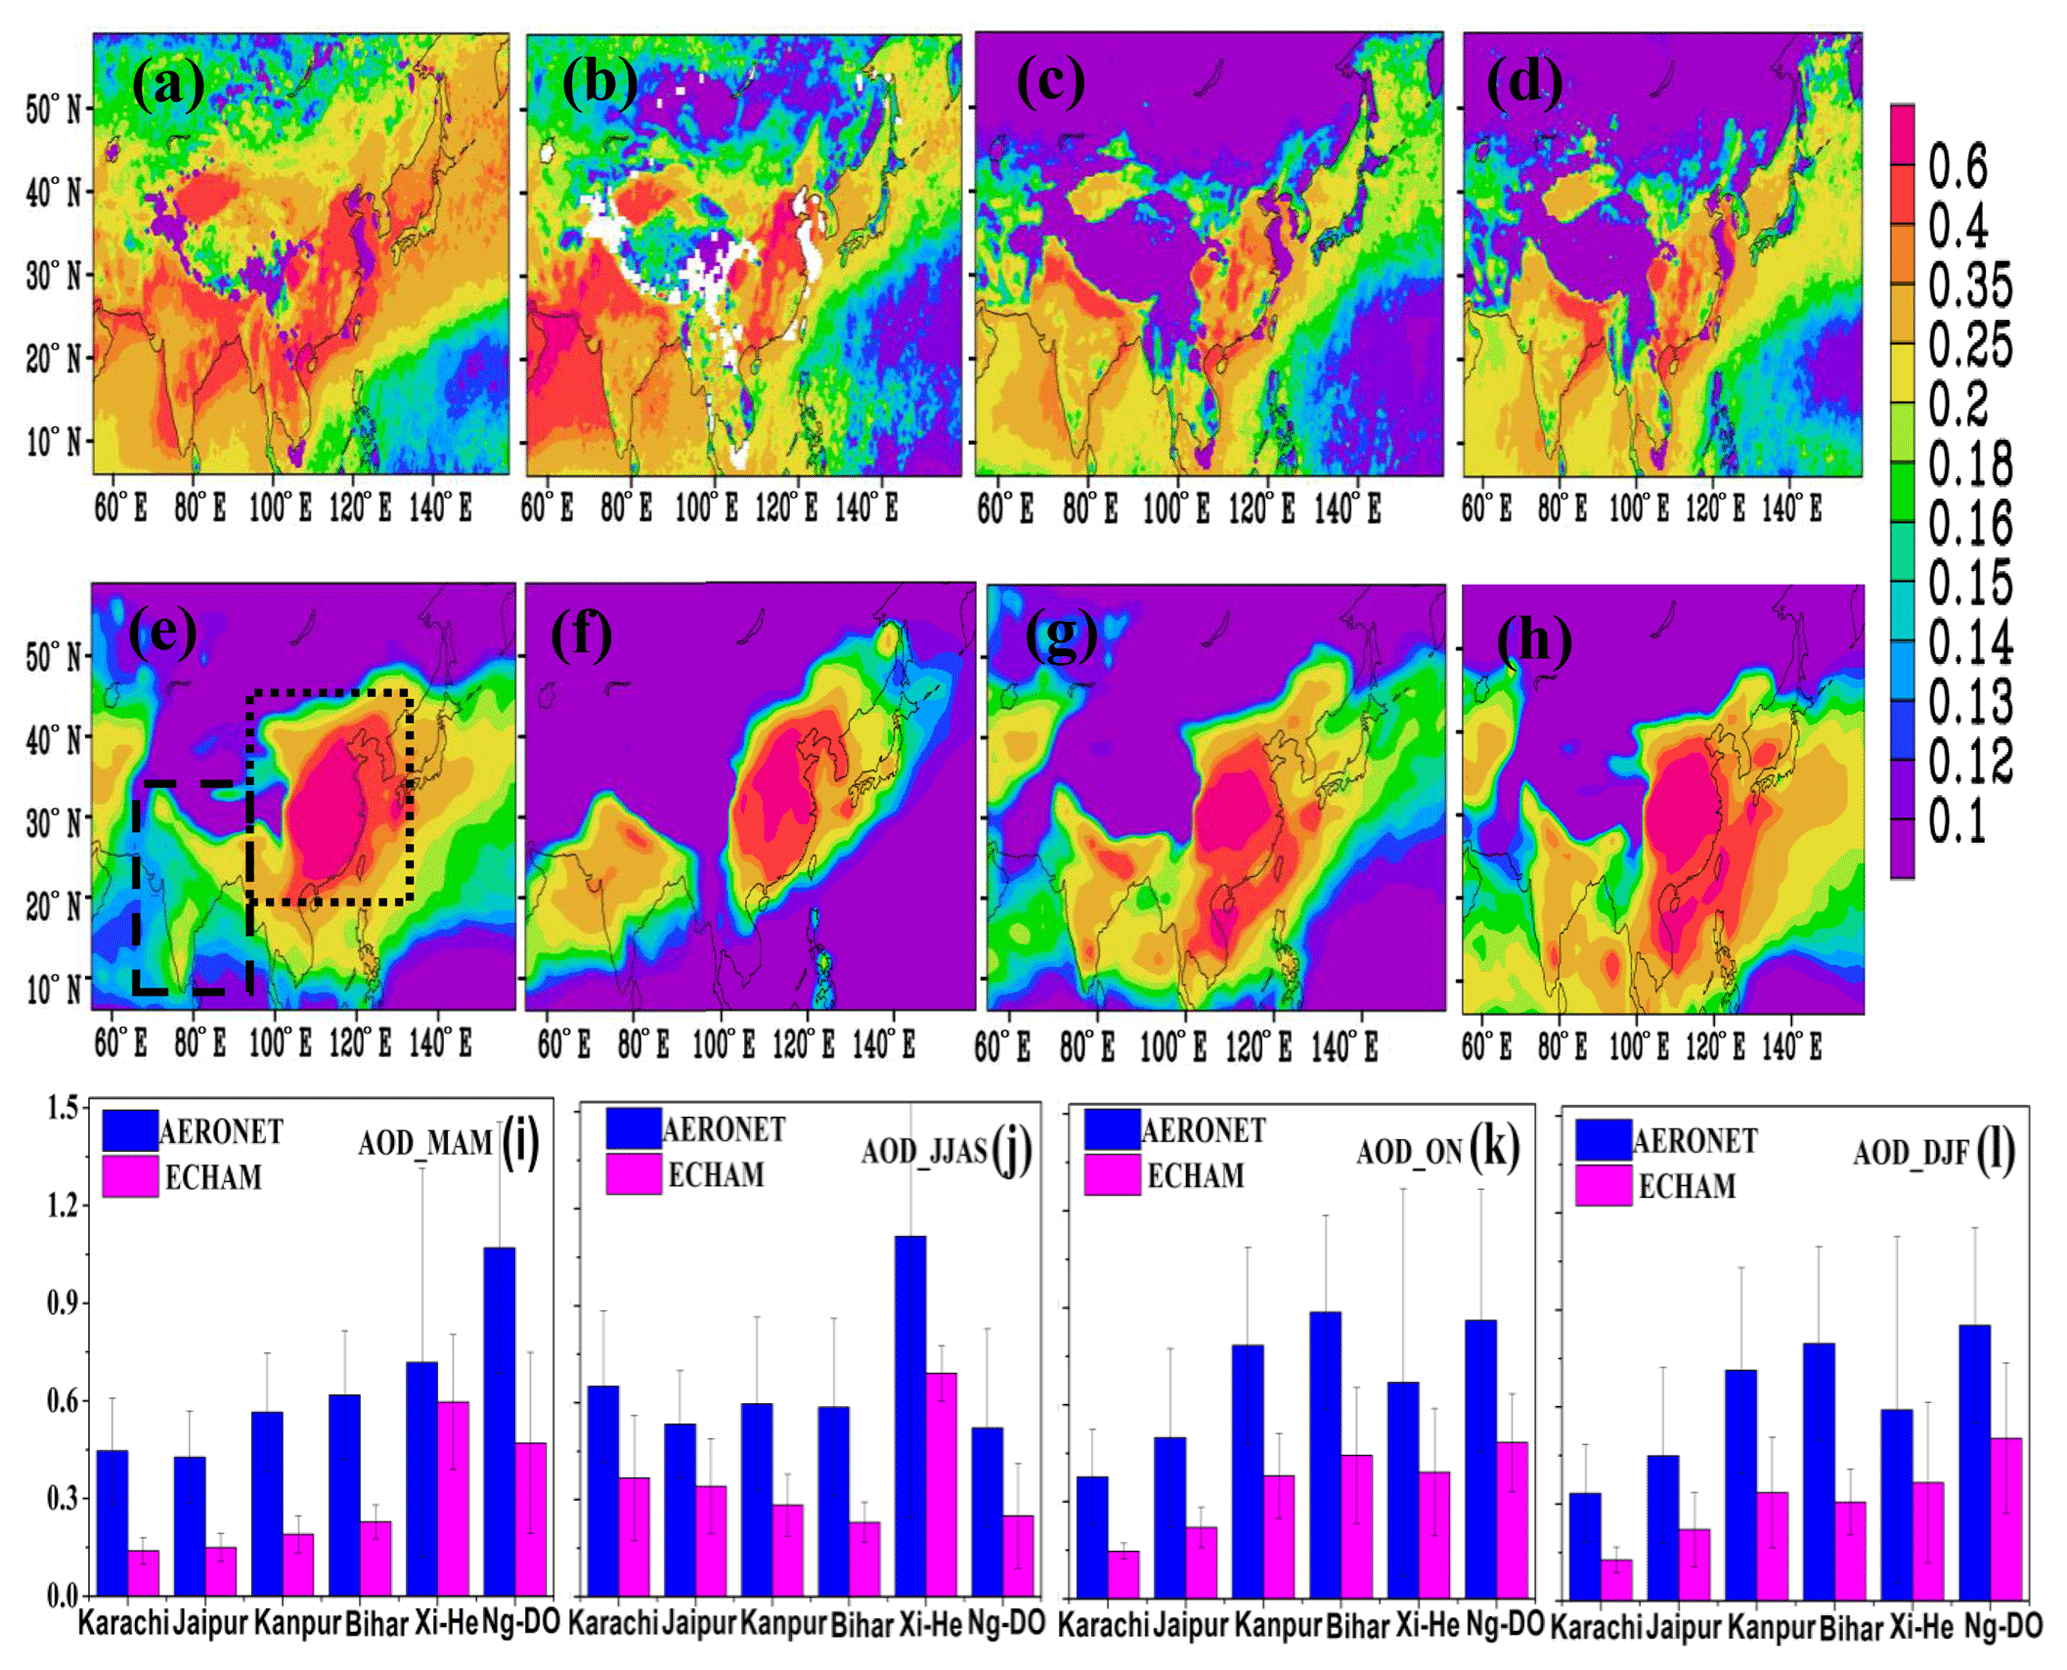
Figure 2Seasonal mean aerosol optical depth (AOD) from MISR (2000–2016) for the (a) pre-monsoon, (b) summer-monsoon, (c) post-monsoon and (d) winter seasons; (e)–(h) same as (a)–(d) but from CTRL simulations; (i)–(l) same as (a)–(d) but from AERONET (2006–2016) at the following stations: Karachi, Jaipur, Kanpur, Bihar, Xianghe, Nghia Do. The dashed box in (e) indicates the south Asian region (8–35∘ N, 70–95∘ E), where SO2 emissions are enhanced by 48 %, and the dotted box indicates Chinese region, where SO2 emissions are reduced by 70 % (20–45∘ N, 95–130∘ E).
Figure 2a–l show the distribution of seasonal mean AOD from MISR (2000–2016), model simulations (CTRL) and AERONET observations (2006–2016) (Bihar, Jaipur, Kanpur, Karachi, Xianghe, Nghia Do). The model reproduces the large AOD over the Indo-Gangetic Plains and eastern China as seen in the MISR. However, simulated AOD is underestimated in the model compared to MISR over the Indo-Gangetic Plains (∼0.4) and overestimated over eastern China (∼0.25). Comparison with AERONET observations also shows underestimation in the model AOD over the stations in the Indo-Gangetic plains and China (∼0.23–0.35). The underestimation of model AOD over India and overestimation over China in comparison with MISR is an agreement with ECHAM6–HAMMOZ simulations in Kokkola et al. (2018) and Tegen et al. (2019). The differences in the magnitude of AOD between model, satellite remote sensing (MISR) and AERONET observations may be due to various factors; e.g., satellite remote sensing detects AOD from the top of the atmosphere while AERONET detects AOD from the ground. Dumka et al. (2014) have documented that in AERONET observations, the aerosols above 4 km contribute 50 % of AOD at Kanpur (in the Indo-Gangetic plains). The inclusion of nitrate aerosol may affect the distribution of the AOD. There are also uncertainties in model estimates of sea salt emission and parameterization (Spada et al., 2013). The dust aerosols are underestimated in the model (Kokkola et al., 2018). The majority of Coupled Model Intercomparison Project Phase 5 (CMIP5) models underestimate global mean dust optical depth (Pu and Ginoux, 2018). During the monsoon season, the large AOD values near 25∘ N, 75∘ E are likely due to the presence of high amounts of sea salt and water-soluble aerosols in the model.
4.1 A layer of aerosol in the UTLS
The Asian region (8–45∘ N, 70–130∘ E) experiences convective instability throughout the year with a peak in the monsoon season (Manohar et al., 1999; Luo, 2013). The distribution of seasonal mean outgoing longwave radiation, simulated ice crystal number concentration and cloud droplet number concentrations representing convection is shown in Fig. S1 in the Supplement. It depicts convection over the Asian region rising to the upper troposphere throughout the year and is widespread during the monsoon season. The summer-monsoon convection lifts the boundary layer aerosols to the upper troposphere, leading to the formation of the Asian Tropopause Aerosol Layer (ATAL) (Fadnavis et al., 2013; Vernier et al., 2015). The CALIPSO lidar and Stratospheric Aerosol and Gas Experiment II (SAGE-II) satellite observations reveal that the ATAL extends over a wider Asian region (15–40∘ N, 60–120∘ E) between 12 and 18 km (Vernier et al., 2015; Fadnavis et al., 2013). The ECHAM6–HAMMOZ simulations reproduce the formation of an ATAL (extinction and sulfate aerosol) in the UTLS during the summer-monsoon season (Fig. 3a–b). The aerosol layer in the UTLS is connected to the troposphere during the pre-monsoon, indicating the transport of tropospheric aerosols into the UTLS. From March to November, the altitude of convective outflow propagates deeper into the UTLS. Strong uplift during the summer-monsoon season lifts the mid-tropospheric aerosols and aerosol precursors to the UTLS, generating aerosol minima in the mid-troposphere (Fadnavis et al., 2013). During the summer-monsoon season, the convective transport mostly occurs from the Bay of Bengal, the South China Sea and southern slopes of the Himalayas (Fadnavis et al., 2013; Medina et al., 2010). After the convective uplift, at altitudes above ∼360 K, radiatively driven upward transport in the anticyclonic monsoon circulation occurs at a rate of ∼1 K d−1; this is a slower uplift than convection but faster than outside the anticyclone (Vogel et al., 2019). The simulated distribution of aerosol extinction and sulfate aerosols at 100 hPa from the CTRL simulation shown in Fig. 3c–d indicates maxima in aerosol extinction (Fig. 2c) and sulfate aerosols (Fig. 2d) in the anticyclone region.
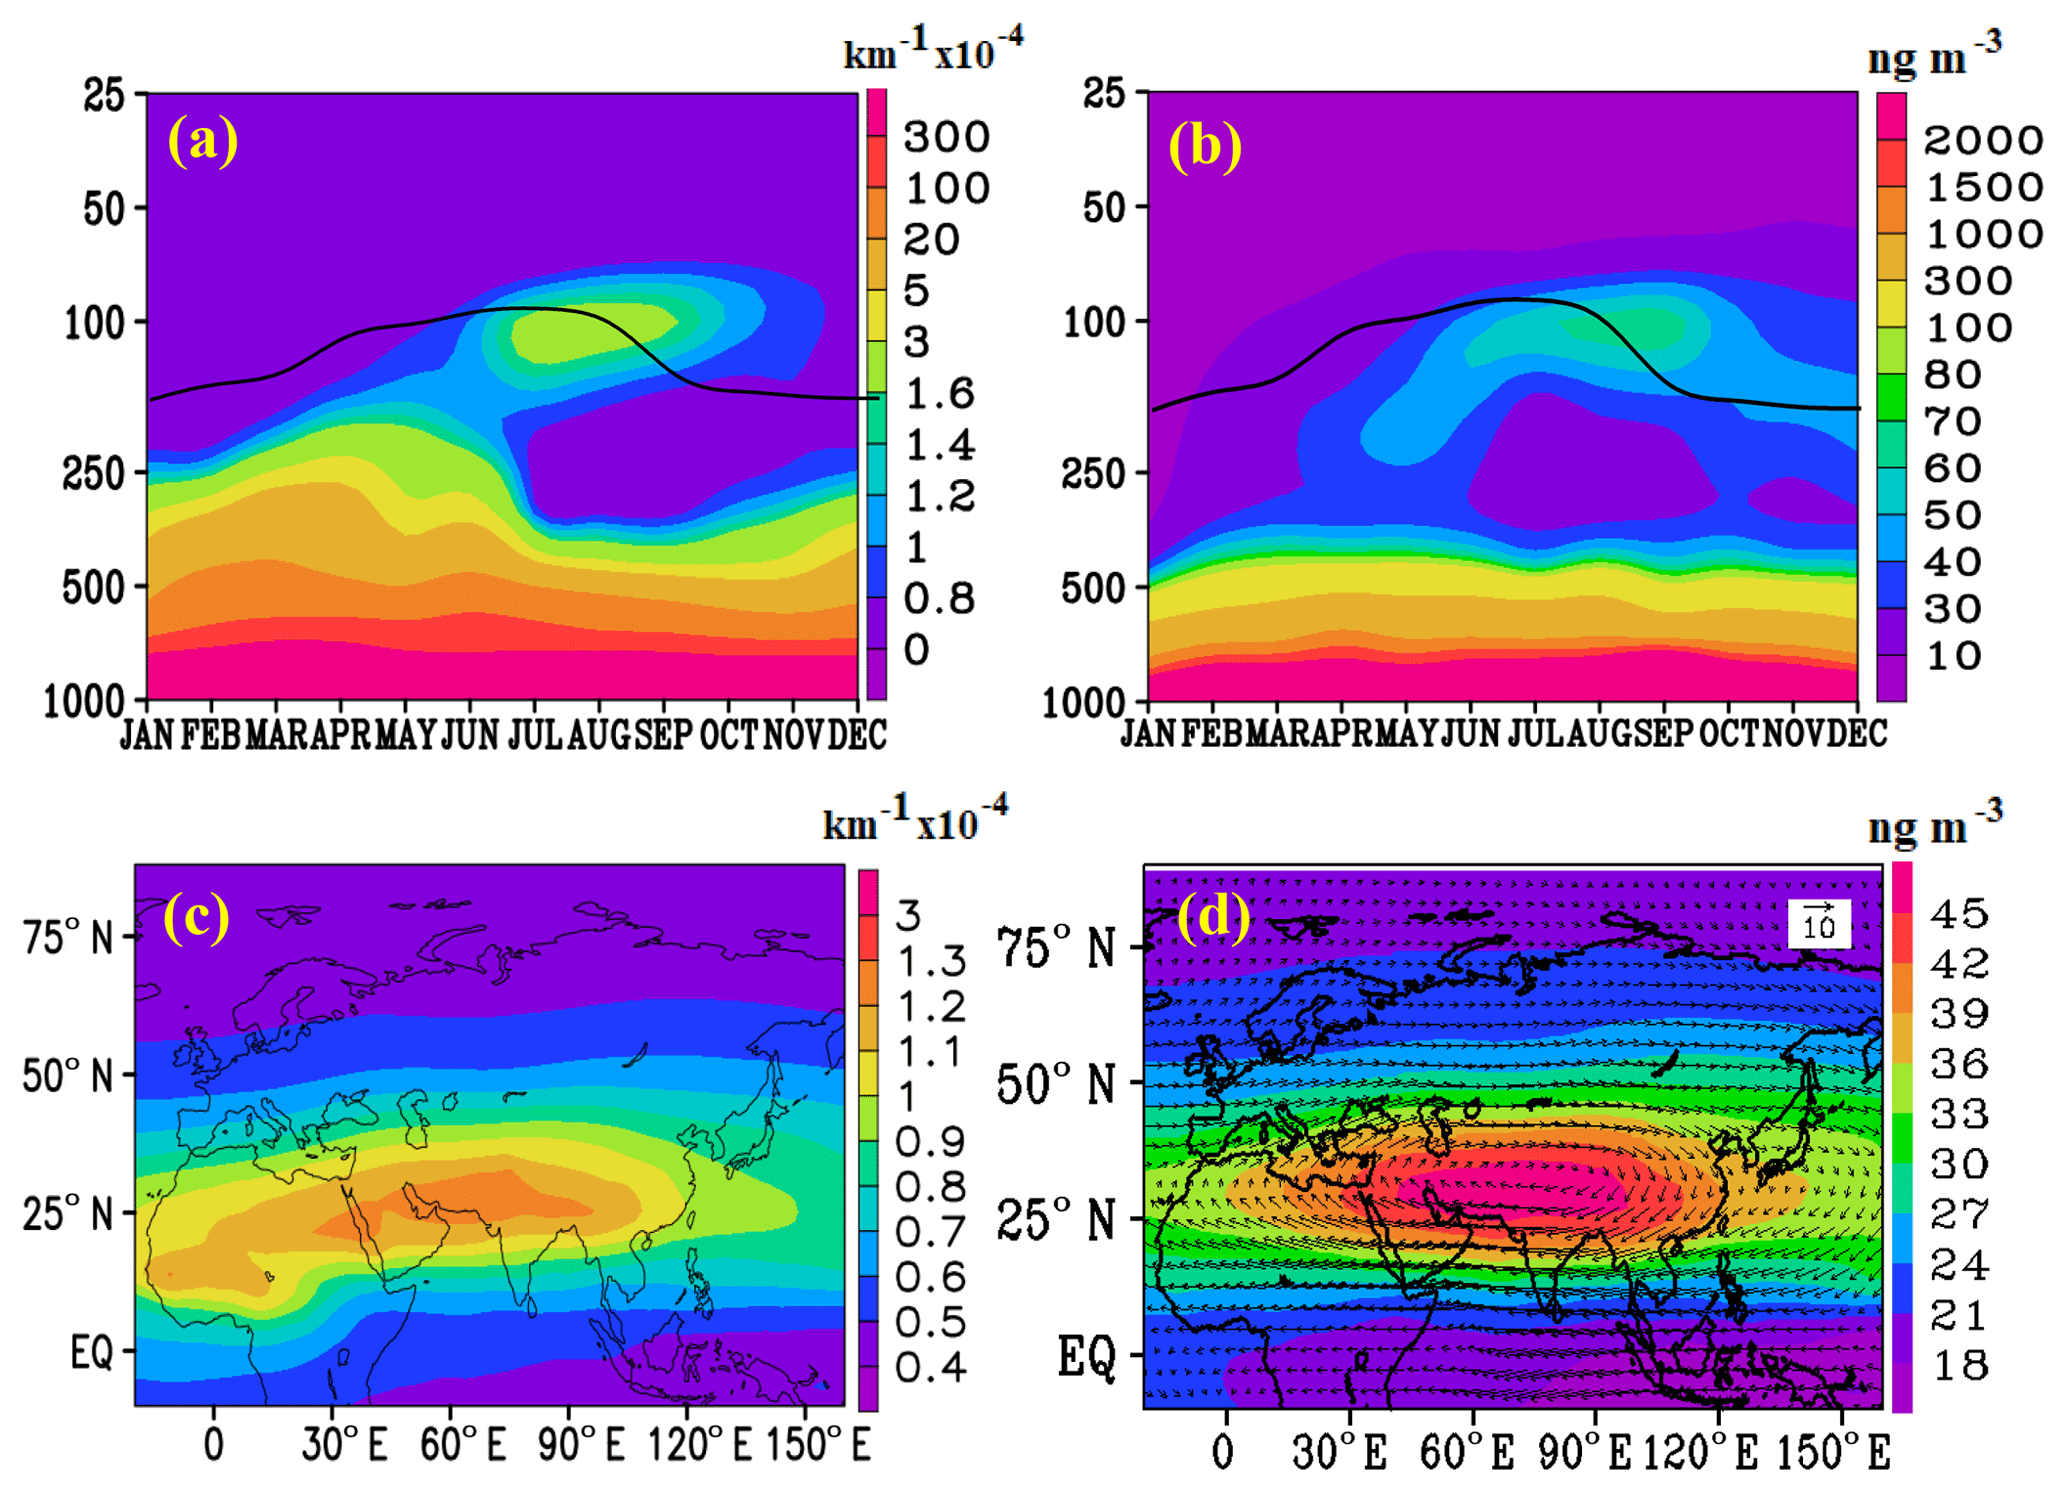
Figure 3Monthly vertical variation in (a) extinction (km−1 × 10⁻⁴) averaged for 25–40∘ N, 70–120∘ E; (b) same as (a) but for sulfate aerosols (ng m−3); (c) distribution aerosol extinction (km−1 × 10⁻⁴) at 100 hPa averaged for the summer-monsoon season; (d) distribution of sulfate aerosol (ng m−3) at 100 hPa averaged for the summer-monsoon season. Wind vectors in (d) indicate the extent of the anticyclone. Panels (a)–(d) are obtained from CTRL simulations. The black line in (a) and (b) indicates the tropopause.
The estimated ratio of ECHAM6–HAMMOZ simulated sulfate aerosols in the UTLS to the total aerosol amount is 6:10 pointing to sulfate aerosols as a major ATAL constituent. Balloon sonde observations over south Asia also indicate that large amounts of sulfate aerosols may be present in the ATAL (Vernier et al., 2015). Tropospheric SO2 and sulfate aerosol transported into the stratosphere during volcanically quiescent periods are potentially large contributors to the stratospheric aerosol burden (SPARC-ASAP, 2006).
4.2 Transport into the upper troposphere and lower stratosphere
We investigate the transport pathways of sulfate aerosol during different seasons from anomalies in sulfate aerosol for (1) Ind48 and (2) Ind48Chin70 simulations. Firstly, we present a vertical distribution of anomalies (relative to CTRL) in sulfate aerosol for Ind48 simulations in Fig. 4a–h. The striking feature is the poleward transport of Indian emissions in the UTLS throughout the year. A layer of sulfate aerosol enhancement extending from India to the Arctic (68–90∘ N) is seen near the tropopause during pre-monsoon (3–15 ng m−3) and in the lowermost stratosphere during summer-monsoon (2–15 ng m−3), post-monsoon (2–6 ng m−3) and winter (0.5–3 ng m−3) seasons. This layer may be due to the transport of Indian sulfate aerosols to the Arctic by the lower branch of the Brewer–Dobson circulation – the AOD in the UTLS is 0.184×10⁴ (i.e., 1.1 %) to (i.e., 4.17 %) over India and the Arctic (seasonal details in Table 2). Past studies also indicate the transport of pollution from south Asia and east Asia to the Arctic predominantly in the UTLS (Shindell et al., 2008; Fisher et al., 2011). From multi-model simulations, Shindell et al. (2008) show that seasonally varying the transport of south Asian sulfate aerosols to the Arctic maximizes in the pre-monsoon season. This enhancement of sulfate aerosols that maximizes during the pre-monsoon is also illustrated in Fig. 4a.
Table 2Seasonal mean AOD in the UTLS (300–90 hPa) over India (20–35∘ N, 75–95∘ E) and the Arctic (65–85∘ N, 75–97∘ E) from simulations performed. AOD is calculated at different altitude ranges indicated in brackets for some seasons since the sulfate aerosol layer varies in altitude in the UTLS.
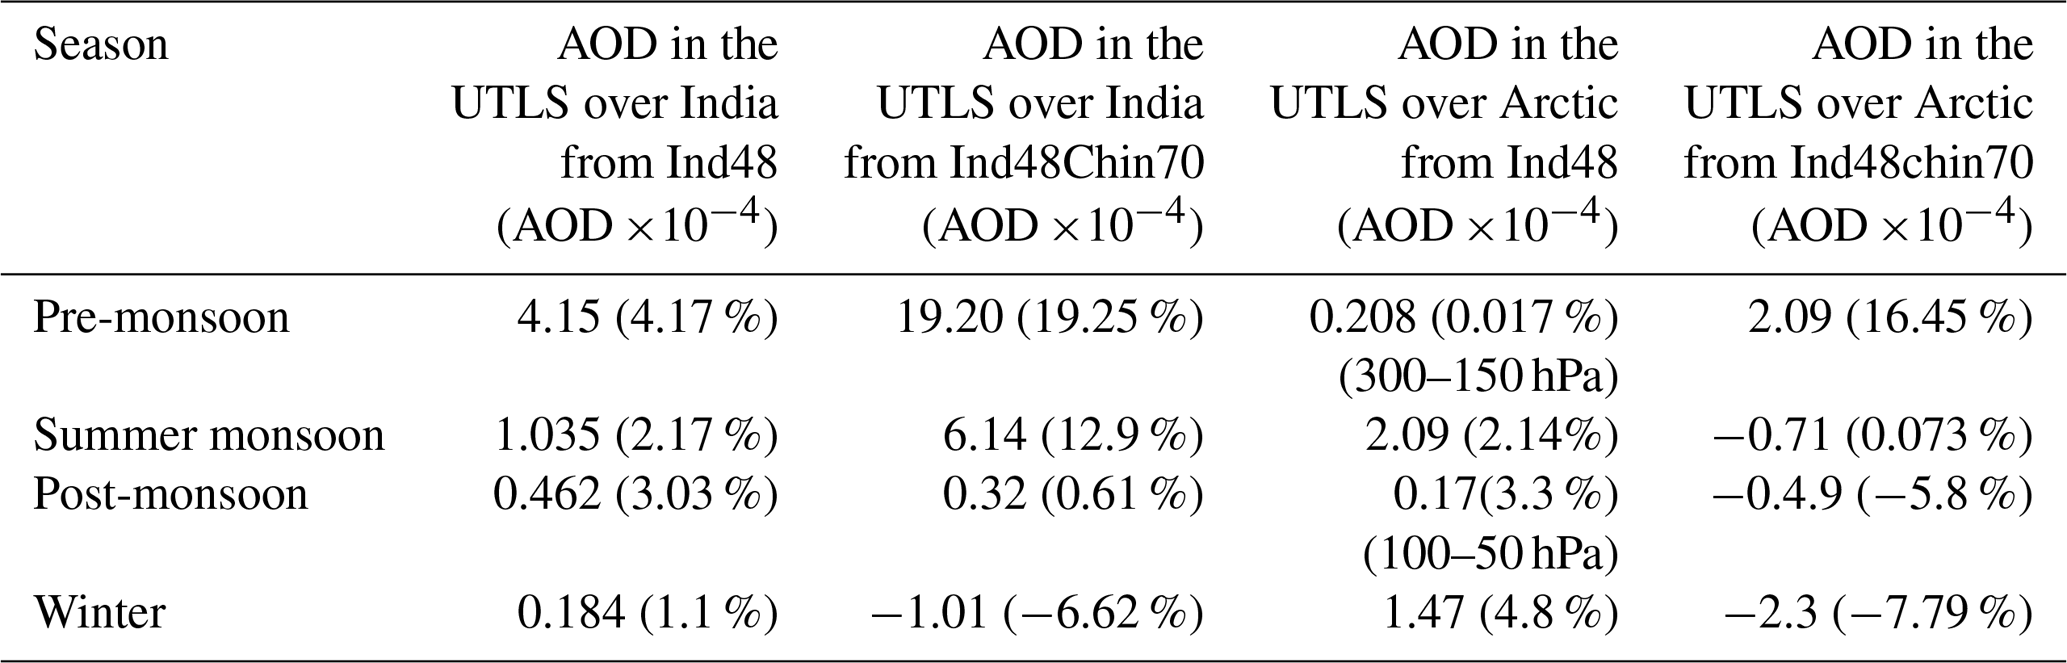
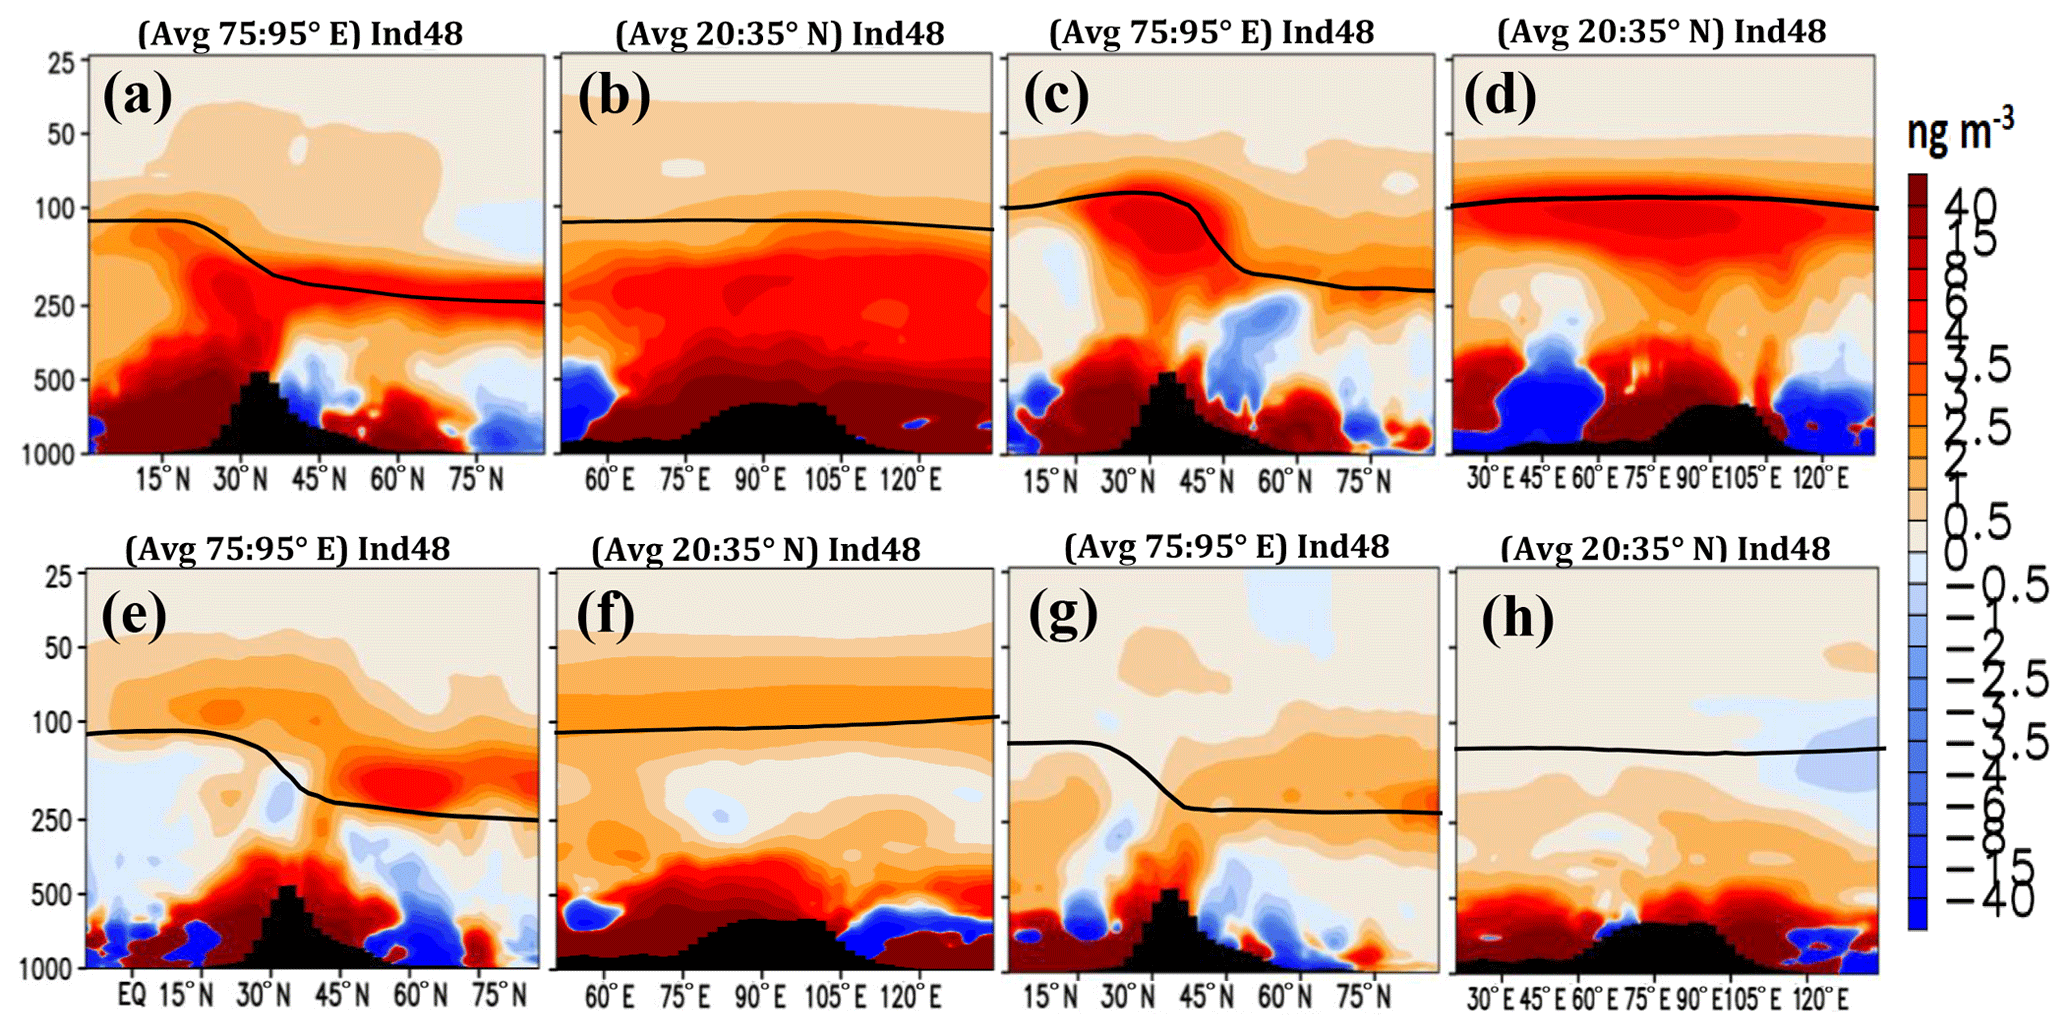
Figure 4Vertical cross section of anomalies in sulfate aerosols (ng m−3) from Ind48-CTRL simulations for the pre-monsoon season (a) latitude–pressure section and (b) longitude–pressure section; (c)–(d) same as (a)–(b) but for the summer-monsoon season; (e)–(f) same as (a)–(b) but for the post-monsoon season; (g)–(h) same as (a)–(b) but for the winter season. The averages obtained over latitudes or longitudes are indicated in each panel. The black vertical bars indicate topography, and a black line indicates the tropopause.
Figure 4 also shows that during most seasons the vertical transport occurs from the Bay of Bengal, the Arabian Sea and southern slopes of the Himalayas (15–35∘ N, 60–100∘ E), except during the post-monsoon season when it occurs from the west Asia and Tibetan Plateau region (20–35∘ N, 60–95∘ E). This may be due to the transport of sulfate aerosols from India to these regions, which might have been lifted to the UTLS by post-monsoon convection (see Figs. S1c, h, k, and S2 c). The enhancement of sulfate aerosols in the monsoon anticyclone (an ATAL feature) and the cross-tropopause transport associated with the summer-monsoon convection is evident in Fig. 4c–d (enhancement ∼5–15 ng m−3; 10 %–36 %). Past studies show that the aerosols transported into the lower stratosphere by the monsoon convection are recirculated in the stratosphere by the lower branch of the Brewer–Dobson circulation (Randel and Jensen, 2013; Fadnavis et al., 2013, 2017b). Yu et al. (2017) report that ∼15 % of the Northern Hemisphere column stratospheric aerosol originates from the Asian summer-monsoon anticyclone region. Figure 4d shows that aerosols spread to east and west from the anticyclone (20–120∘ E), likely due to east- or westward eddy shedding from the anticyclone (Fadnavis and Chattopadhyay, 2017; Fadnavis et al., 2018). Eddy shedding is not evident in the seasonal mean distribution (Fig. 3b) due to its short duration (i.e., days) and episodic nature.
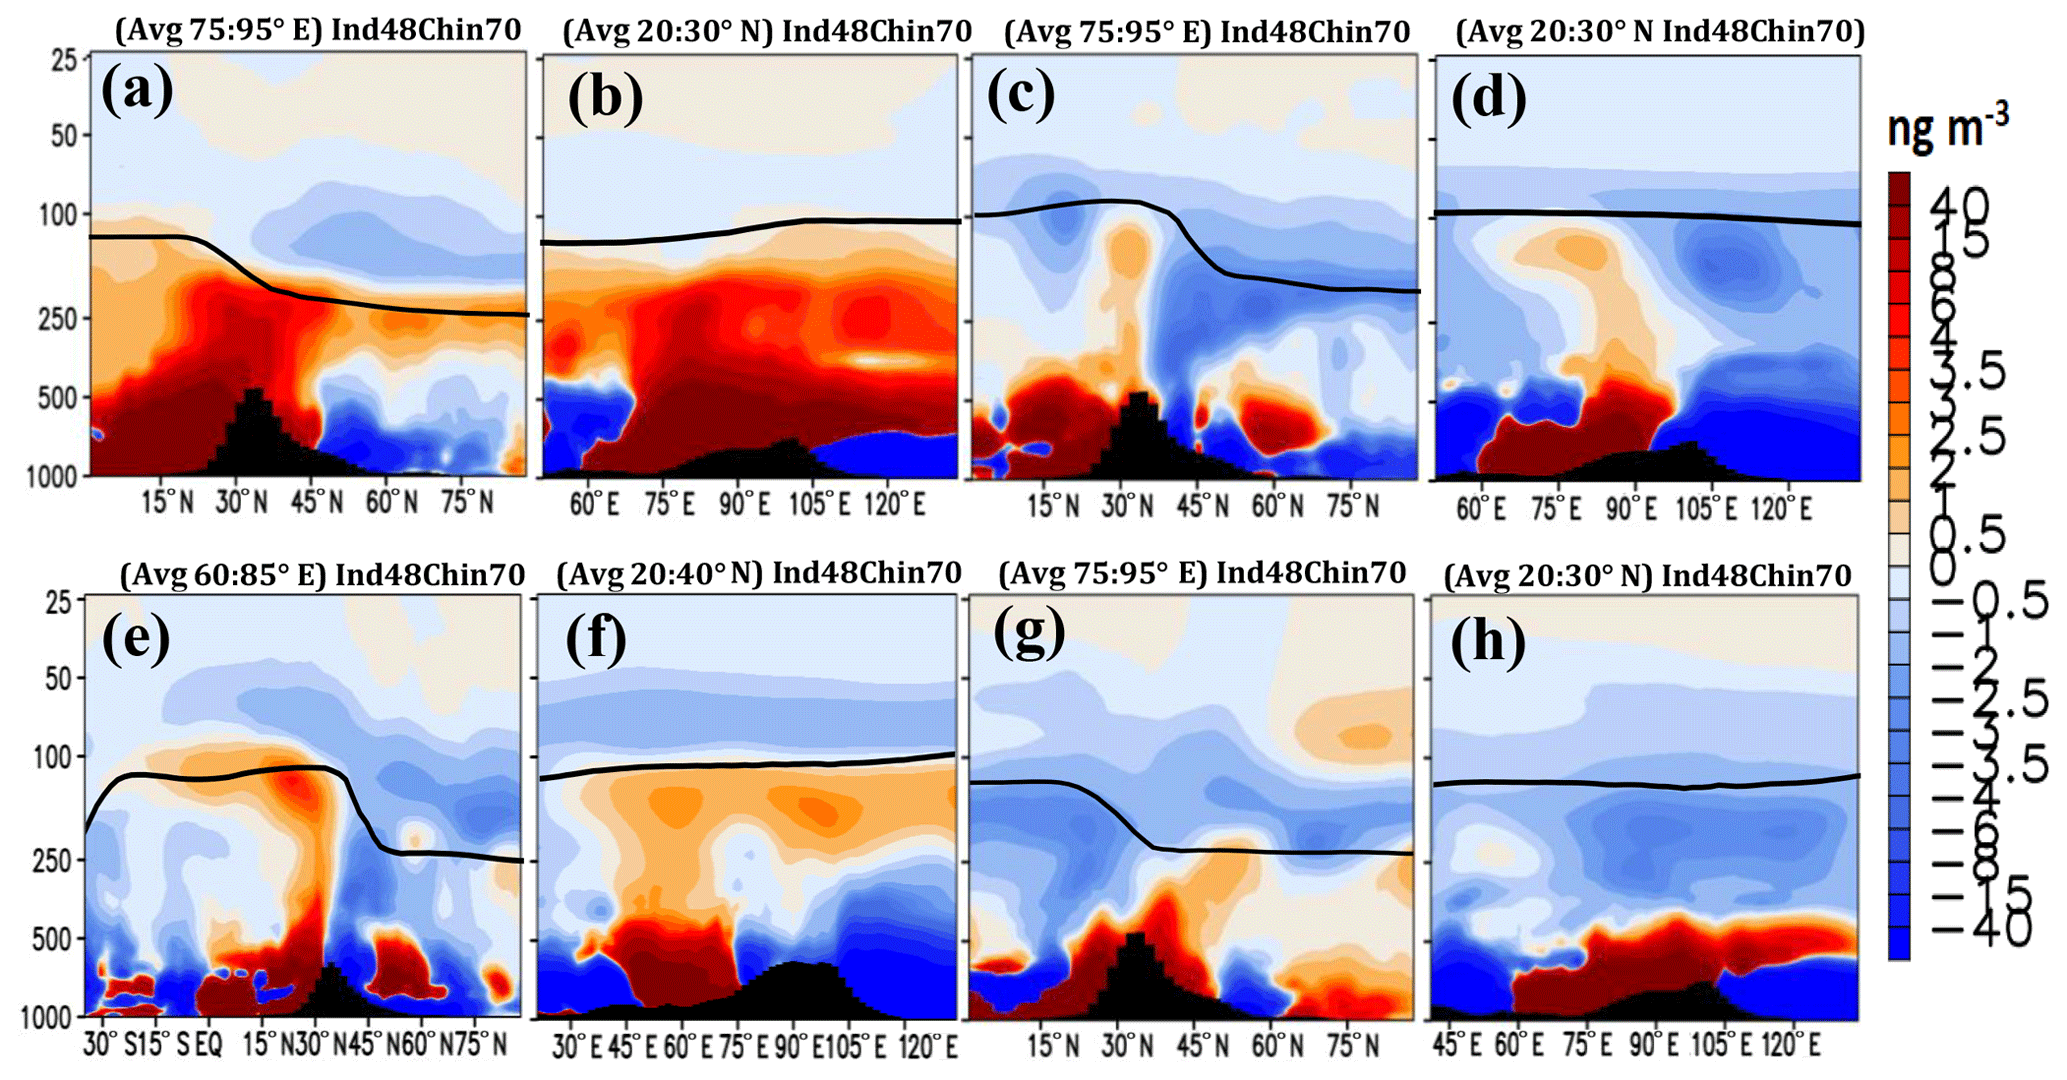
Figure 5Vertical cross section of anomalies in sulfate aerosols (ng m−3) from the Ind48Chin70-CTRL simulation for the pre-monsoon season (a) latitude–pressure section and (b) longitude–pressure section; (c)–(d) same as (a)–(b) but for the summer-monsoon season; (e)–(f) same as (a)–(b) but for the post-monsoon season; (g)–(h) same as (a)–(b) but for the winter season. The averages obtained over latitudes or longitudes are indicated in each panel. The black vertical bars indicate topography, and a black line indicates the tropopause.
The influence of the Chinese SO2 emission reduction (Ind48Chin70) on the vertical distribution of sulfate aerosols is shown in Fig. 5a–h. In the pre-monsoon season, the transport pattern is similar to the Ind48 simulations; however, the enhancement of sulfate aerosols at the Arctic tropopause is significantly hindered (1–3 ng m−3). The subsidence over north India (20–35∘ N) has prevented sulfate aerosols from crossing the tropopause (Fig. 9a, e). A feeble plume tilted westward is seen during the monsoon season (Fig. 5c–d), and it is eastward and equatorward during the post-monsoon due to changes in circulations (ascending winds over south India and strong subsidence over north India; Fig. 9f–g). Entrainment into the anticyclone and cross-tropopause transport of the sulfate aerosols, seen in the Ind48 simulation, is inhibited by this subsidence. Interestingly, during summer-monsoon and post-monsoon seasons, poleward transport of south Asian sulfate aerosols has also been cut off due to circulation changes (subsidence over north India; see below in Fig. 9f–g). During winter, vertical winds over ∼20∘ N lift aerosols from India to the mid-troposphere and further transport them to the Arctic (Figs. 5k–l, 9h). The vertical transport of sulfate aerosols increases AOD in the UTLS over India by (0.61 %) to (19.25 %) (except in winter), and it increases over the Arctic by (16.45 %) during the pre-monsoon season (see Table 2).
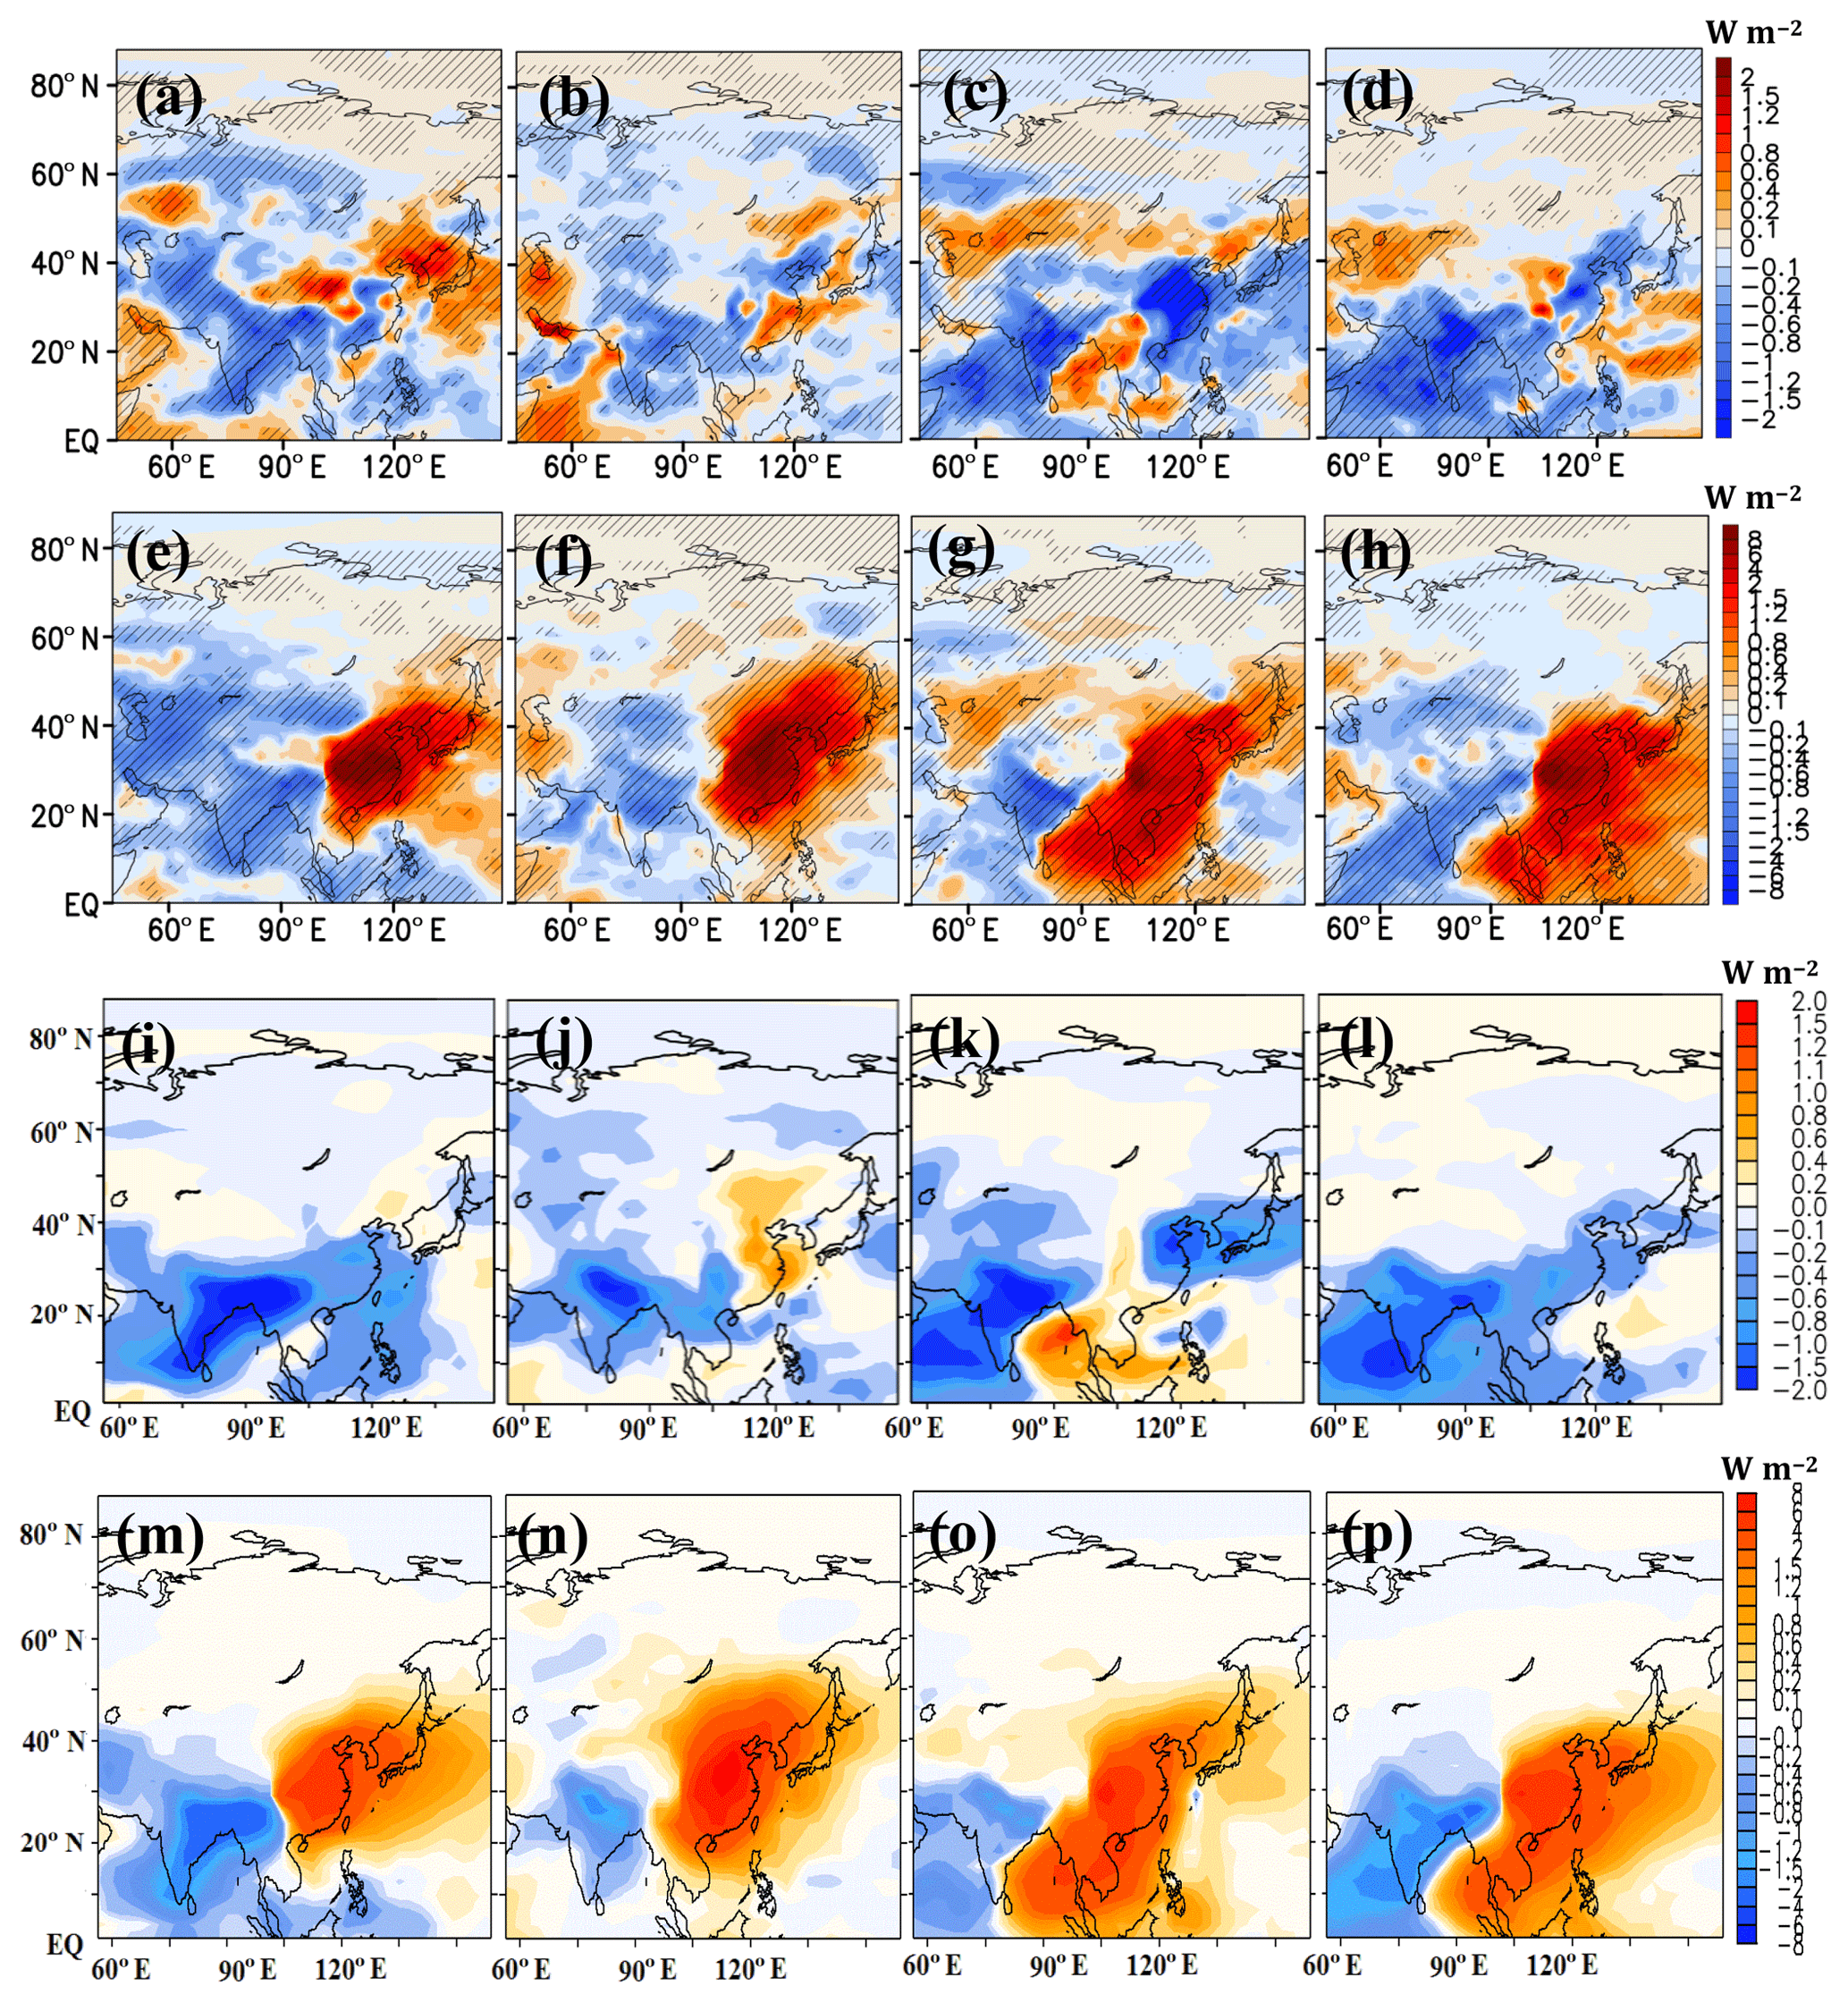
Figure 6Seasonal distribution of anomalies in clear-sky direct net radiative forcing (W m−2) simulated by ECHAM6–HAMMOZ at the top of the atmosphere, from Ind48-CRTL simulations for the (a) pre-monsoon (b) summer-monsoon, (c) post-monsoon and (d) winter seasons; (e)–(h) same as (a)–(d) but from Ind48Chin70-CTRL simulations; (i)–(l) same as (a)–(d) but from the offline model; (m)–(p) same as (e)–(h) but from the offline model. The black hatched lines in (a)–(h) indicate the 99 % significance level.
5.1 Radiative forcing
The seasonal mean anomalies in net radiative forcing at TOA due to sulfate aerosols from the Ind48 and Ind48Chin70 simulations of the ECHAM6–HAMMOZ model are illustrated in Fig. 6a–h. In general, both simulations show negative forcing over India and the surrounding region where sulfate aerosols are dispersed during that season (−0.2 to −2 W m−2). The distribution of anomalies in sulfate aerosols at 850 hPa (Fig. S2a–d) and Fig. 4a–d show that in the Ind48 simulations, during all seasons, sulfate aerosols are transported southwest over the Arabian Sea and partially to the east (during pre-monsoon, monsoon and winter towards Myanmar; during post-monsoon and winter to northeast China). These regions are associated with negative radiative forcing for Ind48 in Figs. 6a–d. This negative radiative forcing extending from north India towards the Arctic during pre-monsoon and summer monsoon is likely due to the poleward transport of south Asian sulfate aerosols in the UTLS (2–10 µg m−3) reflecting back solar radiation (see Fig. 4a, c). The poleward extension of negative radiative forcing (RF) is not evident during the post-monsoon and winter seasons (Fig. 6c, d). This may be due to a fine and thinner sulfate aerosol layer (∼1–4 µg m−3) in the upper troposphere which partially reflects back solar radiation, leading to weak positive and negative RF (−0.1 to +0.5 W m−2) over mid–high latitudes (40–70∘ N).
The simulated RF at TOA in the Ind48Chin70 simulations is negative over India during all seasons ( to −2 W m−2) (Fig. 6e–h) similar to Ind48 (Figs. 6a–d). In addition, the Chinese SO2 emission reductions in Ind48Chin70 have produced a significant positive forcing ∼0.6 to 6 W m−2 over China (100–140∘ E). The positive RF is also seen over the western Pacific (pre-monsoon, summer monsoon and winter) and the Bay of Bengal (post-monsoon and winter). This is due to the negative anomalies in sulfate aerosols over these regions in Ind48Chin70 (Fig. S2e–h). The southwestward transport of Indian sulfate aerosols to the Arabian Sea in the lower troposphere (Fig. S2e–h) during all seasons producing a negative RF in that region is evident in Fig. 6e–h. During the monsoon season, the narrow localized plume leads to a negative regional forcing (30–40∘ N, 80–95∘ E) of W m−2. The negative RF near 40–50∘ N may be due to sulfate aerosols in the lower troposphere (Fig. 5c). The negative RF values (−0.1 to −0.4 W m−2) extending from the Indian region to the Arctic are likely due to the poleward transport in the upper troposphere during the pre-monsoon season and in the lower to mid-troposphere during the winter season (Fig. 6e, h). The seasonal mean net radiative forcing due to sulfate aerosols at the surface and at TOA is similar for both the Ind48 and Ind48Chin70 simulations (Fig. S3a–h), due to the strong scattering properties of the sulfate aerosols (Forster et al., 2007).
The comparison of RF at TOA obtained from ECHAM6–HAMMOZ simulations over the Arabian Sea (0–20∘ N, 60–75∘ E) during winter (Ind48: −2.0 W m−2; Ind48Chin70: 1.5 W m−2) (Fig. 4a) shows reasonable agreement with the INDOEX experiment (−1.25 to −2.0 W m−2 over north India during January–March 1999 (Verma et al., 2012). Yu et al. (2016) reported that the increase in sulfate AOD (0.06–0.15) over the tropics (30∘ S–30∘ N) since the preindustrial period has exerted a forcing of −0.6 to −1.3 W m−2.
The corresponding distribution of sulfate aerosol DRF at TOA estimated with our offline simulations for the four seasons for Ind48 and Ind48Chin70 is shown in Fig. 6i–p. The results from the offline model are in reasonable agreement with the ECHAM6–HAMMOZ simulations, although their magnitude differs spatially. Both the Ind48 and Ind48Chin70 simulations have produced negative RFs, varying between −0.2 and −2.0 W m−2 over India. The reduction in SO2 emission over China leads to an increase in RF of 2–6 W m−2, comparable with the corresponding values simulated in ECHAM6–HAMMOZ. The differences in estimated RF in the offline calculations and the ECHAM6–HAMMOZ simulations are likely due to the fact that the implicit dynamical responses in ECHAM6–HAMMOZ are not captured in the offline simulations. However, the offline calculations are important insofar as they isolate the direct radiative impact of the simulated changes in aerosol loading.
The offline calculations further allow the specific effect of the enhanced aerosol layer in the UTLS (300–50 hPa) to be distinguished (Fig. 7a–h). Figure 7a–d show the direct radiative forcing at TOA (estimated from our offline simulations) induced by the sulfate aerosol enhancement in the UTLS (300–50 hPa) during the four seasons. The RF values from Ind48 are mostly negative over India and China and extending to the Arctic ( to −0.015 W m−2), due to the presence of the sulfate aerosol plume in the UTLS. Interestingly, the Ind48Chin70 simulation also shows negative RFs in the region colocated with the UTLS plume, e.g., in the summer-monsoon season, the plume over north India leads to negative RF values. Similarly, in the post-monsoon season, the sulfate aerosols plume extends to 15∘ S and leads to negative RF values ( to −0.005 W m−2) (see Figs. 7g and S4). In the pre-monsoon season, the aerosol plume travels to the Arctic below or near the tropopause; therefore, partial contribution to RF from the UTLS (300 to 50 hPa) might have produced positive anomalies of 0.0001 to 0.0005 W m−2 in mid–high latitudes. During winter, sulfate aerosols do not reach above the tropopause (Fig. 5g–h) and therefore RF values are positive over India and China. Thus, the radiative forcing caused specifically by UTLS aerosol shows a much clearer signal than the forcing due to the entire aerosol column (compare Figs. 6 and 7a–h). The sulfate aerosol layer, corresponding to the ATAL in the summer-monsoon season, leads to an RF of to −0.015 W m−2 (Fig. 7b) in the Ind48 simulation. It is reduced to −0.001 to −0.003 W m−2 in the Ind48Chin70 simulations (Fig. 7f) due to a reduction in the transport of sulfate aerosols in the UTLS. The short-term ATAL RF at TOA has previously been estimated as about W m−2 over the Asian region during 1998–2015 (Vernier et al., 2015). The radiative forcing reported here caused solely by the sulfate aerosol particles in the UTLS is lower than the value reported by Vernier et al. (2015), who give an integral value for the ATAL and not only for the sulfate particles.
5.2 Incoming solar radiation, temperature and stability of the troposphere
An important impact of sulfate aerosols in the atmosphere is solar dimming, which counteracts the surface temperature response to the anthropogenic CO2 increase (Ramanathan et al., 2005). There is observational evidence (1300 sites globally) indicating that one-third of potential continental warming attributable to increased greenhouse gas concentrations has been compensated for by aerosol cooling during 1964–2010 (Storelvmo et al., 2016). Solar radiation measurements over the Indian region (at 12 stations) during 1981–2004 show a declining trend varying between −0.17 to −1.44 W m−2 yr−1 (Padma Kumari et al., 2007). While not directly comparable to these previous studies, Ramanathan et al. (2005) reported a negative trend in solar flux observations at 10 different Indian stations (−0.42 W m−2), and their model simulations show a trend of −0.37 W m−2 induced by the changes in BC and sulfate aerosols over India (0–30∘ N and 60–100∘ E).
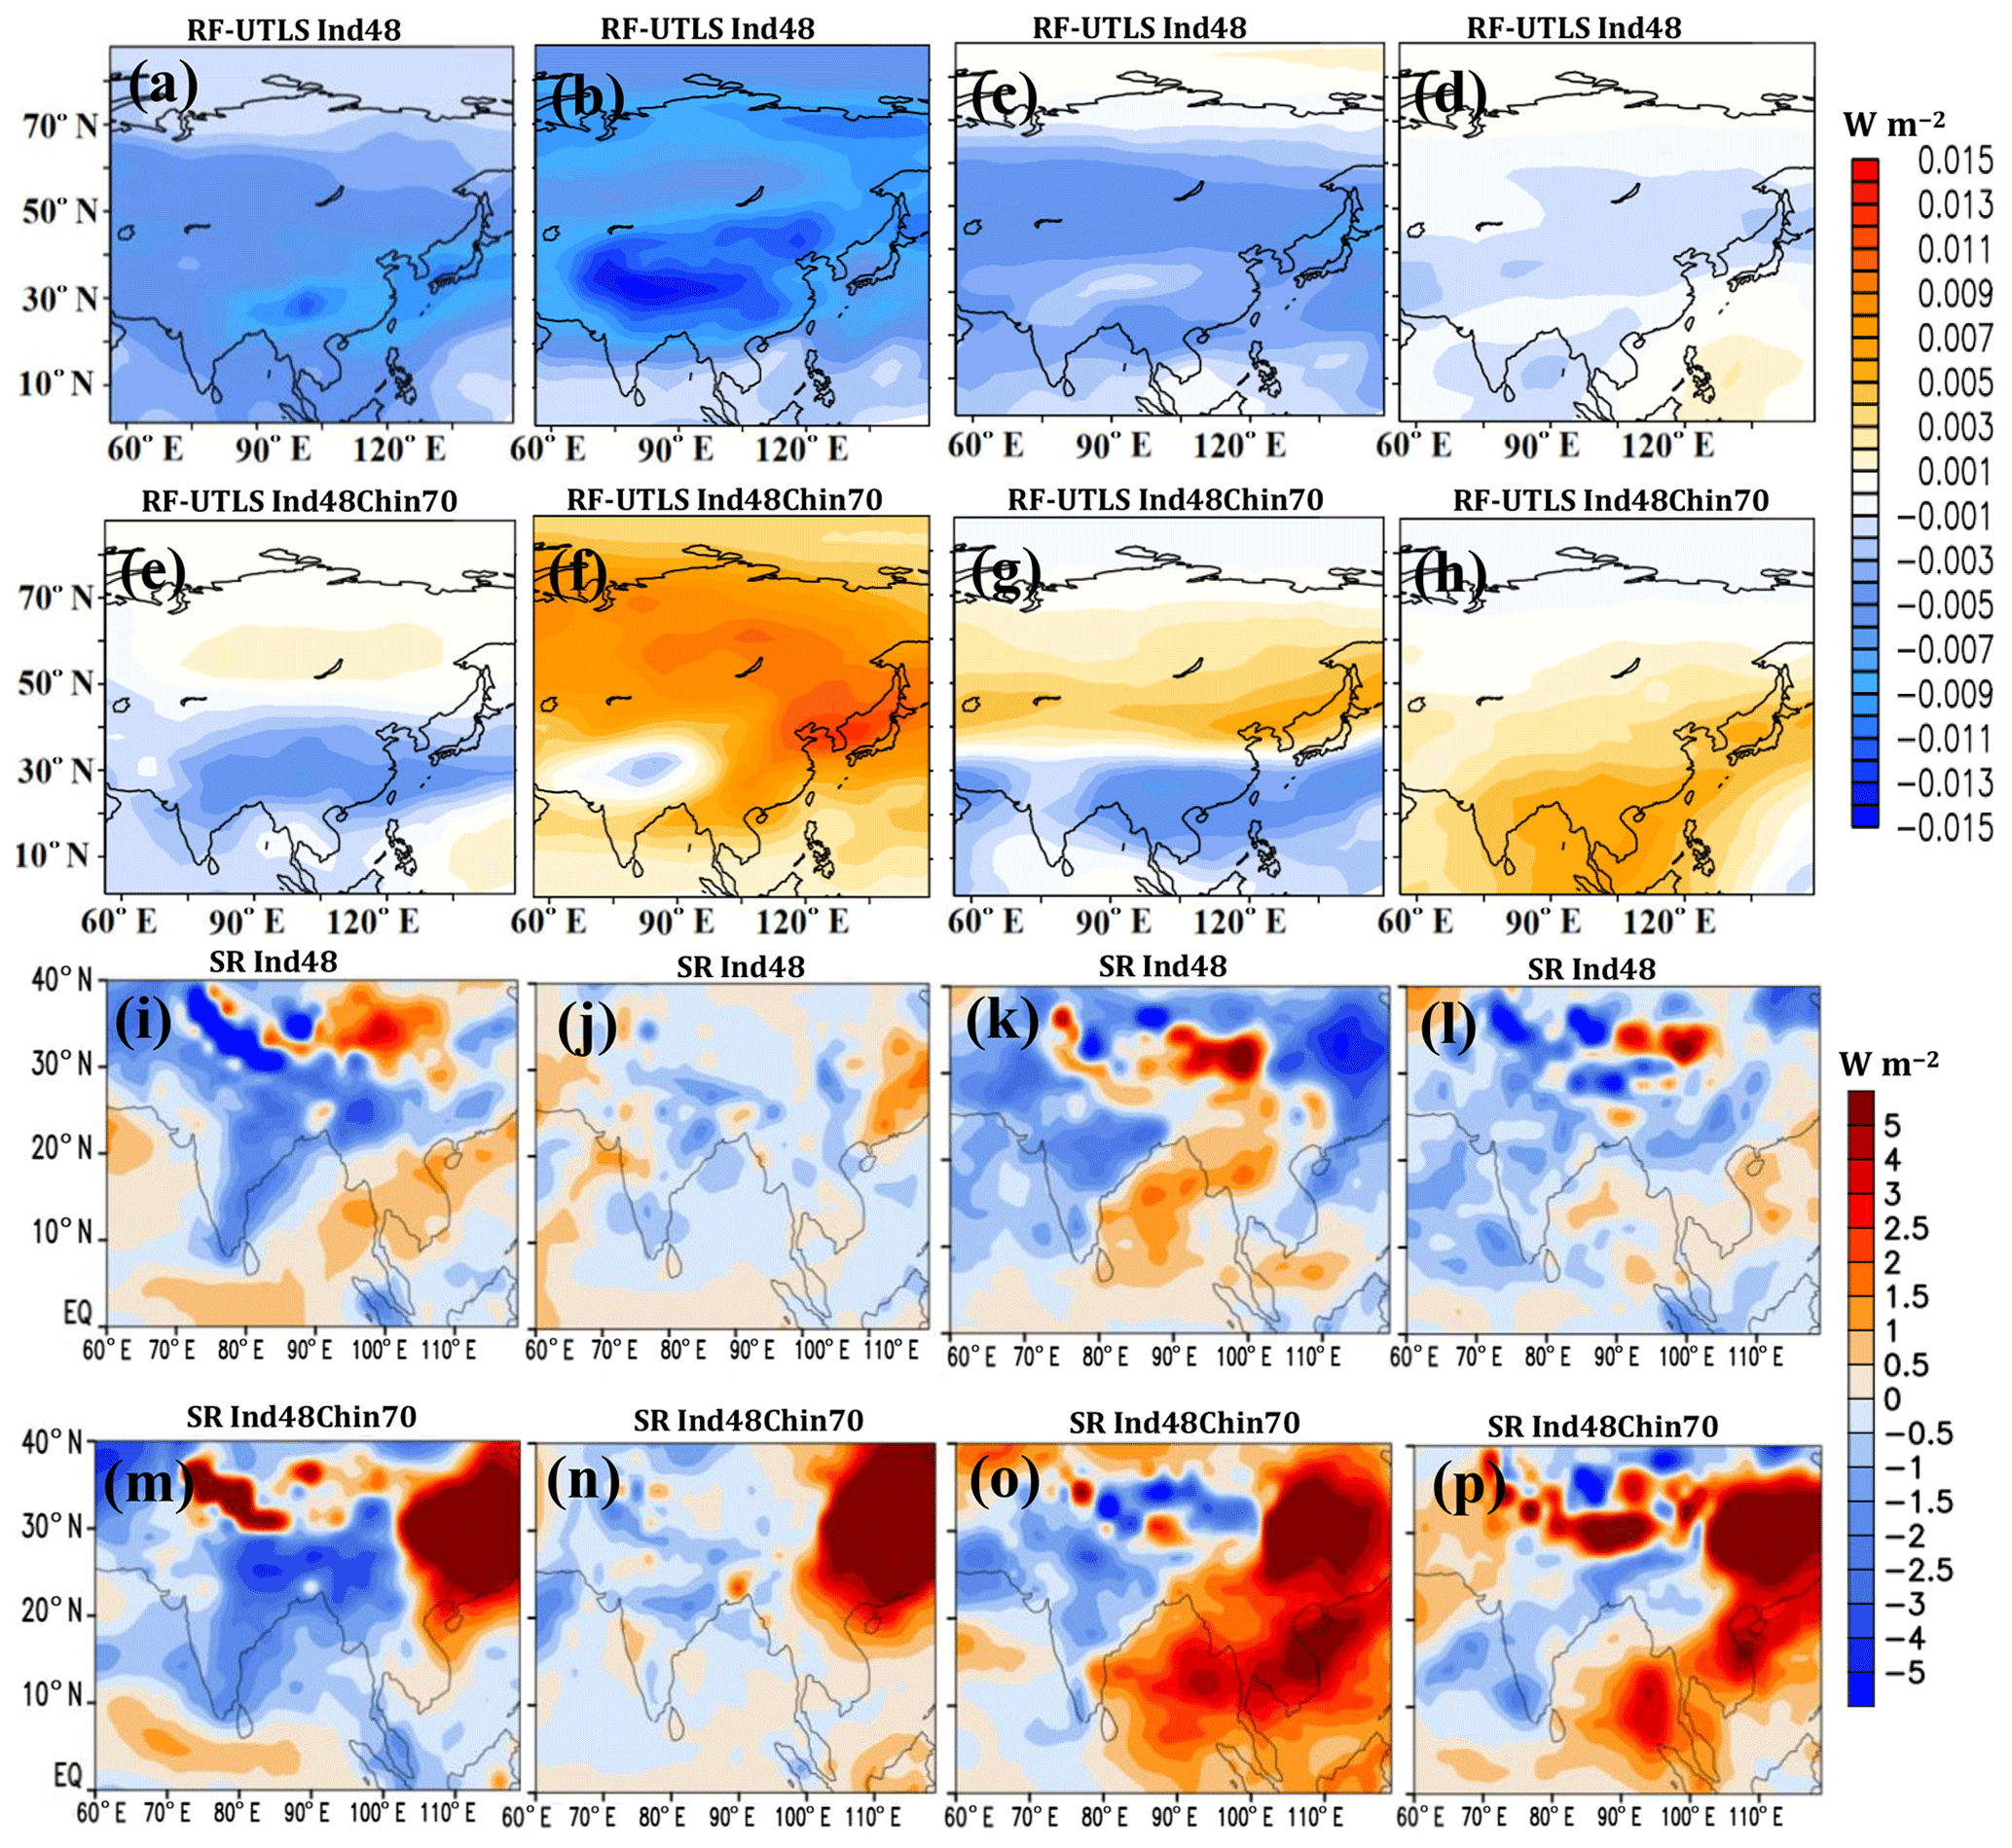
Figure 7Simulated clear-sky direct net radiative forcing at TOA (W m−2) using the offline model due to sulfate aerosols on the UTLS–only for the (a) pre-monsoon (b) summer-monsoon, (c) post-monsoon and (d) winter seasons for Ind48; (e)–(h) same as (a)–(d) but for Ind48Chin70 simulations. The distribution of anomalies in net solar radiation (SR) (W m−2) at the surface from Ind48 for the (i) pre-monsoon (j) summer-monsoon, (k) post-monsoon and (l) winter seasons; (m)–(p) same as (i)–(l) but for Ind48Chin70 simulations.
We estimate the changes in net solar radiation at the surface for four seasons from the Ind48 and Ind48Chin70 simulations. Figure 7i–l show that the Ind48 simulations have produced negative anomalies in net solar radiation (SR) at the surface ( to −3 W m−2) over India and parts of China (where sulfate aerosols are transported) due to the enhanced sulfate aerosol layer reflecting back solar radiation. In general, the seasonal mean distribution of anomalies in net solar radiation at the surface is similar to the distribution of the anomalies in RF at TOA. A reduction in Chinese SO2 emissions along with an increase in SO2 emissions over India (Ind48Chin70) has produced a reduction in solar radiation over India, while there is a significant increase over China (1–5 W m−2) (see Fig. 7m–p).
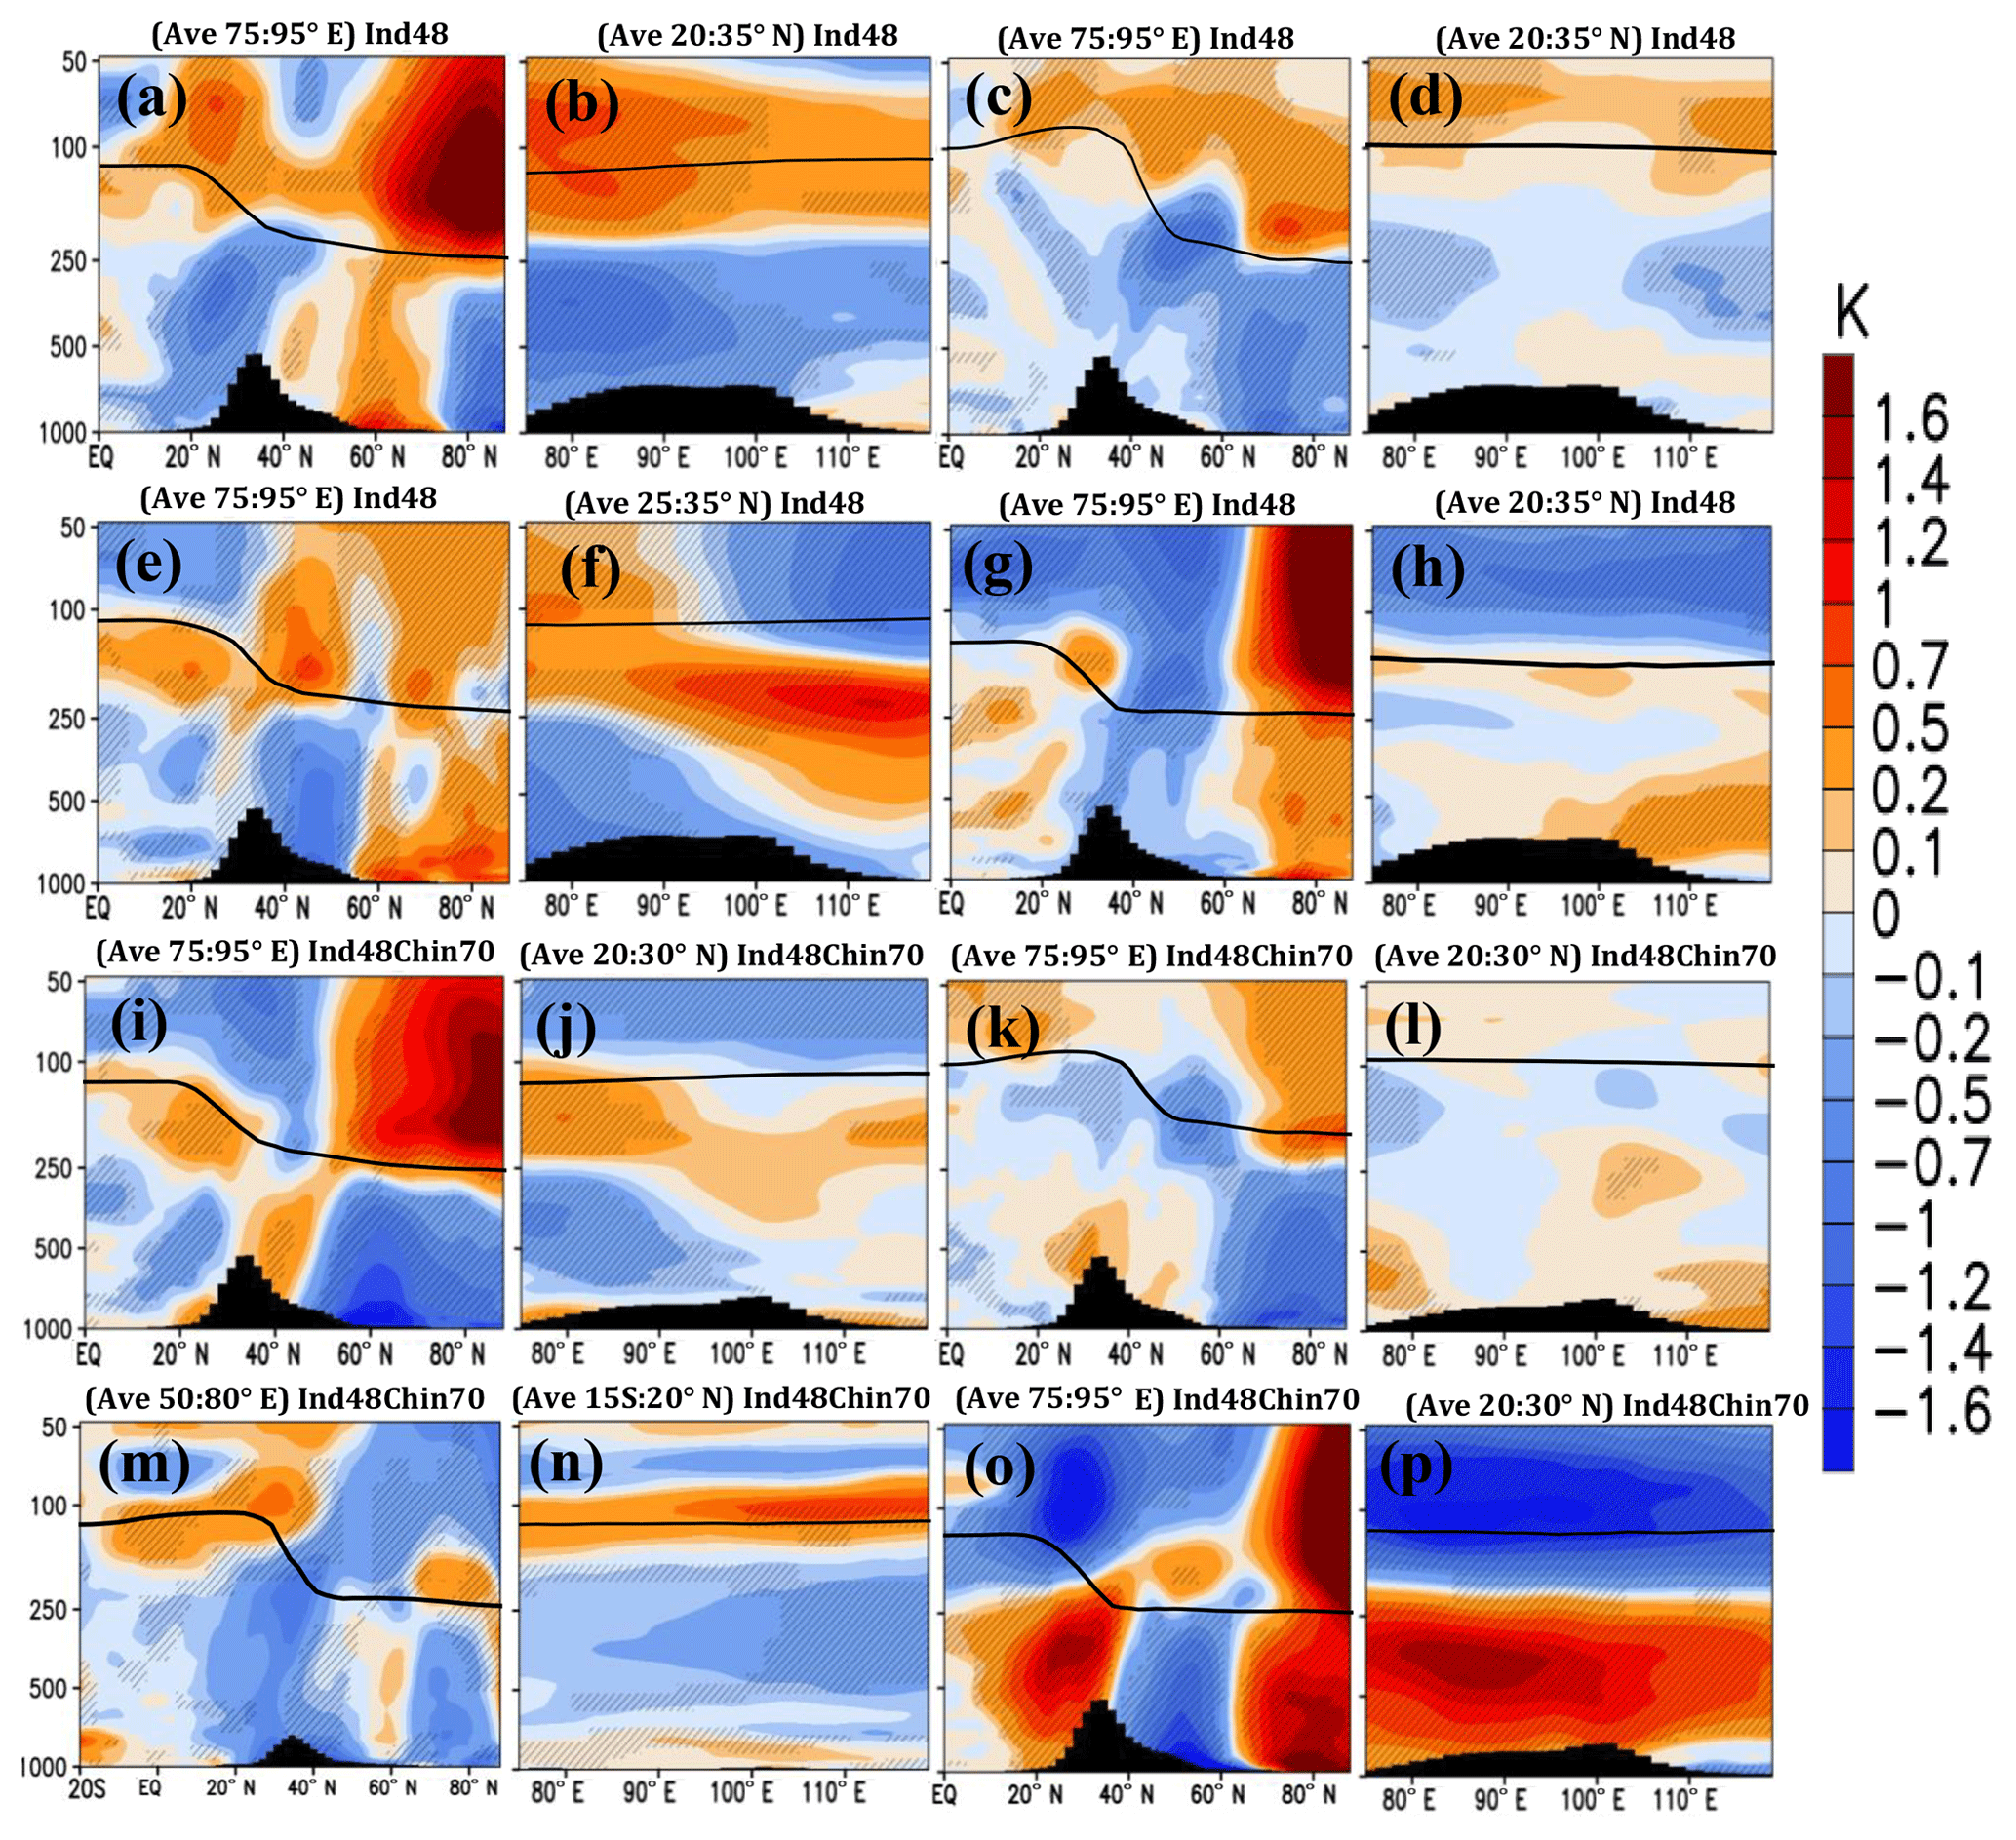
Figure 8Vertical cross section of anomalies in temperature (K) from Ind48-CRTL simulations for the pre-monsoon season (a) latitude–pressure section and (b) longitude–pressure section; (c)–(d) same as (a)–(b) but for the summer-monsoon season; (e)–(f) same as (a)–(b) but for the post-monsoon season; (g)–(h) same as (a)–(b) but for the winter season. Figures (i)–(p) same as (a)–(h) but from Ind48Chin70-CRTL simulations. For the vertical cross section, averages obtained over latitudes or longitudes are indicated in each panel. The black hatched lines indicate the 99 % significance level. The black vertical bars indicate topography, and a black line indicates the tropopause.
Sulfate aerosols also absorb infrared radiation thus causing heating locally and producing a cooling in the region below by solar dimming (Niemeier and Schmidt, 2017). Therefore, seasonally varying transport of sulfate aerosol may affect the thermal structure in the receptor region. Figure 8 shows a temperature enhancement near the region of transport of sulfate aerosols in the UTLS and a cooling of the atmosphere below it. For example, in the Ind48 simulations, positive temperature anomalies are seen near the sulfate aerosol layer extending to the Arctic, with negative anomalies below the layer during all seasons (except winter) (Fig. 8a–h). Similarly, a warming of ∼0.1–0.7 K over India is simulated in the Ind48Chin70 simulations in pre-monsoon and post-monsoon (Fig. 8i–j, m–n). During winter, in the Ind48Chin70 simulation, poleward transport occurs from the Indian lower or mid-troposphere to the lower stratosphere of mid–high latitudes. This region shows positive anomalies in temperature of ∼0.2 to 1 K (see Figs. 8o–p and 5g–h).
As shown in Fig. 8 the amplitude of the temperature anomalies in the UTLS varies seasonally and regionally. In general, there is temperature enhancement in the UTLS over north India and south China (20–35∘ N, 75–130∘ E) of to 0.8±0.72 K in Ind48 (all four season) and to 0.5±0.23 K in Ind48Chin70 (pre-monsoon and post-monsoon). Temperature uncertainties in this paragraph are obtained by determining the variability within the 10-member ensemble. After reaching the Arctic, these sulfate aerosols cause substantial warming in the lower stratosphere, i.e., to 1.6±1.07 K in Ind48 during all seasons and 0.7±0.60 to 1.6±1.43 K in Ind48Chin70 in pre-monsoon and winter seasons. Figure 8 also shows a reduction in temperature of to K in the troposphere, below the warming, corresponding to the UTLS sulfate aerosols layer.
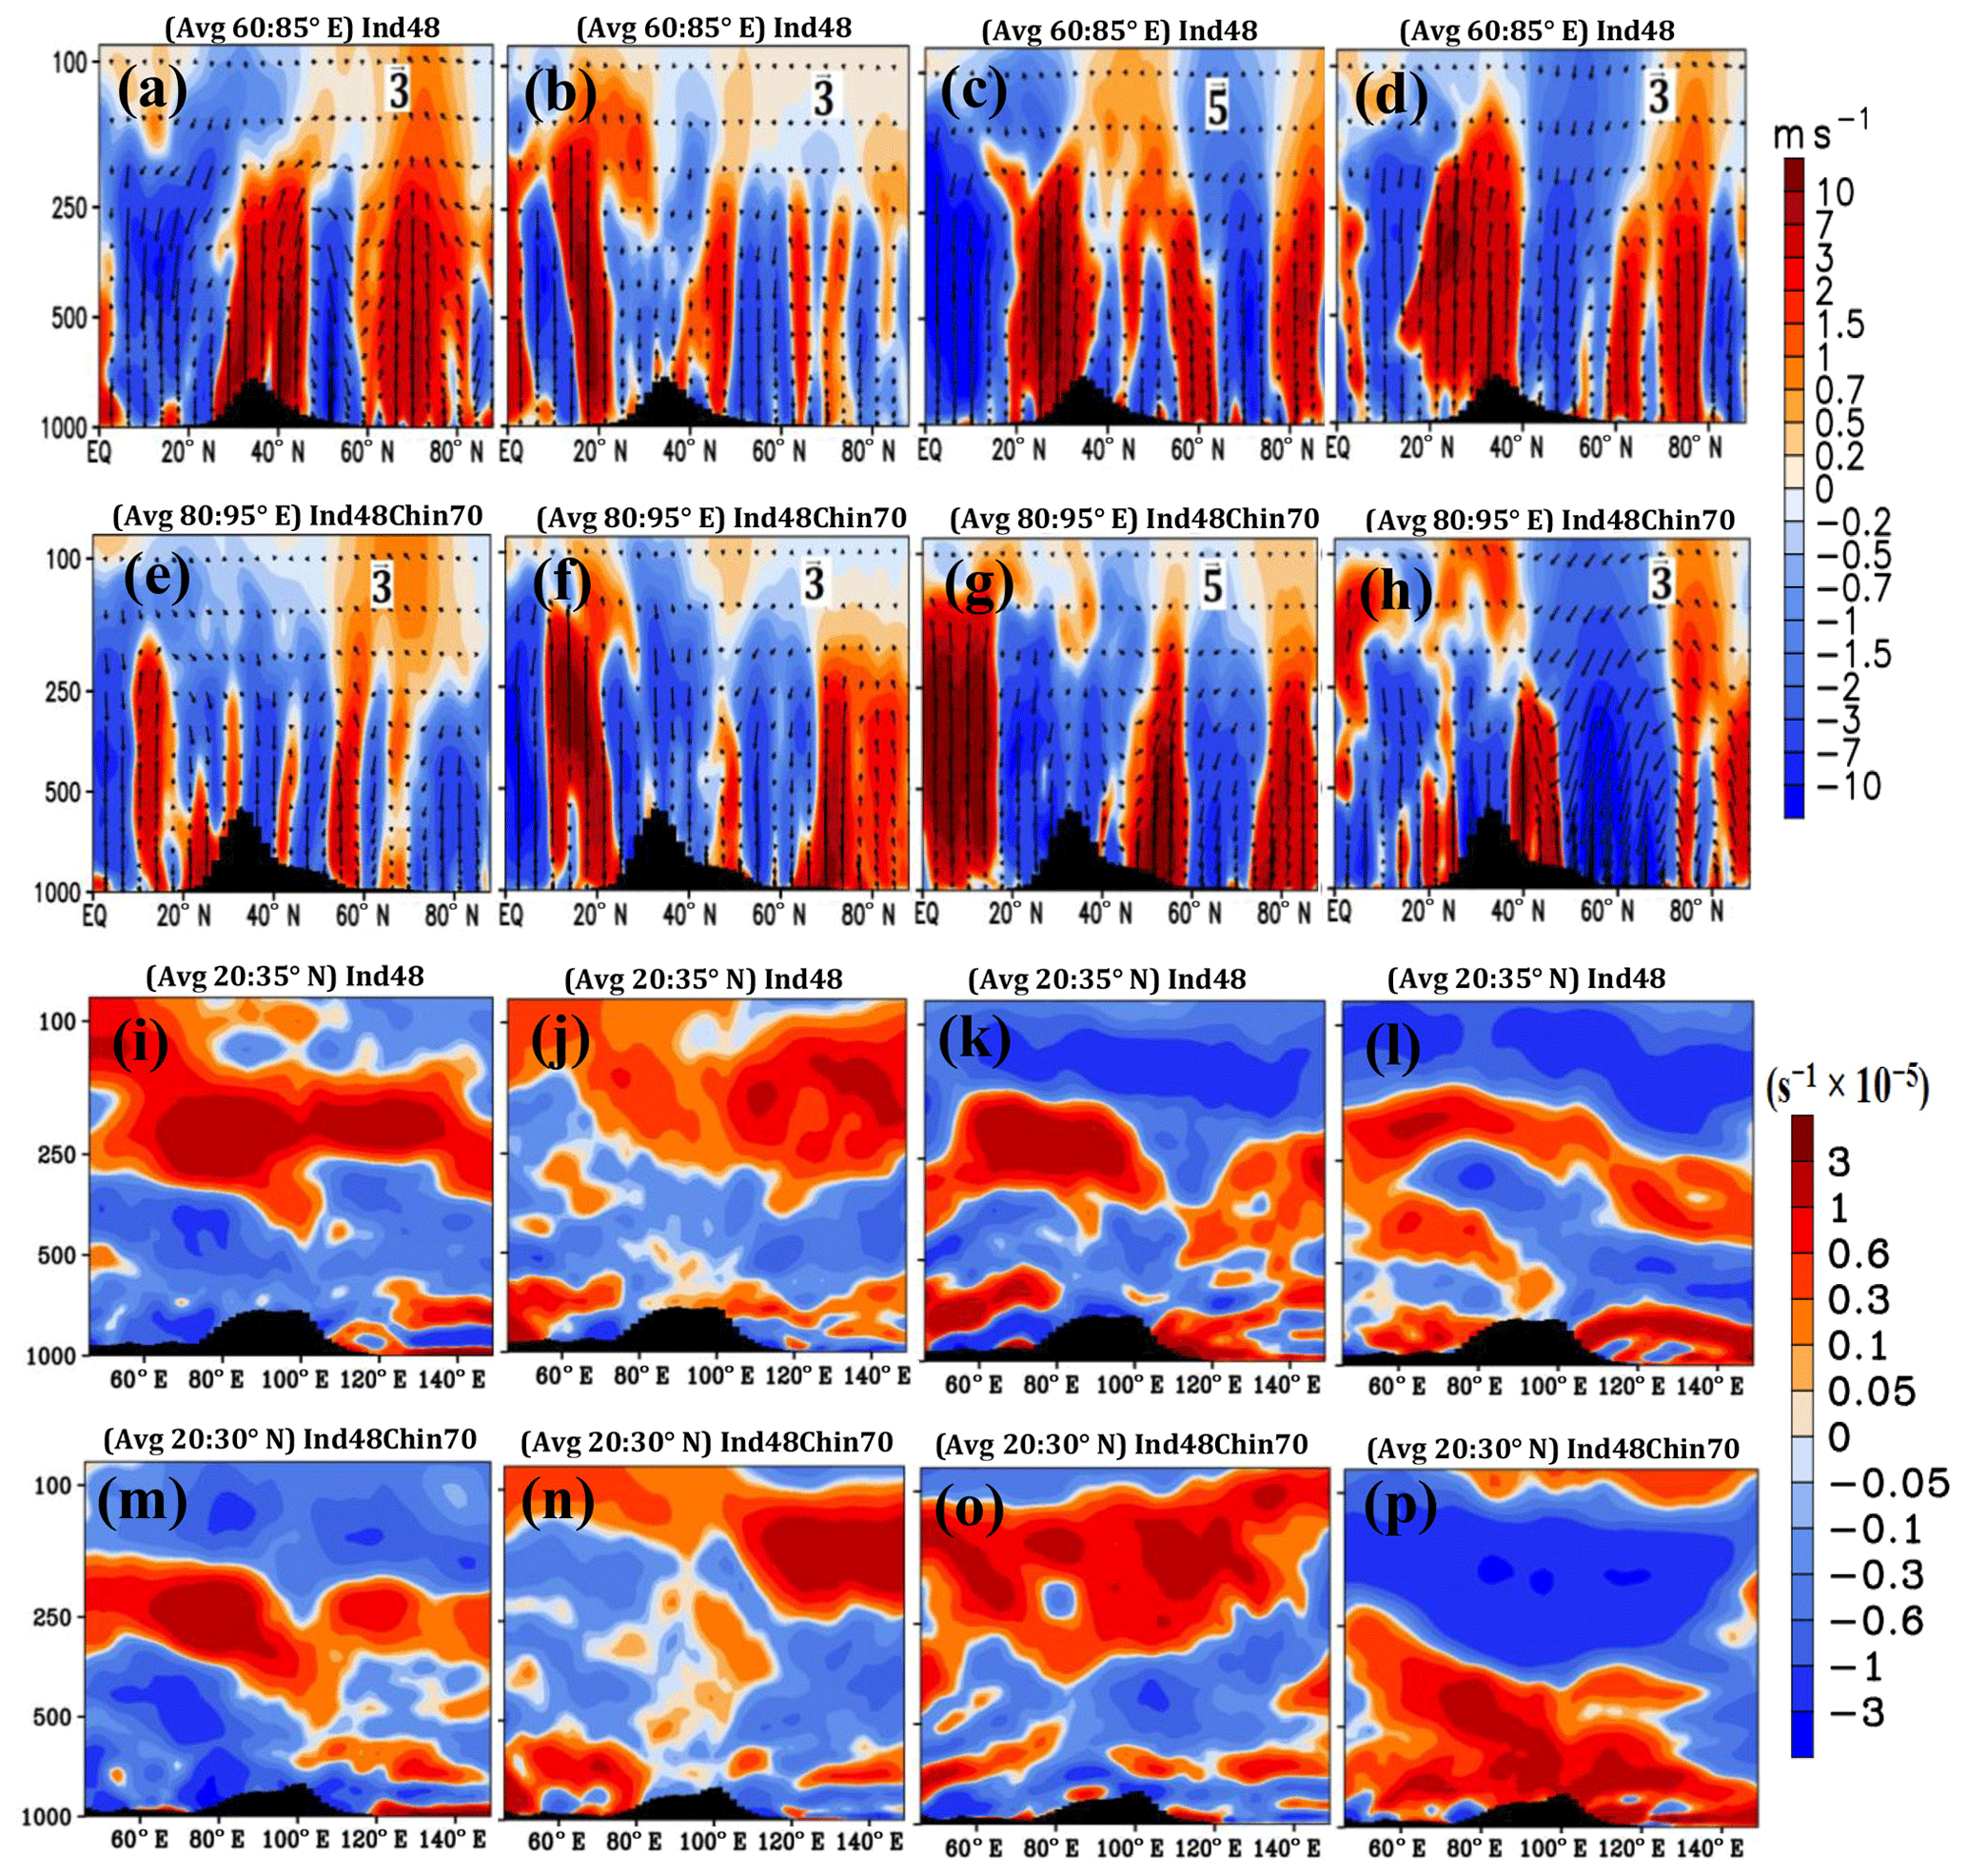
Figure 9The distribution of anomalies in vertical velocity (m s−1) from Ind48-CTRL for the (a) pre-monsoon, (b) summer-monsoon, (c) post-monsoon and (d) winter seasons; (e)–(h) same as (a)–(d) but for Ind48Chin70-CTRL simulations. Vertical velocity is scaled by 1000. Seasonal distribution of anomalies in the Brunt–Väisälä frequency (s−1 × 10⁻⁵) from Ind48-CTRL for the (i) pre-monsoon, (j) summer-monsoon, (k) post-monsoon and (l) winter seasons; (m)–(p) same as (i)–(l) but from Ind48Chin70-CTRL simulations. For the vertical cross section, averages obtained over latitudes or longitudes are indicated in each panel. The black vertical bars indicate topography.
The changes in the circulation are illustrated in Figs. 9a–h. These panels show ascending winds in the region of the sulfate aerosol plume. For example the Ind48 simulations show ascending winds over northern India (while there is subsidence in the upper troposphere over 10–30∘ N) during all seasons and in the Ind48Chin70 simulations during the pre-monsoon season. The reduction in Chinese SO2 emissions (Ind48Chin70) induces strong descending winds over northern India during the summer monsoon and post-monsoon. It hindered the poleward transport of the plume as discussed in Sect. 4.2.
The sulfate aerosol-induced cooling in the upper troposphere (below the layer of sulfate aerosols) and subsidence in the upper troposphere cause a stabilization of the upper troposphere (Pitari et al., 2016). Figure 9i–p show that anomalies in the Brunt–Väisälä frequency are positive (0.2–3 s−1 × 10⁻⁵) in the upper troposphere (250–150 hPa) over north India and south China (20–35∘ N, 70–130∘ E) during all the seasons in Ind48 and for the pre-monsoon and post-monsoon seasons in the Ind48Chin70 simulations. Thus, enhanced Indian sulfate aerosols have increased the stability of the upper troposphere and produce a cooling of ∼0.2–1.2 K (Fig. 8) in the upper troposphere. They induced upper-tropospheric subsidence (10–30∘ N) in Ind48 and ind48Chin70 simulations (except in winter in Ind48Chin70). Upper-tropospheric temperature and stability play important roles in rainfall suppression (Wu and Zhang, 1998; Fadnavis and Chattopadhyay, 2017). Thus, upper-tropospheric cooling and enhanced stability may suppress the rainfall over India in all seasons in Ind48 and in the pre-monsoon and post-monsoon seasons in the Ind48Chin70 simulations. However, a complete analysis of the impact of the enhanced surface aerosols on rainfall is beyond the scope of this study.
5.3 Cirrus clouds
Cirrus clouds cover at least about 30 % of the Earth's area on annual average (Stubenrauch et al., 2013; Gasparini et al., 2018), occurring mainly between 400 and 100 hPa altitude. They play an important role in the Earth's energy budget (Gasparini and Lohmann, 2016; Hartmann et al., 2018), in the transport of water vapor into the stratosphere (Randel and Jensen, 2013), and in the atmospheric heat and energy cycle (Crueger and Stevens, 2015). Cirrus clouds can form either by homogeneous nucleation by freezing of dilute sulfate aerosols or by heterogeneous ice nucleation in the presence of ice nuclei, most commonly dust (Ickes et al., 2015; Cziczo et al., 2017). Moreover, a large fraction of cirrus clouds have a liquid origin as the ice crystals were either nucleated at mixed-phase conditions and transported to lower temperatures or detrained from convective cloud tops (Krämer et al., 2016; Wernli et al., 2016; Gasparini et al., 2018). All mentioned formation processes except for the heterogeneous nucleation of ice crystals below the homogeneous freezing temperature (i.e., at cirrus conditions) are represented in by our model simulations. However, heterogeneous freezing on dust and black carbon aerosols is included in mixed-phase clouds (Lohmann and Hoose, 2009), for temperatures between freezing and −35∘ C. Figure 10a–h show the impact of SO2 emission changes on cirrus clouds. These panels show a decrease (5 %–30 %) in cirrus clouds over north India (20–35∘ N) in the UTLS. The decrease in cirrus clouds coincides with a significant decrease in ice crystal number concentration by −0.15 to −0.5 cm−3 between 250 and 50 hPa (except in winter in Ind48Chin70 since the plume of sulfate aerosols does not reach the upper troposphere) (Figs. 10i–p).
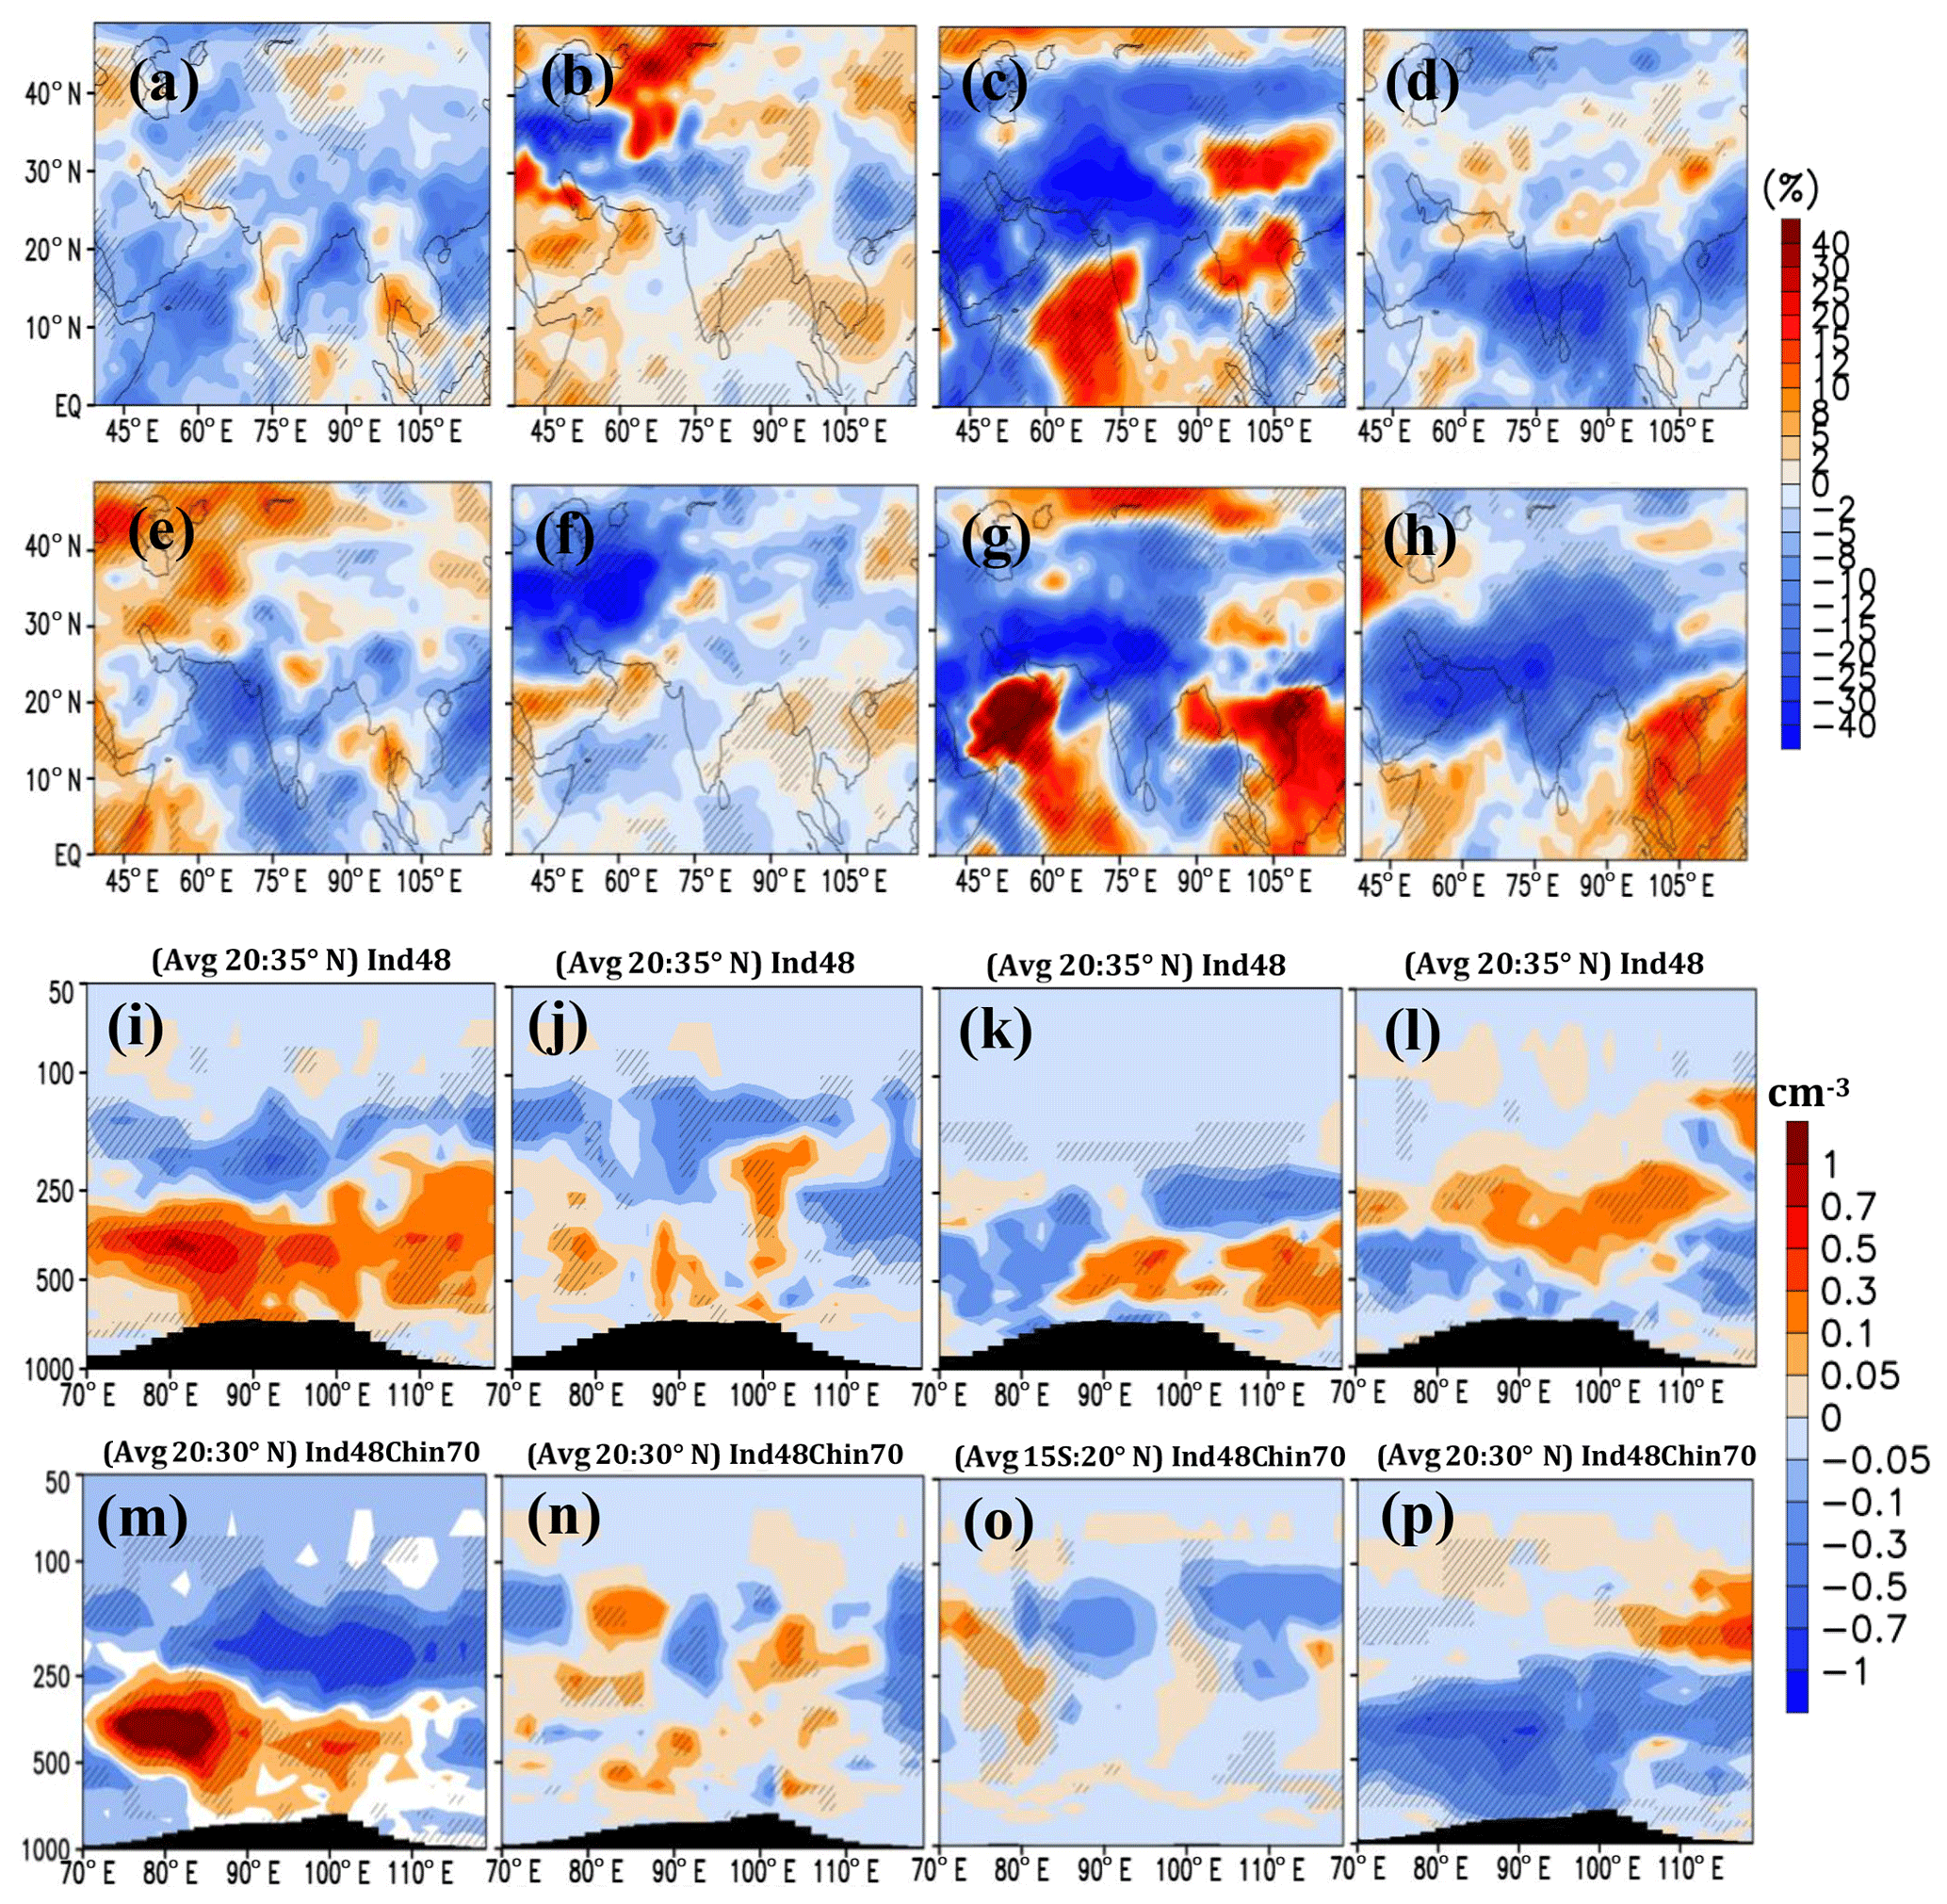
Figure 10Seasonal distribution of anomalies in cirrus cloud (%) from Ind48-CRTL simulations for the (a) pre-monsoon, (b) summer-monsoon, (c) post-monsoon and (d) winter seasons; (e)–h) same as (a)–(d) but for Ind48Chin70-CTRL simulations. Seasonal distribution of anomalies in ice crystal number concentration (ICNC; cm−3) from Ind48-CTRL for the (i) pre-monsoon, (j) summer-monsoon, (k) post-monsoon and (l) winter seasons; (m)–(p) same as (i)–(l) but from Ind48Chin70-CTRL simulations. For the vertical cross section, averages obtained over latitudes or longitudes are indicated in each panel. The black hatched lines indicate the 99 % significance level. The black vertical bars indicate topography.
Our analysis indicates that an increase in the upper-tropospheric sulfate aerosol concentration leads to a temperature increase in the upper troposphere and lower stratosphere of about to 0.8±0.72 K over north India and south China and to a cooling below (Fig. 8). This temperature changes causes a decrease in the upper-tropospheric temperature gradient and vertical velocity and concurrently an increase in the upper-tropospheric (200–100 hPa) static stability (Brunt–Väisälä frequency) (over 80–120∘ E) (Fig. 9i–p) (Figs. 9a–h). A combination of decreased upper-tropospheric updraft motion and increased temperature decreases the likelihood of cirrus cloud formation in a similar way to the simulated responses to volcanic eruptions or stratospheric sulfur geoengineering (Kuebbeler et al., 2012; Pitari et al., 2016; Visioni et al., 2018a).
5.4 Discussion
Our model simulations presented here provide seasonal transport processes and estimates of radiative forcing for the year 2011. The interannual variability in the transport processes may impact the shallow or deep injection of sulfate aerosols into the lower stratosphere. The stratospheric warming produced in response to the transport of rising south Asian anthropogenic sulfate aerosol in the UTLS over Asia and further to the Arctic (Figs. 4 and 5) may modulate the QBO and thereby the transport of sulfate aerosol from the tropics to the extra-tropics. The QBO phases are modulated by the amount of sulfate and the height of the injection (Aquila et al., 2014; Niemeier and Schmidt, 2017; Visioni et al., 2018b). A previous study reports that the QBO slows down after an injection of 4 Tg (S) yr−1 into the stratosphere and completely shuts down after the injection of 8 Tg (S) yr−1 (Niemeier and Schmidt, 2017). However, another model study finds that the QBO, even for a larger amount of SO2 injections, does not deviate much from present-day conditions (Richter et al., 2018). These studies indicate that there is a complicated interaction between UTLS aerosols, atmospheric dynamics and atmospheric chemistry (Richter et al., 2017; Niemeier and Schmidt, 2017; Visioni et al., 2018b). The QBO is known to modulate the tropical convection (Collimore et al., 2003; Fadnavis et al., 2013; Nie and Sobel, 2015). Thus, the transport of sulfate aerosols into the stratosphere would impact the tropospheric hydrological cycle in addition to the tropospheric aerosol loading. The increasing amounts of tropospheric sulfate aerosol loading are linked with droughts via changes in radiative forcing, stability and tropospheric temperature gradient (Yeh et al., 2015; Kim et al., 2016). Simulations for a longer time period and with the inclusion of QBO phases may reveal the influence of current SO2 emission on tropospheric–stratospheric dynamics and the hydrological cycle. Nonetheless, the results of the current study show the impacts of sulfate aerosols on the UTLS for realistic emission perturbations over India and China.
This study investigated the long-range transport of Asian sulfate aerosols and their associated impacts on radiative forcing, temperature, circulation and cirrus clouds using ECHAM6–HAMMOZ model simulations. We considered emissions perturbations of anthropogenic SO2 derived from OMI observations, namely (1) enhancement over India by 48 % (Ind48) and (2) enhancement over India by 48 % and a simultaneous reduction over China by 70 % (Ind48Chin70). The Ind48 simulations show long-range transport of sulfate aerosols from the Indian boundary layer (20–35∘ N, 75–95∘ E) to the UTLS and further horizontally to the Arctic throughout the year. The reduction in Chinese SO2 emissions inhibits the transport of sulfate aerosols from India to the Arctic in the summer-monsoon and post-monsoon seasons via subsidence over north India, which is induced in response to emission perturbation. The enhancement of Indian emission increases the aerosol burden (AOD) in the UTLS over north India by (1.1 %) to (19.25 %) and the Arctic by (3.3 %) to (16.45 %). This leads to a warming ( to 0.8±0.72 K) in the UTLS near the sulfate aerosol layer and to a cooling below it in the troposphere (0.1±0.05 to K). It produces a negative net radiative forcing at TOA −0.2 to −2 W m−2 over north India. There is a substantial increase of ∼0.6 to 6 W m−2 in net radiative forcing at TOA over China in response to the reduction in Chinese SO2 emissions.
The RF at TOA estimated from the offline radiative transfer model for enhancement of Indian SO2 emissions is −0.2 to −2.0 W m−2 over India. The reduction in SO2 emissions over China leads to an RF of 2 to 6 W m−2. These values are comparable with results of the ECHAM6–HAMMOZ simulations, with the minor differences likely due to the implicit dynamical impacts in response to enhanced south Asian SO2 emissions in ECHAM6–HAMMOZ not being represented in the offline model. The enhancement of sulfate aerosols in the UTLS (300–50 hPa) produces a negative forcing in the region colocated with the aerosol sulfate layer in the UTLS, extending from India to the Arctic in the Ind48 (−0.003 to −0.015 W m−2) and the Ind48Chin70 (−0.001 to −0.005 W m−2) simulations. The ATAL (due to sulfate aerosols only) in the Ind48 simulation produced an RF over north India of –0.015 W m−2 (Fig. 7b), which reduced to −0.001 to −0.003 W m−2 in the Ind48Chin70 simulation (Fig. 7f). This reduction is attributed to the subsidence over north India produced by the Chinese SO2 emission reduction.
An enhancement of 48 % in south Asian anthropogenic sulfate aerosols leads to a decrease in cirrus clouds and a cooling of the mid–upper troposphere over the northern regions of India and south China throughout the year. This enhances the stability (anomalies in the Brunt–Väisälä frequency 0.2 to 2 s) of the upper troposphere (∼250 hPa) of these regions. A reduction in Chinese SO2 emissions does not stabilize the upper troposphere during the monsoon and winter seasons since subsidence over north India inhibited the vertical transport of sulfate aerosols to the UTLS. Upper-tropospheric temperature and stability play an important role in rainfall reduction. Strong subsidence, mid–upper-tropospheric cooling and enhanced stability over India may cause a rainfall deficit (Wu and Zhang, 1998; Fadnavis et al., 2017c). The link between these features and the Indian rainfall deficit should be addressed in future research. It is important to note that an increase in surface emissions of SO2 does not necessarily lead to a reduction in RF (as might be expected) but that regional enhancements of RF might occur in response to an inherent dynamical response (including changes in high cloud cover) to enhanced SO2 emissions.
OMI SO2 data can be obtained from https://disc.gsfc.nasa.gov/datasets/OMSO2e_V003/summary?keywords=aura (GES Disk, 2019); MISR data are available at https://giovanni.gsfc.nasa.gov/giovanni/ (Giovanni, 2019); CALIPSO and CloudSat measurements can be obtained from http://www.cloudsat.cira.colostate.edu/data-products/ (NASA, 2019). These satellite datasets are freely available.
The supplement related to this article is available online at: https://doi.org/10.5194/acp-19-9989-2019-supplement.
SF designed the study and wrote the paper; GK analyzed the model simulations; MR and AR performed offline radiative forcing computations. JLFL provided CALIPSO data. BG and AL helped with aerosol and cirrus cloud analysis. RM contributed to the analysis of the model results and the writing of the paper.
The authors declare that they have no conflict of interest.
Suvarna Fadnavis acknowledges Ravi Nanjundiah, Director of IITM, with gratitude for his encouragement during this study. The authors thank the anonymous reviewers for valuable suggestions and the high-performance computing team at IITM for supporting the model simulations.
This paper was edited by Farahnaz Khosrawi and reviewed by two anonymous referees.
Aas, W., Mortier, A., Bowersox, V., Ribu, C., Faluvegi, G., Fagerli, H., Hand, J., Klimont, Z., Galy-Lacaux, C., Lehmann, C. M. B., Myhre, C. L., Myhre, G., Olivié, D., Sato, K., Quaas, J., Rao, P. S. P., Schulz, M., Shindell, D., Skeie, R. B., Stein, A., Takemura, T., Tsyro, S., Robert, Vet R., and Xiaobin Xu, X.: Global and regional trends of atmospheric sulfur, Sci. Rep., 9, 1–11, https://doi.org/10.1038/s41598-018-37304-0, 2019.
Aquila, V., Garfinkel, C. I., Newman, P. A., Oman, L. D., and Waugh, D. W.: Modifications of the quasi-biennial oscillation by a geoengineering perturbation of the stratospheric aerosol layer, Geophys. Res. Lett., 41, 1738–1744, https://doi.org/10.1002/2013GL058818, 2014.
Babu, S. S., Manoj, M. R., Moorthy, K. K., Gogoi, M. M., Nair, V. S., Kompalli, S. K., Satheesh, S. K., Niranjan, K., Ramagopal, K., Bhuyan, P. K., and Singh, D.: Trends in aerosol optical depth over Indian region: Potential causes and impact indicators, J. Geophys. Res., 118, 11794–11806, https://doi.org/10.1002/2013JD020507, 2013.
Bellouin, N., Rae, J., Jones, A., Johnson, C., Haywood, J., and Boucher, O.: Aerosol forcing in the Climate Model Intercomparison Project (CMIP5) simulations by HadGEM2-ES and the role of ammonium nitrate, J. Geophys. Res., 116, D20206, https://doi.org/10.1029/2011JD016074, 2011.
Bourgeois, Q. and Bey, I.: Pollution transport efficiency toward the Arctic: Sensitivity to aerosol scavenging and source regions, J. Geophys. Res., 116, D08213, https://doi.org/10.1029/2010JD015096, 2011.
Collimore, C. C., Martin, D. W., Hitchman, M. H., Huesmann, A., and Waliser, D. E.: On the relationship between the QBO and tropical deep convection, J. Clim., 16, 2552–2568, 2003.
Crueger, T. and Stevens, B.: The effect of atmospheric radiative heating by clouds on the Madden-Julian Oscillation, J. Adv. Model. Earth Sy., 7, 854–864, https://doi.org/10.1002/2015MS000434, 2015.
Cziczo, D. J., Ladino, L., Boose, Y., Kanji, Z. A., Kupiszewski, P., Lance, S., Mertes, S., and Wex, H.: Measurements of ice nucleating particles and ice residuals, Meteor. Mon., 58, 8.1–8.13, 2017.
Deng, M., Mace, G. G., Wang, Z., and Lawsan, R. P.: Evaluation of Several A-Train Ice cloud retrieval products with in situ measurements collected during the SPARTICUS campaign, J. Appl. Meteorol. Clim., 52, 1014–1030, 2013.
Dumka, U. C., Tripathi, S. N., Misra, A., Giles, D. M., Eck, T. F., Sagar, R., and Holben, B. N.: Latitudinal variation of aerosol properties from Indo-Gangetic Plain to central Himalayan foothills during TIGERZ campaign, J. Geophys. Res., 119, 4750–4769, https://doi.org/10.1002/2013JD021040, 2014.
Edwards, J. M. and Slingo, A.: Studies with a Flexible New Radiation Code, I: Choosing a Configuration for a Large-Scale Model, Q. J. Roy. Metorol. Soc., 122, 689–719, https://doi.org/10.1002/qj.49712253107, 1996.
Fadnavis, S. and Beig, G.: Seasonal variation of trend in temperature and ozone over the tropical stratosphere in the Northern Hemisphere, J. Atmos. Sol.-Terr. Phys., 68, 1952–1961, https://doi.org/10.1016/j.jastp.2006.09.003, 2006.
Fadnavis, S. and Chattopadhyay, R.: Linkages of subtropical stratospheric intraseasonal intrusions with Indian summer monsoon deficit rainfall, J. Clim., 30, 5083–5095, https://doi.org/10.1175/JCLI-D-16-0463.1, 2017.
Fadnavis, S., Semeniuk, K., Pozzoli, L., Schultz, M. G., Ghude, S. D., Das, S., and Kakatkar, R.: Transport of aerosols into the UTLS and their impact on the Asian monsoon region as seen in a global model simulation, Atmos. Chem. Phys., 13, 8771–8786, https://doi.org/10.5194/acp-13-8771-2013, 2013.
Fadnavis, S., Kalita, G., Kumar, K. R., Gasparini, B., and Li, J. L.: Potential impact of carbonaceous aerosol on the upper troposphere and lower stratosphere (UTLS) and precipitation during Asian summer monsoon in a global model simulation, Atmos. Chem. Phys., 17, 11637–11654, https://doi.org/10.5194/acp-17-11637-2017, 2017a.
Fadnavis, S., Roy, C., Sabin, T. P., Ayantika, D. C., and Ashok, K.: Potential modulations of pre-monsoon aerosols during El Niño: impact on Indian summer monsoon, Clim. Dynam., 49, 2279–2290, https://doi.org/10.1007/s00382-016-3451-6, 2017b.
Fadnavis, S., Roy, C., Chattopadhyay, R., Sioris, C. E., Rap, A., Müller, R., Kumar, R. K., and Krishnan, R.: Transport of trace gases via eddy shedding from the Asian summer monsoon anticyclone and associated impacts on ozone heating rates, Atmos. Chem. Phys., 18, 11493–11506, https://doi.org/10.5194/acp-18-11493-2018, 2018.
Fisher, J. A., Jacob, D. J., Wang, Q., Bahreini, R., Carouge, C. C., Cubison, M. J., Dibb, J.E., Diehl, T., Jimenez, J. L., Leibensperger, E. M., Lu, Z., Meinders, M. B. J., Pye, H. O. T., Quinn, P. K., Sharma, S., Streets, D. G., Donkelaar, A. van, and Yantosca, R. M.: Sources, distribution, and acidity of sulfate-ammonium aerosol in the Arctic in winter-spring, Atmos. Environ., 45, 7301–7318, https://doi.org/10.1016/j.atmosenv.2011.08.030, 2011.
Forster, P., Ramaswamy, V., Artaxo, P., Berntsen, T., Betts, R., Fahey, D. W., Haywood, J., Lean, J., Lowe, D. C., Myhre, G., Nganga, J., Prinn, R., Raga, G., Schulz M., and Van Dorland, R.: Changes in Atmospheric Constituents and in Radiative Forcing, in: Climate Change 2007: The Physical Science Basis. Contribution of Working Group I to the Fourth Assessment Report of the Intergovernmental Panel on Climate Change, edited by: Solomon, S., Qin, D., Manning, M., Chen, Z.,, Marquis, Averyt, K. B., Tignor, M., and Miller, H. L., Cambridge University Press, Cambridge, United Kingdom and New York, NY, USA, 129–234, 2007.
Gasparini, B. and Lohmann, U.: Why cirrus cloud seeding cannot substantially cool the planet, J. Geophys. Res., 121, 4877–4893, https://doi.org/10.1002/2015JD024666, 2016.
Gasparini, B., Meyer, A., Neubauer, D., Münch, S., and Lohmann, U.: Cirrus Cloud Properties as Seen by the CALIPSO Satellite and ECHAM–HAM Global Climate Model, J. Clim., 31, 1983–2003, https://doi.org/10.1175/JCLI-D-16-0608.1, 2018.
Giovanni: Aerosol Optical Depth at 550 nm, available at: https://giovanni.gsfc.nasa.gov/giovanni/ last access: 5 August 2019.
Gu, Y., Liao, H., and Bian, J.: Summertime nitrate aerosol in the upper troposphere and lower stratosphere over the Tibetan Plateau and the South Asian summer monsoon region, Atmos. Chem. Phys., 16, 6641–6663, https://doi.org/10.5194/acp-16-6641-2016, 2016.
Hartmann, D. L., Gasparini, B., Berry, S. E., and Blossey, P. N.: The Life Cycle and Net Radiative Effect of Tropical Anvil Clouds, J. Adv. Model. Earth Sy., 10, 3012–3029, https://doi.org/10.1029/2018MS001484, 2018.
Holben, B. N., Eck, T. F., Slutsker, I., Tanré, D., Buis, J. P., Setzer, A., Vermote, E., Reagan, J. A., Kaufman, Y. J., Nakajima, T., Lavenu, F., Jankowiak, I., and Smirnov, A.: AERONET: Federated Instrument Network and Data Archive for Aerosol Characterization, Remote Sens. Environ., 66, 1–16, https://doi.org/10.1016/S0034-4257(98)00031-5, 1998.
Höpfner, M., Ungermann, J., Borrmann, S., Wagner, R., Spang, R., Riese, M., Stiller, G., Appel, O., Batenburg, A. M., Bucci, S., Cairo, F., Dragoneas, A., Friedl-Vallon, F., Hünig, A., Johansson, S., Krasauskas, L., Legras, B., Leisner, T., Mahnke, C., Möhler, O., Molleker, S., Müller, R., Neubert, T., Orphal, J., Preusse, P., Rex, M., Saathoff, H., Stroh, F., Weigel, R., and Wohltmann, I.: Ammonium nitrate particles formed in upper troposphere from ground ammonia sources during Asian monsoons, Nat. Geosci., 12, 608–612, https://doi.org/10.1038/s41561-019-0385-8, 2019.
Ickes, L., Welti, A., Hoose, C., and Lohmann, U.: Classical nucleation theory of homogeneous freezing of water: thermodynamic and kinetic parameters, Phys. Chem. Chem. Phys., 17, 5514–5537, https://doi.org/10.1039/C4CP04184D, 2015.
Kahn, R., Banerjee, P. D., and McDonald, D.: The sensitivity of multiangle imaging to natural mixtures of aerosols over ocean, J. Geophys. Res., 106, 18219–18238, https://doi.org/10.1029/2000JD900497, 2001.
Kim, M. J., Yeh, S. W., and Park, R. J.: Effects of sulfate aerosol forcing on East Asian summer monsoon for 1985–2010, Geophys. Res. Lett., 43, 1364–1372, https://doi.org/10.1002/2015GL067124, 2016.
Kinnison, D. E., Brasseur, G. P., Walters, S., Garcia, R. R., Marsh, D. R., Sassi, F., Harvey, V. L., Randall, C. E., Emmons, L., Lamarque, J. F., Hess, P., Orlando, J. J., Tie, X. X., Randel, W., and Pan, L. L.: Sensitivity of chemical tracers to meteorological parameters in the MOZART-3 chemical transport model, J. Geophys. Res., 112, D20302, https://doi.org/10.1029/2006JD007879, 2007.
Kokkola, H., Kuhn, T., Laakso, A., Bergman, T., Lehtinen, KEJ., Mielonen, T., Arola, A., Stadtler, S., Korhonen, H., Ferrachat, S., Lohmann, U., Neubauer, D., Tegen, I., Siegenthaler-Le Drian, C., Schultz, M. G., Bey, I., Stier, P., Daskalaski, N., and Heald, C. L.: SALSA2.0: The sectional aerosol module of the aerosol–chemistry–climate model ECHAM6.3.0-HAM2.3-MOZ1.0, Geosci. Model Dev., 11, 3833–3863, https://doi.org/10.5194/gmd-11-3833-2018, 2018.
Krämer, M., Rolf, C., Luebke, A., Afchine, A., Spelten, N., Costa, A., Meyer, J., Zöger, M., Smith, J., Herman, R. L., Buchholz, B., Ebert, V., Baumgardner, D., Borrmann, S., Klingebiel, M., and Avallone, L.: A microphysics guide to cirrus clouds – Part 1: Cirrus types, Atmos. Chem. Phys., 16, 3463–3483, https://doi.org/10.5194/acp-16-3463-2016, 2016.
Kremser, S., , Larry, W. T., Hobe, M. V., Hermann, M., Deshler, T., Timmreck, C., Toohey, M., Stenke, A., Schwarz, J. P., Weigel, R., Fueglistaler, S., Prata, F. J., Vernier, J.‐P., Schlager, H., Barnes, J. E., Antuña-Marrero, J.-C., Fairlie, D., Palm, M., Mahieu, E., Notholt, J., Rex, M., Bingen, C., Vanhellemont, F., Bourassa, A., Plane, J. M. C., Klocke, D., Carn, S. A., Clarisse, L., Trickl, T., Neely, R., James, A. D., Rieger, L., Wilson, J. C., and Meland, B.: Stratospheric aerosol-Observations, processes and impact on climate, Rev. Geophys., 54, 278–335, https://doi.org/10.1002/2015RG000511, 2016.
Krotkov, N. A., McLinden, C. A., Li, C., Lamsal, L. N., Celarier, E. A., Marchenko, S. V., Swartz, W. H., Bucsela, E. J., Joiner, J., Duncan, B. N., Boersma, K. F., Veefkind, J. P., Levelt, P. F., Fioletov, V. E., Dickerson, R. R., He, H., Lu, Z., and Streets, D. G.: Aura OMI observations of regional SO2 and NO2 pollution changes from 2005 to 2015, Atmos. Chem. Phys., 16, 4605–4629, https://doi.org/10.5194/acp-16-4605-2016, 2016.
Kuebbeler, M., Lohmann, U., and Feichter, J.: Effects of stratospheric sulfate aerosol geo-engineering on cirrus clouds, Geophys. Res. Lett., 39, L23803, 1–5, https://doi.org/10.1029/2012GL053797, 2012.
Lau, W. K. M., Yuan, C., and Li, Z.: Origin, Maintenance and Variability of the Asian Tropopause Aerosol Layer (ATAL): The Roles of Monsoon Dynamics, Sci. Rep., 8, 3960, https://doi.org/10.1038/s41598-018-22267-z, 2018.
Lelieveld, J., Bourtsoukidis, E., Brühl, C., Fischer, H., Fuchs, H., Harder, H., Hofzumahaus, A., Holland, F., Marno, D., Neumaier, M., Pozzer, A., Schlager H., Williams, J., Zahn, A., and Ziereis, H.: The South Asian monsoon pollution pump and purifier, Science, 361, 270–273, https://doi.org/10.1126/science.aar2501, 2018.
Levelt P. F., van den Oord, G. H. J., Dobber, M. R., Malkki, A., Visser, H., de Vries, J., Stammes, P., Lundell, J. O. V., and Saari, H.: The Ozone Monitoring Instrument, IEEE Trans. Geosci. Remote Sens., 44, 1093–1101, 2006.
Li, C., McLinden, C., Fioletov, V., Krotkov, Carn, S., Joiner, J., Streets, D., He, H., Ren, X., Li, Z., and Dickerson, R. R.: India is overtaking China as the world's largest emitter of anthropogenic sulfur dioxide, Sci. Rep., 7, 14304, https://doi.org/10.1038/s41598-017-14639-8, 2017.
Li, J.-L.F., Waliser, D. E., Chen, W. T., Guan, B., Kubar, T., Stephens, G., Ma, H.‐Y., Deng, M., Donner, L., Seman, C., and Horowitz, L.: An observationally based evaluation of cloud ice water in CMIP3 and CMIP5 GCMs and contemporary reanalyses using contemporary satellite data, J. Geophy. Res., 117, D16105, https://doi.org/10.1029/2012JD017640, 2012.
Lohmann, U. and Ferrachat, S.: Impact of parametric uncertainties on the present-day climate and on the anthropogenic aerosol effect, Atmos. Chem. Phys., 10, 11373–11383, https://doi.org/10.5194/acp-10-11373-2010, 2010.
Lohmann, U. and Hoose, C.: Sensitivity studies of different aerosol indirect effects in mixed-phase clouds, Atmos. Chem. Phys., 9, 8917–8934, https://doi.org/10.5194/acp-9-8917-2009, 2009.
Luo,Y., Wang, H., Zhang, R., Qian, W., and Luo, Z.: Comparison of Rainfall Characteristics and Convective Properties of Monsoon Precipitation Systems over South China and the Yangtze and Huai River Basin, J. Clim., 26, 110–132 https://doi.org/10.1175/JCLI-D-12-00100.1, 2013.
Manohar, G. K., Kahdalgaonkar, S. S., and Tinmaker, M. I. R.: Thunderstorm activity over India and the Indian southwest monsoon, J. Geophys. Res., 104, 4169–4188, https://doi.org/10.1029/98JD02592, 1999.
Martonchik, J. V, Diner, D. J., Crean, K. A., and Bull, M. A.: Regional aerosol retrieval results from MISR, IEEE Trans. Geosci. Remote Sens., 40, 1520–1531, 2002.
Medina, S., Houze Jr., R. A., Kumar, A., and Niyogi, D.: Summer monsoon convection in the Himalayan region: Terrain and land cover effects, Q. J. Roy. Metorol. Soc., 136, 593–616, https://doi.org/10.1002/qj.601, 2010.
Myhre, G., Shindell, D., Bréon, F.-M., et al.: Anthropogenic and Natural Radiative Forcing, Climate Change 2013: The Physical Science Basis. Contribution of Working Group I to the Fifth Assessment Report of the Intergovernmental Panel on Climate Change, 659–740, https://doi.org/10.1017/CBO9781107415324.018, 2013.
NASA: CALIPSO and CloudSat measurements can be obtained from http://www.cloudsat.cira.colostate.edu/data-products/, last access: 7 August 2019.
Neubauer, D., Lohmann, U., Hoose, C., and Frontoso, M. G.: Impact of the representation of marine stratocumulus clouds on the anthropogenic aerosol effect, Atmos. Chem. Phys., 14, 11997–12022, https://doi.org/10.5194/acp-14-11997-2014, 2014.
Nie, J. and Sobel, A. H.: Responses of Tropical Deep Convection to the QBO: Cloud-Resolving Simulations, J. Atmos. Sci., 72, 3625–3638, https://doi.org/10.1175/JAS-D-15-0035.1, 2015.
Niemeier, U. and Schmidt, H.: Changing transport processes in the stratosphere by radiative heating of sulfate aerosols, Atmos. Chem. Phys., 17, 14871–14886, https://doi.org/10.5194/acp-17-14871-2017, 2017.
Padma Kumari, B., Londhe, A. L., Daniel, S., and Jadhav, D. B.: Observational evidence of solar dimming: Offsetting surface warming over India, Geophys. Res. Lett., 34, L21810, https://doi.org/10.1029/2007GL031133, 2007.
Paul, S., Ghosh, S., Oglesby, R., Pathak, A., Chandrasekharan, A., and Ramsankaran, R.: Weakening of Indian Summer Monsoon Rainfall due to Changes in Land Use Land Cover, Sci. Rep., 6, 32177, https://doi.org/10.1038/srep32177, 2016.
Pitari, G., Visioni, D., Mancini, E., Cionni, I., Genova, G. Di., and Gandilfi, I.: Sulfate aerosols from non-explosive volcanoes: chemical 1–22, https://doi.org/10.3390/atmos7070085, 2016.
Pu, B. and Ginoux, P.: How reliable are CMIP5 models in simulating dust optical depth?, Atmos. Chem. Phys., 18, 12491–12510, https://doi.org/10.5194/acp-18-12491-2018, 2018.
Ramanathan, V., Chung, C., Kim, D., Bettge, T., Buja, L., Kiehl, J. T., Washington, W. M., Fu, Q., Sikka, D. R., and Wild, M.: Atmospheric brown clouds: Impacts on South Asian climate and hydrological cycle, P. Natl. Acad. Sci. USA, 102, 5326–5333, https://doi.org/10.1073/pnas.0500656102, 2005.
Randel, W. and Jensen, E.: Physical processes in the tropical tropopause layer and their role in a changing climate, Nat. Geosci., 6, 169–176, https://doi.org/10.1038/ngeo1733, 2013.
Rap, A., Scott, C. E., Spracklen, D.V., Bellouin, N., Forster, P. M., Carslaw, K. S., Schmidt, A., and Mann, G.: Natural aerosol direct and indirect radiative effects, Geophys. Res. Lett., 40, 3297–3301, https://doi.org/10.1002/grl.50441, 2013.
Richter, J. H., Tilmes, S., Mills, M. J., Tribbia, J., J., Kravitz, B., MacMartin, D. G., Vitt, F., and Jean-Francois, L.: Stratospheric dynamical response and ozone feedbacks in the presence of SO2 injections, J. Geophys. Res., 122, 12557–12573, https://doi.org/10.1002/2017JD026912, 2017.
Richter, J. H., Tilmes, S., Glanville, A., Kravitz, B., MacMartin, D. G., Mills, M. J., Simpson, I. R., Vitt, F., Tribbia, J. J., and Jean-Francois, L.: Stratospheric response in the first geoengineering simulation meeting multiple surface climate objectives, J. Geophys. Res., 123, 5762–5782, https://doi.org/10.1029/2018JD028285, 2018.
Shawki, D., Voulgarakis, A., Chakraborty, A., Kasoar, M., and Srinivasan, J.: The South Asian monsoon response to remote aerosols: Global and regional mechanisms, J. Geophys. Res., 123, 11585–11601, https://doi.org/10.1029/2018JD028623, 2018.
Shindell, D. T., Chin, M., Dentener, F., Doherty, R. M., Faluvegi, G. A., Fiore, M., Hess, P., Koch, D. M., MacKenzie, I. A., Sanderson, M. G., Schultz, M. G., Schulz, M., Stevenson, D. S., Teich, H., Textor, C., Wild, O., Bergmann, D. J., Bey, I., Bian, H., Cuvelier, C., Duncan, B. N., Folberth, G., Horowitz, L. W., Jonson, J., Kaminski, J. W., Marmer, E., Park, R., Pringle, K. J., Schroeder, S., Szopa, S., Takemura, T., Zeng, G., Keating, T. J., and Zuber, A.: A multi-model assessment of pollution transport to the Arctic, Atmos. Chem. Phys., 8, 5353–5372, https://doi.org/10.5194/acp-8-5353-2008.
Spada, M., Jorba, O., Pérez García-Pando, C., Janjic, Z., and Baldasano, J. M.: Modeling and evaluation of the global sea-salt aerosol distribution: sensitivity to size-resolved and sea-surface temperature dependent emission schemes, Atmos. Chem. Phys., 13, 11735–11755, https://doi.org/10.5194/acp-13-11735-2013, 2013.
SPARC-ASAP: Assessment of Stratospheric Aerosol Properties (ASAP), WCRP-124, WMO/TD No. 1295, SPARC Rep. 4, 348 pp., 2006.
Stier, P., Feichter, J., Kinne, S., Kloster, S., Vignati, E., Wilson, J., Ganzeveld, L., Tegen, I., Werner, M., Balkanski, Y., Schulz, M., Boucher, O., Minikin, A., and Petzold, A.: The aerosol-climate model ECHAM5-HAM, Atmos. Chem. Phys., 5, 1125–1156, https://doi.org/10.5194/acp-5-1125-2005, 2005.
Storelvmo, T., Leirvik, T., Lohmann, U., Phillips, P. C. B., and Wild, M.: Disentangling greenhouse warming and aerosol cooling to reveal Earth's climate sensitivity, Nat. Geosci., 9, 286–289, https://doi.org/10.1038/NGEO2670, 2016.
Stubenrauch, C. J., Rossow, W. B., Kinne, S., Ackerman, S., Cesana, G., Chepfer, H., Di Girolamo, L., Getzewich, B., Guignard, A., Heidinger, A., Maddux, B. C., Menzel, W. P., Minnis, P., Pearl, C., Platnick, S., Poulsen, C., Riedi, J., Sun-Mack, S., Walther, A., Winker, D., Zeng, S., and Zhao, G.: Assessment of Global Cloud datasets from Satellites: Project and Database initiated by the GEWEX Radiation Panel, Bull. Am. Meteorol. Soc., 1031–1048, https://doi.org/10.1175/BAMS-D-12-00117.1, 2013.
Taylor, K. E., Williamson, D., and Zwiers, F.: The sea surface temperature and sea-ice concentration boundary conditions of AMIP II simulations, PCMDI Rep., 60, 20 pp., 2000.
Tegen, I., Neubauer, D., Ferrachat, S., Siegenthaler-Le Drian, C., Bey, I., Schutgens, N., Stier, P., Watson-Parris, D., Stanelle, T., Schmidt, H., Rast, S., Kokkola, H., Schultz, M., Schroeder, S., Daskalakis, N., Barthel, S., Heinold, B., and Lohmann, U.: The global aerosol-climate model ECHAM6.3-HAM2.3 – Part 1: Aerosol evaluation, Geosci. Model Dev., 12, 1643–1677, https://doi.org/10.5194/gmd-12-1643-2019, 2019.
Textor, C., Schulz, M., Guibert, S., Kinne, S., Balkanski, Y., Bauer, S., Berntsen, T., Berglen, T., Boucher, O., Chin, M., Dentener, F., Diehl, T., Easter, R., Feichter, H., Fillmore, D., Ghan, S., Ginoux, P., Gong, S., Grini, A., Hendricks, J., Horowitz, L., Huang, P., Isaksen, I., Iversen, I., Kloster, S., Koch, D., Kirkevåg, A., Kristjansson, J. E., Krol, M., Lauer, A., Lamarque, J. F., Liu, X., Montanaro, V., Myhre, G., Penner, J., Pitari, G., Reddy, S., Seland, Ø., Stier, P., Takemura, T., and Tie, X.: Analysis and quantification of the diversities of aerosol life cycles within AeroCom, Atmos. Chem. Phys., 6, 1777–1813, https://doi.org/10.5194/acp-6-1777-2006, 2006.
Verma, S., Boucher, O., Reddy, M. S., Upadhyaya, H. C., Van, P. Le, Binkowski, F. S., and Sharma, O. P.: Tropospheric distribution of sulfate aerosols mass and number concentration during INDOEX-IFP and its transport over the Indian Ocean: A GCM study, Atmos. Chem. Phys., 12, 6185–6196, https://doi.org/10.5194/acp-12-6185-2012, 2012.
Vernier, J.-P., Fairlie, T. D., Natarajan, M., Wienhold, F. G., Martinsson, B. G., Crumeyrolle S., Thomason, L. W., and Bedka, K. M.: Increase in upper tropospheric and lower stratospheric aerosol levels and its potential connection with Asian pollution, J. Geophys. Res., 120, 1608–1619, https://doi.org/10.1002/2014JD022372, 2015.
Vernier, J., Fairlie, T., Deshler, T., Ratnam, M., Gadhavi, H., Kumar, S., Natarajan, M., Pandit, A., Raj, A., Kumar, H., Jayaraman, A., Singh, A., Rastogi, N., Sinha, P., Kumar, S., Tiwari, S., Wegner, T., Baker, N., Vignelles, D., Stenchikov, G., Shevchenko, I., Smith, J., Bedka, K., Kesarkar, A., Singh, V., Bhate, J., Ravikiran, V., Rao, M., Babu, R., Patel, A., Vernier, H., Wienhold, F., Liu, H., Knepp, T., Thomason, L., Crawford, J., Ziemba, L., Moore, J., Crumeyrolle, S., Williamson, M., Berthet, G., Jegou, F., and Renard, J.: BATAL: The balloon measurement campaigns of the Asian tropopause aerosol layer, Bull. Am. Meteorol. Soc., 99, 955–973, https://doi.org/10.1175/BAMS-D-17-0014.1, 2018.
Visioni, D., Pitari, G., di Genova, G., Tilmes, S., and Cionni, I.: Upper tropospheric ice sensitivity to sulfate geoengineering, Atmos. Chem. Phys., 18, 14867–14887, https://doi.org/10.5194/acp-18-14867-2018, 2018a.
Visioni, D., Pitari, G., Tuccella, P., and Curci, G.: Sulfur deposition changes under sulfate geoengineering conditions: QBO effects on transport and lifetime of stratospheric aerosols, Atmos. Chem. Phys., 18, 2787–2808, https://doi.org/10.5194/acp-18-2787-2018, 2018b.
Vogel, B., Müller, R., Günther, G., Spang, R., Hanumanthu, S., Li, D., Riese, M., and Stiller, G. P.: Lagrangian simulations of the transport of young air masses to the top of the Asian monsoon anticyclone and into the tropical pipe, Atmos. Chem. Phys., 19, 6007–6034, https://doi.org/10.5194/acp-19-6007-2019, 2019.
Wernli, H., Boettcher, M., Joos, H., Miltenberger, A. K., and Spichtinger, P.: A trajectory-based classification of ERA-Interim ice clouds in the region of the North Atlantic storm track, Geophys. Res. Lett., 43, 6657–6664, https://doi.org/10.1002/2016GL068922, 2016.
Winker, D. M., Pelon, J., Coakley, Jr. J. A., Ackerman, S. A., Charlson, R. J., Colarco, P. R., Flamant P., Fu, Q., Hoff, R. M., Kittaka, C. , Kubar, T. L., Treut, H. Le, Mccormick, M. P., Mégie G., Poole, L., Powell, K., Trepte, C., Vaughan, M. A., and Wielicki, B. A.: The CALIPSO MISSION A Global 3D View of Aerosols and Clouds, Bull. Am. Meteorol. Soc., 91, 1211–1229, https://doi.org/10.1175/2010bams3009.1, 2010.
Wu, G. X. and Zhang, Y. S.: Tibetan Plateau forcing and the timing of the monsoon onset over South Asia and the South China Sea, Mon. Weather Rev., 126, 913–927, 1998.
Yang, Y., Wang, H., Smith, S. J., Easter, R. C., and Rasch, P. J.: Sulfate aerosol in the Arctic: Source attribution and radiative forcing, J. Geophy. Res., 123, 1899–1918, https://doi.org/10.1002/2017JD027298, 2018.
Yeh, S. W., Park, R. J., Kim, M. J., Jeong, J. I., and Song, C. K.: Effect of anthropogenic sulphate aerosol in China on the drought in the western-to-central US, Sci. Rep., 5, 14305, https://doi.org/10.1038/srep14305, 2015.
Yu, P., Murphy, D. M., Portmann, R. W., Toon, O. B., Froyd, K. D., Rollins, A. W., Gao, R. S., and Rosenlof, K. H.: Radiative Forcing from anthropogenic sulfur and organic emissions Reaching the Stratosphere, Geophys. Res. Lett., 43, 9361–9367, https://doi.org/10.1002/2016GL070153, 2016.
Yu, P., Rosenlof, K. H., Liu, S., Telg, H., Thornberry, T. D., Rollins, A. W., Portmann, R. W., Bai, Z., Ray, E. A., Duan, Y., Pan, L. L., Toon, O. B., Bian, J., and Gao, R. S.: Efficient transport of tropospheric aerosol into the stratosphere via the Asian summer monsoon anticyclone, P. Natl. Acad. Sci. USA, 114, 6972–6977, https://doi.org/10.1073/pnas.1701170114, 2017.
Zhang, K., O'Donnell, D., Kazil, J., Stier, P., Kinne, S., Lohmann, U., Ferrachat, S., Croft, B., Quaas, J., Wan, H., Rast, S., and Feichter, J.: The global aerosol-climate model ECHAM-HAM, version 2: sensitivity to improvements in process representations, Atmos. Chem. Phys., 12, 8911–8949, https://doi.org/10.5194/acp-12-8911-2012, 2012b.
Zhang, Q., He, K., and Huo, H.: Cleaning China's air, Nature, 484, 161–162, 2012a.
The requested paper has a corresponding corrigendum published. Please read the corrigendum first before downloading the article.
- Article
(19801 KB) - Full-text XML
- Corrigendum
-
Supplement
(1689 KB) - BibTeX
- EndNote